Monitoring the Spread
of COVID-19 Through
Environmental Scanning
←
→
Page content transcription
If your browser does not render page correctly, please read the page content below

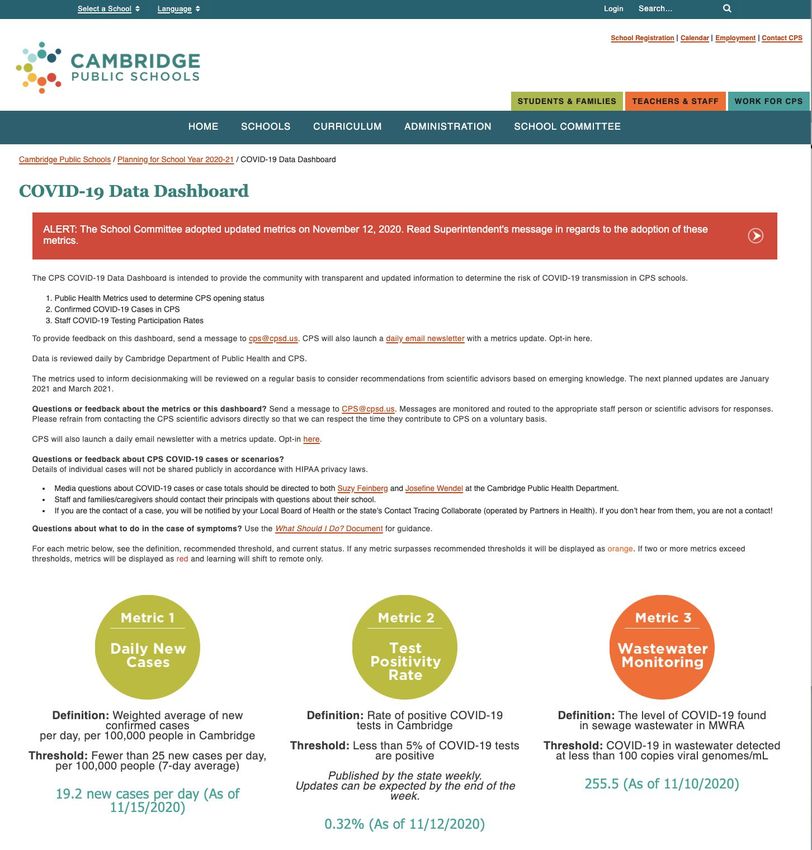
Monitoring the Spread of COVID-19 Through Environmental Scanning

SPEAKERS

              Newsha Ghaeli
              President & Cofounder,
              Biobot Analytics

              Dr. Rekha Singh
              Wastewater Surveillance Manager
              Virginia Department of Health

              Michael Harris
              Stormwater and Environmental Programs Manager,
              Department of Works
              New Castle County, Delaware

2   N A C o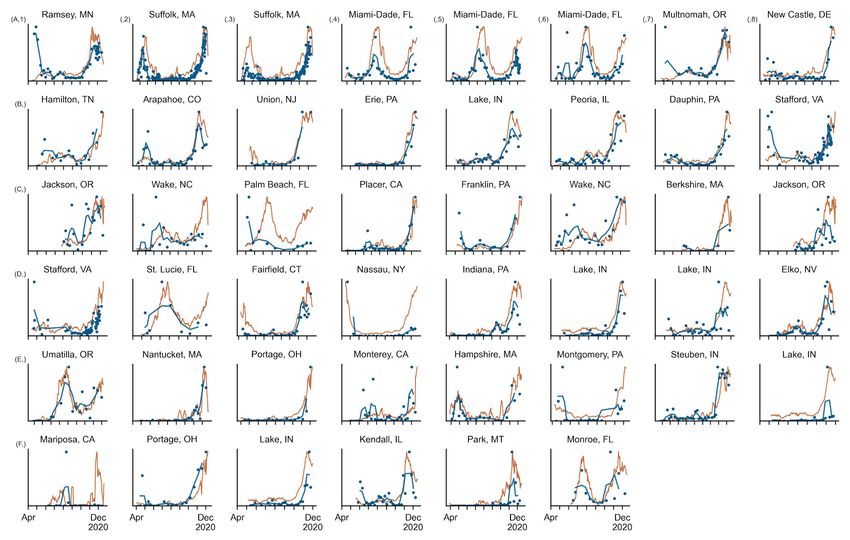
NOW SPEAKING:

    Newsha Ghaeli
    President & Cofounder,
    Biobot Analytics

3   N A C o
NOW SPEAKING:

    Dr. Rekha Singh
    Wastewater Surveillance
    Manager,
    Virginia Department of Health

4   N A C o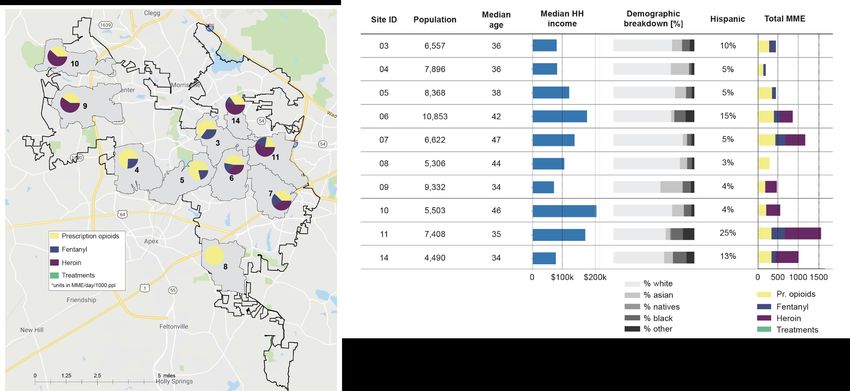
Wastewater Surveillance in Virginia

Presentation to: National Association of Counties (NACo)
Rekha Singh, PhD, MPH | VDH-OEHS
April 20, 2021
VDH WWS Team Members

                                     Marcia Degen, PhD, PE
                                              Project Coordinator

 Rekha Singh, PhD, MPH                                                      Michelle Yancey, MPH
   Wastewater Surveillance Manager                                          Wastewater Surveillance Data Analyst

                                      Haniyyah Majeed, MS
                                     Wastewater Surveillance Data Manager
Wastewater Surveillance in Virginia

                                                            Purcellville Centreville
                                                                          (UOSA)
                                                                                 Alexandria
                                         Harrisonburg                        Fairfax
                                                                            Stafford County
                                          Waynesboro             UVA
                                      VMI & W&L
                                  Roanoke                                 Richmond
                                  (WVWA)           Lynchburg
                         Virginia Tech                                                         HRSD
                         & Blacksburg                                                         Service
                                                        Danville                               Area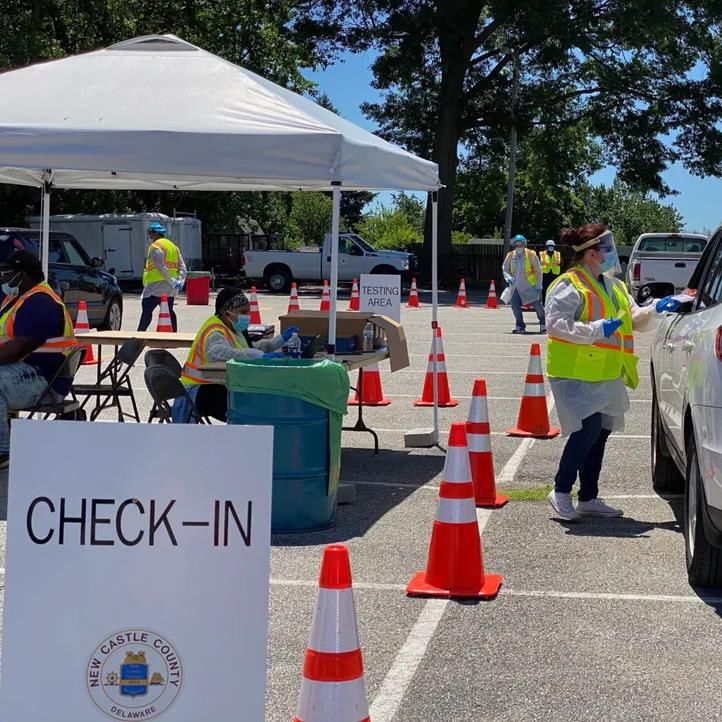

Goals of Virginia Surveillance Program

           Goal 1. Data                  Goal 2. Data Analysis     Goal 3. Community of
            Collection                    and Visualization              Practice
     ●   Optimize data                   ●   Overlay case data     ●   Facilitate
         transfer                            onto sewersheds           participation
     ●   Develop core                    ●   Provide training on   ●   Improve data
         standards                           data use                  collection and
     ●   Create training                 ●   Create                    methods
         materials on core                   visualizations with   ●   Resolve issues
         standards                           interpretation            around reporting
                                         ●   Improve data          ●   Create a channel for
                                             analysis/reporting        feedback
Partner Contributions

                  Utilities       Laboratories     Other Partners
           ●   Sampling       ●   Testing         ● Surveillance
               methods            methods           efforts
           ●   Operational    ●   Data            ● Field expertise
               factors            comparability   ● Public health
           ●   Data sharing   ●   QA/QC             action
Active Workgroups in VA
SOUTHWESTERN VA
EASTERN VAHRSD SARS-CoV-2 Surveillance Data
Program Challenges

   ●    Allocation of funding
         ○ Initial funding for staff only
         ○ All sampling done voluntarily (no funding for sampling)

   ●    Our challenge
         ○   Communicate the need clearly
         ○   Simplify data sharing process
         ○   Keep open lines of communication
         ○   Demonstrating the usefulness of data to public health
             professionals
ELC Funding -
New Project Proposal: August 2021
● Enhance surveillance in Virginia
○ Sentinel monitoring, localized projects, etc.
● Develop or enhance partnerships
○ Support data collection/reporting to NWSS
● Participate
○ NWSS Public Health Community of Practice
● Collaborate
○ Other health departments/jurisdictionsQuestions?
Thank you!

 rekha.singh@vdh.virginia.gov
 marcia.degen@vdh.virginia.gov
haniyyah.majeed@vdh.virginia.gov
michelle.yancey@vdh.virginia.gov
NOW SPEAKING:

     Michael Harris
     Stormwater and Environmental
     Programs Manager,
     Department of Works
     New Castle County, Delaware

17   N A C o
Looking Down the Drain: How The Sewer Became An Emerging Public Health Resource
About New Castle County
• Northernmost of 3 Delaware Counties
• Population 560,000
• NCC Government provides police and paramedics service
  plus manages parks, libraries, buildings, land use,
  stormwater management and operation of the sanitary
  sewer.
• Operate 3 wastewater treatment plants and 1,600 miles of
  sanitary sewer.
Facing a public health
crisis
• Spring of 2020–
    • Changing information and knowledge of
       SARS-CoV-2
    • Lack of federal guidance and leadership
    • Lack of adequate testing
Wastewater Epidemiology • Looks for biomarkers or chemicals in wastewater to assess health of population • Equivalent to obtaining fecal and urine sample from everyone in the sewered population. • 2013 Wastewater Epidemiology detected re-emergence of Polio in Israel • More recently, used for detecting Opiods • Biobot Analytics study in Cary, NC • Helped direct resources – 40% reduction in overdoses • Vast Potential- SARS-CoV-2 and beyond
Evolution of Our
Program
• NCC entered one sample in the Biobot pro bono
  study
• Wilmington WWTP Influent tested on a weekly
  basis starting April 15th (450,000+ residents)
• Added 11 additional sites a few weeks later for
  better identification of the magnitude and extent
  of the outbreak. 12 sites in paid study
• Moved testing to UD Center for Environmental
  Wastewater Epidemiology Research (CEWER)
• Assembled team of experts from UD, Christiana
  Care, Delaware Data Innovation Lab, and Duffield
  Associates to review data and steer efforts
An estimate of the scope of the outbreak independent
                from patient testing or hospital reporting, and inclusive
                of data from asymptomatic individuals,

                Decision support for officials determining the timing and

What This       severity of public health interventions to mitigate the
                overall spread of the disease,

Wastewater
Data Provides   A means of tracking the effectiveness of interventions
                and measure the wind-down period of the outbreak,
                and

                An early warning. Data acts as a “leading indicator” of
                more clinical cases.
CEWER analysis of SARS-CoV-2 across the
county includes analysis of samples twice a
week at 4 wastewater treatment plants of
varying sizes
Wilmington
Delaware City
Wilmington ~500,000 People
Delaware City ~2,500 People
Port Penn
Port Penn ~400 People
M.O.T.
M.O.T. ~17,000 PeopleLeading Indicator
Visualizing Virus Levels Detected Over Time
                                                                    The reductions of virus in wastewater are accompanied by reductions in clinical cases
                                                           800

                         New Daily COVID-19 Cases in New
                                                           700

                                                           600

                                  Castle County
                                                           500

                                                           400

                                                           300

                                                           200

                                                           100

Viral Levels Detected                                       0
< 10,000
10,001 - 18,000
18,001 - 32,000
                                                                 8/13 8/20 8/27 9/3 9/10 9/17 9/24 10/1 10/8 10/15 10/22 10/29 11/5 11/12 11/19 11/24 12/3 12/10 12/17 12/29 1/7 1/14
32,001 - 56,000
56,001 - 100,000               Wilmington
100,001 - 180,000
180,001 - 320,000              Delaware City
320,001 - 562,000
562,001 - 1,000,000            Port Penn
1,000,001 - 1,800,000
1,800,001 - 3,200,000          M.O.T.
3,200,001 - 5,620,000
5,620,001 - 10,000,000
NCC Dashboard https:/newcastlede.gov/CEWER
Siting Covid Testing
Locations
Path Forward

Regular meetings with wastewater               Move to smaller sewer catchments   Potentially looking for SARS-CoV-2
epidemiology team:                                                                variants in wastewater.
Christiana Care
Delaware Data Innovation Lab
Duffield Associates
University of Delaware Center for Wastewater
Epidemiology (CEWER)
Using the data to evaluate public health
actions
Small Catchment Areas
• Scientists do not fully understand shedding rates of SARS-CoV-2 related to positive clinical
  cases or asymptomatic individuals
• In October and November 2020 our team studied virus detected across six residence halls
  including where students were isolated (positive clinical cases) or quarantined (exposure). We
  continue to assess this data.
• Expanding pilot into public and private schools

                                                                                   University of
                                                                                   Delaware and Duffield
                                                                                   Associates collect
                                                                                   samples at a
                                                                                   residence hall at UD,
                                                                                   Fall 2020
Looking for variants
• Small changes in the virus genome, called
mutations, occur naturally as viral genomes are
copied
• Some SARS-CoV-2 variants are now being
identified around the world
• Our team is investigating sequence analysis of
the virus community within the sewershed
• Not simple due to the relatively low amount of virus
in each sample and the high numbers of different
virus types, which may include multiple variants of
interestSome Lessons Learned
• Not established textbook science – on
leading edge. Methodology and reporting
has changed several times throughout our
study.
• Case estimate science changed and is
more complex.
• Constantly evolving improvements
• Normalizing viral data by comparison with
other viral markers in stool to account for
rainwater in sewer.Thinking beyond SARS-CoV-2
• Wastewater epidemiology
infrastructure now in place.
• Ready for the future
• SARS-CoV-2 re-
emergence
• Opiods
• Influenza
• The next pandemicIn Closing
• Place your question/comment in the
               “chat box”

QUESTIONS?   • Use the “raise hand” function to be
               recognized

             • Unmute when appropriate

                                         N A C o   38
SPEAKER CONTACTS
Jennings Heussner
Business Development Manager,
Biobot Analytics
jennings@biobot.io
Dr. Rekha Singh
Wastewater Surveillance Manager
Virginia Department of Health
rekha.singh@vdh.virginia.gov
Michael Harris
Stormwater and Environmental Programs Manager,
Department of Works
New Castle County, Delaware
NewCastleDE.gov/PublicWorks
39
N A C oBiobot Analytics We are building early warning health analytics from data available in our sewers. Newsha Ghaeli President and Cofounder newsha@biobot.io
Our wastewater epidemiology platform enables early
  warning health analytics to combat pandemics.

   Predictive                Inclusive                  Versatile

                             Everyone has a voice       Wastewater is a rich
   Wastewater data is a
                            in the sewer. Our data     source of health data,
   leading indicator for
                           includes everyone, not        including Covid19,
  new infectious disease
                                just people who       influenza, opioids, diet,
          cases.
                              access clinical care.     stress, and others.

                                                                                 3
The largest database of its kind.
Metro areas
500k+
Population Towns and
Cities sizes per rural areas
community
50-500k < 50k
states + samples of U.S.
46 provinces 8000+ tested 13% population
4We are leading the emerging market
of wastewater epidemiology
5FastCo biotech award: #3 behind Pfizer and Moderna
6We started by addressing the opioid epidemic
SARS-CoV-2 is
shed in the stool
of infected
patients
How it works

         1                       2                         3                           4                         5
Online Order Form       Biobot shipping kit          Lab analysis            Computational biology         Report and
                                                                               and data science            Dashboard
 Customers sign up       Next day delivery of     Molecular biology and                                  Data analysis and
                                                                                We develop models
and order kits online      sample at 4C.           chemistry analyses,                                  visualization is then
                                                                               based on wastewater
                                                applying Biobot’s protocol       and clinical data.   packaged as a report for
                                                   in high-throughput.                                 public health officials.
“It’s amazing how many residents wait for these numbers
and have come to trust these more than [clinical] testing”
— Wastewater treatment plant director
in the State of MassachusettsNationwide trends (legend) 7-day average of new cases 3-sample average wastewater concentration
Early indicator of spikes for early
                    intervention

                    Wastewater data is a leading indicator for new
                    Covid-19 cases with 5-10 days of advance.

Data insights are
our core value      Estimate COVID-19 incidence
                    We have built a proprietary model to estimate the

proposition         number of new Covid-19 infections in a community.

                    Ranking amongst nationwide database
                    We contextualize if the level of infection is low or high,
                    by comparing against our nationwide database of
                    communities.

                                                                                 16
We can build
hundreds of
applications with Mental health
Covid-19
our platform
Opioids
InfluenzaOpportunities for WBE Government Assisted Living Places of work Prisons 16,000 WWTPs 32,000 homes 900,000 offices 5,000 prisons & jails Universities Schools Aircrafts Ships 5,300 colleges 110,000 schools 10 million flights / year 2,000+ ships
A permanent pillar of
pandemic preparedness

                        25
Thank you!
Newsha Ghaeli
PRESIDENT & COFOUNDER
newsha@biobot.ioYou can also read