Texas Economic Performance and Outlook Amidst COVID-19 Pandemic
←
→
Page content transcription
If your browser does not render page correctly, please read the page content below
Texas Economic Performance and
                        Outlook Amidst COVID-19 Pandemic

                                                                                                                                Laila Assanie
                                                                                                Federal Reserve Bank of Dallas
                                                                                                                                     6/18/2020
DISCLAIMER: The views expressed are the authors’ and do not necessarily reflect the views of the Federal Reserve Bank of Dallas or Federal Reserve System.
Connecting Regional Economies

                                Federal Reserve Districts

                                                            2
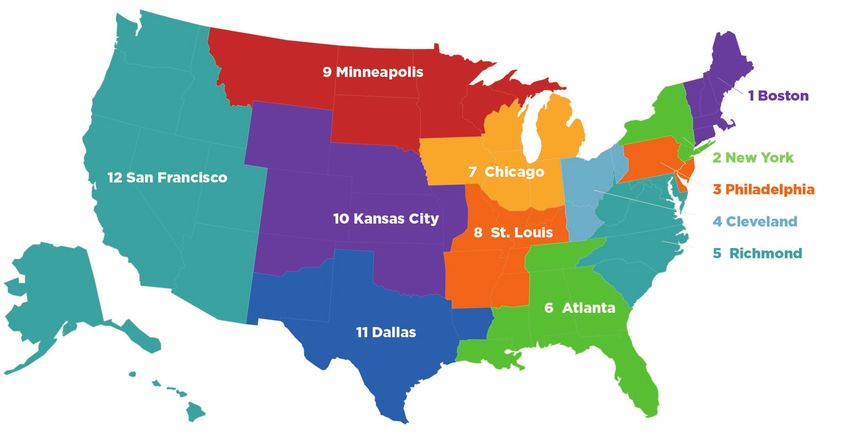
Serving the
Eleventh District

                    3
Texas in the COVID-19 Pandemic
4Overview
Sharp, sudden contraction in economic activity and employment due to COIVD-19
induced shelter-in-place regulations
Record declines in activity in March and April, less-severe contraction in May
Activity appears to be gradually improving as economy reopens, but the path of the
virus is unpredictable, creating heightened uncertainty for businesses and
individuals
So far Texas matching or beating US performance, but this may change due to the
state’s industrial mix
Higher share of employment in vulnerable industries
The economic crisis appears to have broadly peaked but may take time to unwind
5All states shed jobs from Feb to Apr; Northeast/Midwest suffer
largest losses
Percent change, Apr 2020/Feb 2020, SA
0
-5
-10
Texas
-15
U.S.
-20
-25
MI
MA
ME
OH
WA
WI
IN
OR
MD
IL
MN
MT
IA
MO
GA
ID
MS
OK
WV
WY
VT
NY
NJ
RI
HI
NV
PA
DE
NH
CT
KY
LA
FL
TN
TX
AK
CA
U.S.
NC
SC
CO
NM
AL
AZ
VA
ND
KS
NE
UT
SD
AR
DC
SOURCES: Bureau of Labor Statistics.
6Texas job losses less severe than U.S.
(April/Feb.)
Annualized job growth (percent)
0
-9.5 -8.0
-20 -16.7
-23.8 -26.5
-40 -32.1
-37.8 -39.6
-41.8
-45.5 -45.1
-50.9 -48.3 -49.5 -49.0
-60 -52.6
-59.7 -57.2 -57.8
-68.9
-80
U.S. Texas
-100 -93.9
-98.1
-120
Total Trade, Gov't Prof. & Educ. & Leisure Mfg. Fin. Constr. Info. & Oil & Gas,
Transp. (16.6%) Bus. Serv. Health & Hosp. (7.4%) Activ. (6.3%) Other Svcs Mining Sup.
& Util. (14.5%) Serv. (7.6%) (6.8%) (4.9%) (1.7%)
(20.3%) (13.8%)
NOTE: Data show April 2020/Feb. 2020 annualized growth. Numbers in parenthesis indicate share of total state employment for April.
SOURCES: Bureau of Labor Statistics; Texas Workforce Commission; FRB Dallas.
7Texas unemployment rate spikes; still below nation’s
Percent, SA
16
14
13.3
12.8
12
10
8
6 U.S.
Texas
4
2
0
'00 '02 '04 '06 '08 '10 '12 '14 '16 '18 '20
NOTES: Data through April for Texas and May for the U.S. Grey bars show U.S. recessions.
SOURCES: Bureau of Labor Statistics; Texas Workforce Commission; adjustments by the Dallas Fed.
8Unemployment claims remain elevated
Weekly total unemployment insurance claims, index, Jan. 2020 = 100
1600
1400 U.S.
1200
1000
800 Texas
600
400
200
0
Jan. Feb. Mar. Apr. May Jun
NOTE: Data through the week ending June 6.
SOURCE: Department of Labor.
9Layoffs hitting all sectors in Texas
UI claims as a share of industry employment, percent
35
30 29
26 25
25 23
21
20
20 18
15 14 13 13 13
12 11 11
9
10
7
5 4
2
0
0
NOTES: Claims data for week ending March 7 through week ending June 6. Employment for Feb. 2020.
SOURCES: BLS LAUS program; Texas Workforce Commission
10Layoffs span all Texas metros; border cities and energy centers
Claims per 1,000 workers harder hit
200 190 185
178 174
180 171 169
163 163 160
160 154 152 151
145 144 141 139
140 135 135
127 125
120 118
120 108 108
100
80
60
40
20
0
NOTES: Claims data for week ending March 7 through week ending June 6. Employment for Apr. 2020.
SOURCES: BLS LAUS program; Texas Workforce Commission
11Texas Business Outlook indexes show services,
manufacturing activity contracting more slowly in May
Diffusion index, SA
60
Revenue (Services)
40
20
12.4
9.2
0
-20 -28.0
-28.1
-40 Production (Manufacturing)
-60
-80
2008 2009 2010 2011 2012 2013 2014 2015 2016 2017 2018 2019 2020
NOTES: Data through May 2020. Dashed lines are post-recession averages.
SOURCE: Federal Reserve Bank of Dallas Texas Business Outlook Surveys (TBOS).
12Most Texas firms see a sizeable dip in revenues
How do your firm’s current revenues compare with a typical May?
Revenues are up (161%)
10.18
Revenues are normal
8.62
Revenues are down
(59.9%)
81.20
NOTES: Pie chart shows the share of responses belonging to each answer. Numbers in parentheses show average response to how revenues
compare with typical May revenues within each answer.
SOURCE: Dallas Fed Texas Business Outlook Surveys, May 2020 Special Questions.
13May survey suggests nearly one-fourth of firms unable to survive
beyond six months at current revenue levels
If current revenue levels were to continue, how long could your firm survive?
1.0%
8.0%
14.2%
7.2%
59.2%
10.3%
Less than a month 1-3 months 4-6 months 7-9 months 10-12 months More than a year
SOURCE: Federal Reserve Bank of Dallas Texas Business Outlook Surveys, May 2020 Special Questions.
14Majority of firms applied for and have received PPP funding
“Have you applied for a PPP (Paycheck Protection Program) loan?”
“If you applied for a PPP loan, have you received it?”
60% 93%
of surveyed firms of those that have
have applied for a applied have received
PPP loan their loan
SOURCE: Dallas Fed Texas Business Outlook Surveys, May 2020 Special Questions.
15PPP borrowers largely able to stave off layoffs, wage reductions
How did receiving the PPP loan benefit your firm?
Share of responses, percent
90
80
78
70 66
60 52
50
40
30
21
20 15
10
0
Prevented layoffs and/or Prevented wage reductions Helped us pay bills and/or rent Allowed for rehiring of workers Other
furloughs
NOTES: Data collected from 216 business executives from May 12-20, 2020. Respondents asked to select all options that apply.
SOURCE: Dallas Fed Texas Business Outlook Surveys, May 2020 Special Questions.
16Texas firms shift to working from home
Have you taken any of the following steps regarding employment in response to COVID-19?
Share of responses, percent
80
69
70
60
50 43
40 33
30 23
20 19 17
20
11 11
10
0
Increased Reduced work Reduced or Paid time off Furloughs Layoffs Reduced wages Other None
working from hours (including suspended
home cutting overtime) bonuses
NOTES: Data collected from 389 business executives from May 12-20, 2020. Respondents asked to select all options that apply.
SOURCE: Dallas Fed Texas Business Outlook Surveys Special Questions.
17Among firms facing difficulty recalling workers, infection fears, lack
of child care cited as significant challenges
Have you attempted to recall any laid off/furloughed Were there any impediments to recalling workers or increasing hours?
workers or increase hours among current workers?
Share of responses, percent
70
60.0
60
50 46.7
43.3
Yes
33.3 40
30.0
30
20
10 6.7
No
66.7 0
Fear of infection Lack of child care Generous Other None
unemployment
benefits
NOTE: Data collected from 60 business executives from May 12-20, 2020.Question posed to respondents who indicated
NOTE: Data collected from 186 executives who that they were attempting to recall workers or increase hours. Respondents were asked to select any and all choices that
indicated that they have attempted to recall any laid applied.
off/furloughed workers or increase hours among current SOURCE: Dallas Fed Texas Business Outlook Surveys Special Questions.
workers.
18Mobility increasing and workers starting to come back,
daily new Texas COVID cases rising again
Texas Mobility and Engagement and COVID-19 Spread
Count, 7 day avg. 5/1: Phase 1 Index, 7 day avg.
2500 COVID19 daily new cases of re-
5/22: Phase 6/12: 110
2 of re- 6/3: Phase 3 Restaurants
COVID19 daily deaths opening 100
opening of re-opening
2000 Mobility and engagement expand to 90
Num. of hourly employees working 75% capacity 80
2205
1500 70
60
50
1000 40
30
500 20
26 10
0 0
-10
-500 -20
-22 -30
- 52 (4/10) -40
-1000
-50 -50
-60
-1500 -70
-80
-2000 -90
-107 (4/10) -100
-2500 -110
3/1 3/8 3/15 3/22 3/29 4/5 4/12 4/19 4/26 5/3 5/10 5/17 5/24 5/31 6/7 6/14
NOTE: Mobility and engagement index data up to June 13, 2020, Homebase data up to June 15, 2020, all other data up to June 16. Mobility and engagement index values are scaled such
that the national index average over January-February are subtracted out and divided by the national value in the week ending in April 11, the lowest national weekly value. Mobility and
engagement index value can be interpreted as mobility and engagement relative to the national trough in mobility and engagement.
SOURCES: Homebase, Johns Hopkins University, SafeGraph, Federal Reserve Bank of Dallas.
19Restaurant reservations in Texas lose some momentum in June
Percent change, y/y, 7 day moving average
20
-50
0 -60
-70
-80
-20
-90
-100
-40 Texas
Houston
-60 San Antonio
Dallas
-80 Austin
U.S.
-100
Feb Mar Apr May June
NOTE: Data through June 16, 2020. Data refers to year/year percent change in seated diners at restaurants on the OpenTable network across all channels: online
reservations, phone reservations, and walk-ins.
SOURCE: OpenTable.
20So far Texas matching or beating US performance, but
this may change
Negative factors
Low oil prices
Texas job growth is less than nation’s when oil prices fall to very low levels
Less remote work capability
Texas has a lower share of workers that can work from home
More vulnerable industries
Texas has a greater share of employment in industries harmed by social distancing
Texas more exposed to international trade, Mexico
Positive factors
Typically grows faster than nation
Flexible labor markets, good business climate
Fewer COVID risk factors?
Low density metros, lack of mass transit
21Fewer can work remotely in Texas
U.S. 0.39
Texas 0.37
Male 0.34
Female 0.42
No college degree 0.27
With college degree 0.57
Income=$60,000 0.57
White 0.47
Black 0.33
Asian 0.50
Hispanic 0.23
Houston 0.40
Dallas/Fort Worth 0.42
Austin 0.48
San Antonio 0.37
Other areas in Texas 0.28
0 0.1 0.2 0.3 0.4 0.5 0.6 0.7
Percent of Workers Compatible with Remote Working
NOTE: All samples, except for the top bar are restricted to workers in Texas.
SOURCE: IPUMS; Dallas Fed; author's calculations.
22Texas has more employment at risk in pandemic
Share of total employment
25
20
9.6 Accommodations & food services
Administration & support services 9.2
15
Transportation & warehousing
Energy
10 6.1
Arts, entertainment & recreation 5.8
5 4.2
3.7
1.7 0.3
1.2 1.6
0
Texas U.S.
NOTE: Data is from March 2020.
SOURCES: Bureau of Labor Statistics; Texas Workforce Commission; seasonal and other adjustments by the Dallas Fed.
23DFW Economy Amid the COVID-19 Pandemic
24Business-Cycle Indexes indicate sharp contraction in DFW
Percent, year/year Dallas
10
Fort Worth
5
0
2008 2009 2010 2011 2012 2013 2014 2015 2016 2017 2018 2019 2020
-5 -6.04
-10
-12.33
-15
NOTES: Business-cycle indexes through April 2020. Dashed lines are long-run (20-year) averages.
SOURCE: Federal Reserve Bank of Dallas.
25Mobility increasing and workers starting to come back,
daily new COVID-19 cases rising again in DFW
Dallas-Fort Worth Social Distancing and COVID-19 Spread
Index, 7 day avg.
Count, 7 day avg. May 1: Most retailers, dine-
in restaurants allowed to June 3: Phase 3 June 12:
open at 25% capacity May 22: Phase 2 of re-opening Restaurants expand
of re-opening to 75% capacity
700 120
604
600
COVID19 daily new cases
500
Mobility and engagement (Index) 80
400 Num. of Hourly Employees Working (Index)
300
40
200
100
0 0
-100
-200 -23 -40
-300
-59
-400
-80
-500
-600
-700 -120
3/1 3/7 3/13 3/19 3/25 3/31 4/6 4/12 4/18 4/24 4/30 5/6 5/12 5/18 5/24 5/30 6/5 6/11 6/17
NOTE: Mobility and engagement index data up to June 12, 2020, Homebase index up to June 16. Case data through June 17, 2020.
SOURCES: Homebase; Johns Hopkins University; SafeGraph.
26DFW leads major Texas metros in net migration gains since 2010
Net migration, thousands
800
700
600
500
400
300
200
100
0
-100
DFW Houston Austin San Antonio El Paso
NOTE: Data are for July 2010 to July 2019.
SOURCE: U.S. Census Bureau, Population Division.
27Reason for migrating to Texas versus elsewhere
Reason Texas Non-Texas
Relocated for job 50.9 41.3
Family Reasons 26.6 26.6
Amenities 17.8 23.8
Other 4.7 8.3
NOTE: Data refer to 2010-2019.
SOURCES: CPS-ASEC; author’s calculations.
28Texas and DFW Real Estate Markets
29Residential construction weakens
Index, Jan.‘10=100, 5 MMA, SA
600 Single-family Multifamily
(percent growth) (percent growth) Multifamily permits DFW
2019 2020 YTD 2019 2020 YTD
500 DFW -3.7 17.7 4.4 -0.8
Texas -0.3 17.9 22.8 5.8
400
300
Multifamily permits Texas
200 Single-family permits DFW
Single-family permits Texas
100
0
2011 2012 2013 2014 2015 2016 2017 2018 2019 2020
NOTE: Last data point is April 2020. Table refers to percent growth in annual totals. Table 2020 YTD data for January-April 2020.
SOURCES: U.S. Census Bureau; seasonal adjustments by FRB of Dallas.
30Apartment rent payments slightly below 2019
Percent June 1-13, 2020 June 1-13, 2019
95
93.9
94 93.5 93.5
93.2 93.2 93.2 93.2
93 92.7
92.2
91.9
92
91
90
89.0 88.9
89
88
87
86
Austin Dallas San Antonio Fort Worth Houston U.S.*
NOTE: US data are from National Multifamily Housing Council. Texas metro data provided by RealPage Inc.
SOURCES: RealPage Inc.; National Multifamily Housing Council.
31Home sales fall sharply in the wake of COVID-19
Index, 3MMA, Jan. 2011 = 100, SA
170
Fort Worth
160
Texas
150
Dallas
140
U.S.
130
120
110
100
90
2012 2013 2014 2015 2016 2017 2018 2019 2020
NOTE: Data through April 2020.
SOURCES: Multiple Listing Service; seasonal and other adjustments by Dallas Fed.
32Home sales dip across price points
Dallas-Fort Worth-Arlington
Index, Mar. 2011=100, 3MMA, SA
700 6% $400-499k
12% $300-399k
600 12%
10%
$200-299k
500
More than $499k
22%
38%
400 $150-199k
Less than $150k
300
200
100
0
2011 2012 2013 2014 2015 2016 2017 2018 2019 2020
NOTES: Data are through April 2020. Pie chart data for 2020 YTD. Underlying data in nominal dollars.
SOURCES: Multiple Listing Service, seasonal and other adjustments by FRB Dallas.
33Inventories tight
Dallas-Fort Worth-Arlington
Months of Inventory, SA More than $499k
14 $400-499k
$300-399k
12
$200-299k
10
$150-199k
8 Less than $150k
6
4.5
4 3.5
2.9
2.1
2 2.0
1.8
0
2011 2012 2013 2014 2015 2016 2017 2018 2019
NOTES: Dashed line at six months of inventory indicates balanced level of supply. Data are through April 2020.
SOURCES: Multiple Listing Service, seasonal and other adjustments by FRB Dallas.
34House price appreciation holding steady
Percent, year/year, SA
12
10 DFW
8
6
4 U.S.
2
0
-2
-4
-6
2010 2011 2012 2013 2014 2015 2016 2017 2018 2019 2020
NOTES: Data through March 2020. Case-Shiller HPI for DFW is used to approximate Texas.
SOURCE: Standard & Poor’s CoreLogic Case-Shiller Home Price Index.
35What business contacts are saying about
new-home sales in DFW
“Sales remain solid to this point.”
“DFW, San Antonio, and Austin were pretty strong. Houston was a little slow. Dallas is
shaping up to have a better month than we expected. We expect monthly sales for
April to be about 2/3 of what they were last year.”
“… over the past few weeks we have done a really good job of moving our prospects
to contract and this week was a rebuilding prospect week. We have a better start to
the week already with multiple contracts in the works.”
“We had a good week here in Dallas. We were almost double last week’s gross
number. We ended up netting about 90% of plan. I have heard quite a few deals
already in the process that should finish in the next couple of days. Keeping fingers
crossed.”
36DFW office absorption softens ahead of the pandemic
Net absorption, millions
16
14 DFW
12 Houston
Austin
10 San Antonio
8
6
4
2
0
-2
-4
2010 2011 2012 2013 2014 2015 2016 2017 2018 2019 Q1 2020
NOTE: Data through Q1 2020. San Antonio data missing in Q1 2014, Q2-Q4 2016.
SOURCE: CBRE Research.
37Outlook for 2020
38Texas employment expected to rebound in second half but
Percent, SAAR
end the year below 2019 levels
150.0
Percent, Y/Y 116.8
5.0
100.0 0.0
-5.0
-10.0 -3.8
-15.0
50.0
0.0
-50.0
-69.0
-100.0
Jul-19 Aug-19 Sep-19 Oct-19 Nov-19 Dec-19 Jan-20 Feb-20 Mar-20 Apr-20 May-20 Jun-20 Jul-20 Aug-20 Sep-20 Oct-20 Nov-20 Dec-20
NOTE: Forecast scenario estimates Texas payroll employment for May based on initial claims data and the remainder of the year based on US GDP growth of -42.3% Q2, +16.3% Q3, and
+22.8% Q4, as well as direct COVID-19 impacts from March to May and WTI prices following the futures contract curve as of 6/1.
39Texas unemployment rate expected to slowly decline
Percent, SA
16
14.9
14
12.8
12
10
8 8.9
6
3.5
4
2
Jul-19 Aug-19 Sep-19 Oct-19 Nov-19 Dec-19 Jan-20 Feb-20 Mar-20 Apr-20 May-20 Jun-20 Jul-20 Aug-20 Sep-20 Oct-20 Nov-20 Dec-20
NOTE: Forecast scenario estimates Texas payroll employment for May based on initial claims data and the remainder of the year based on US GDP growth of -42.3% Q2, +16.3% Q3, and
+22.8% Q4, as well as direct COVID-19 impacts from March to May and WTI prices following the futures contract curve as of 6/1.
Unemployment rate forecast assumes a labor force participation rate of 63.8 and a payroll/household employment ratio of 0.97 at year-end.
40Summary
Pandemic is unprecedented and has many aspects of a natural disaster instead of a
typical recession
Economic activity is slowly recovering; path of the virus and consumer demand and
business responses highly uncertain
Most economists expect a sharp decline in Q2 and recovery in the second half – but
still expect to end the year down more than in the Great Recession
Weakness in the energy industry will likely be drag on Texas, dampening the state’s
recovery in the second half of 2020
Factors such as a central location, low cost of living, flexible labor markets, good
business climate will be favorable for DFW in the long run
4142
Stay Connected

Find COVID-19 updates and resources
dallasfed.org/covid       federalreserve.gov/covid-19

Sign up for Dallas Fed content of interest
dallasfed.org/subscribe

                                                        43
You can also read