COVID-19 transmission across Washington State
←
→
Page content transcription
If your browser does not render page correctly, please read the page content below
COVID-19 transmission across
                  Washington State

           Washington State Department of Health
                                  January 27, 2021

To request this document in another format, call 1-800-525-0127. Deaf or hard of hearing
customers, please call 711 (Washington Relay) or email civil.rights@doh.wa.gov.

Publication Number 820-114

For inquiries about this report from media, contact the Public Information Desk:
doh-pio@doh. wa.gov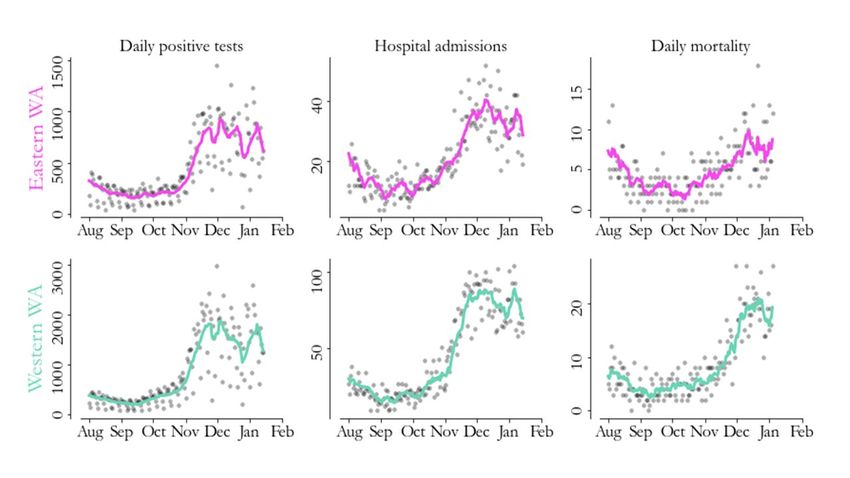
SitRep 25: COVID-19 transmission across Washington State
Gitanjali Singh1, Ian Painter1, Niket Thakkar2, Mike Famulare2, Juan M. Lavista Ferres3, Ruth Etzioni4, Barbra A. Richardson4,5,
Cathy Wasserman1
1
Washington State Department of Health; 2 Institute for Disease Modeling; 3 Microsoft AI For Health; 4 Fred Hutch Cancer Center;
5
University of Washington
Results as of January 27, 2021.
We are publishing situation reports on a biweekly schedule on Wednesdays to better accommodate
news cycles. If, on an off week, we identify a time-sensitive feature in the data, we will produce an
updated report that week to ensure that changes in the situation are reported quickly.
For a comprehensive and up-to-date picture of what’s happening around the state, see the WA State
COVID-19 Risk Assessment and WADoH COVID-19 data dashboards.
Summary of current situation
Using data from the Washington Disease Reporting System (WDRS) through January 14, we estimate the
reproductive number ( Re ) in western Washington on January 8 was likely between 0.58 and 0.88, with a
best estimate of 0.73. Meanwhile, we estimate that in eastern Washington, Re was likely between 0.51
and 0.91, with a best estimate of 0.71 (Figure 1).
Figure 1: Re estimates for eastern (pink) and western (green) WA, with 2 standard deviation error bars.
Our most recent estimates show Re has decreased in both eastern and western Washington since peaks
in late December. To reduce levels of cases and hospitalizations, Re needs
to maintain a value
substantially below 1 for a sustained period of time.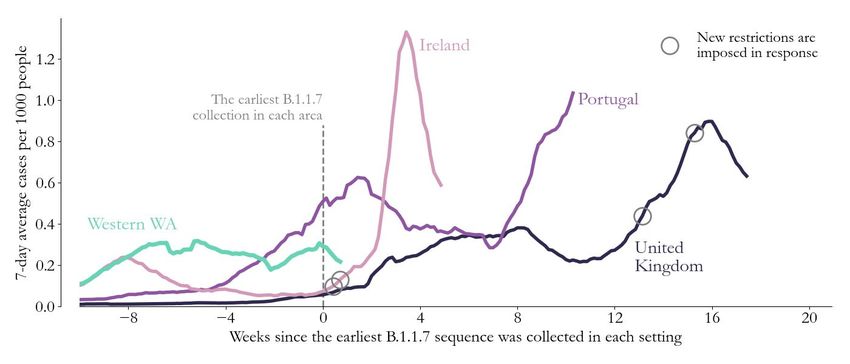
Figure 2: Seven-day rolling case counts (left panels), hospital admissions (middle panels) and deaths (right panels) for eastern Washington (top) and western Washington (bottom) through January 14 (cases and hospitalizations) and January 4 (deaths). Because of a change in how confirmed deaths are being reported, we are using an earlier cutoff for the mortality panel. Details In both eastern and western Washington, the rebounds in case counts following the December holidays dropped sharply after the first week of January (Figure 2). The sharp decline in case counts from early December to Christmas likely represents both decreased transmission and delayed healthcare seeking around Christmas. This was followed with a steep increase that likely represents increased healthcare seeking as well as increased transmission due to holiday gatherings. Case declines after the first week in January indicate decreased prevalence. A similar trend is apparent in hospital admissions in both eastern and western Washington. Deaths in both eastern and western Washington appeared to plateau at high levels through early January. The seven-day rolling average case count in eastern Washington increased from 168 cases per day on September 13 to 1036 on December 4, decreased to 643 as of December 27, rebounded to 980 on January 8, and then decreased to 700 on January 14. Similarly, daily hospital admissions in eastern Washington showed a three-fold increase from early September through early December, with the seven-day rolling average of hospital admissions flattening at around 36, then declining slightly to 28 admissions per day as of Dec. 30, rebounding to 40 as of Jan 8, and then dropping to 31 as of January 14. Case counts in western Washington rose steadily after September 12, increasing from a seven-day rolling average of 208 cases per day on September 12, to 1925 on December 4, followed by a decline to 1089 around December 25, rebound to 1884 as of January 8, and a recent decline to 1329 as of January 14. Daily hospital admissions in western Washington increased after the beginning of October, from a seven-day rolling average of 16 admissions per day on October 3 to 81 on December 4, a decline to 67 as of December 30, rebounding to 85 on January 6 and then declining again to 69 as of January 14.
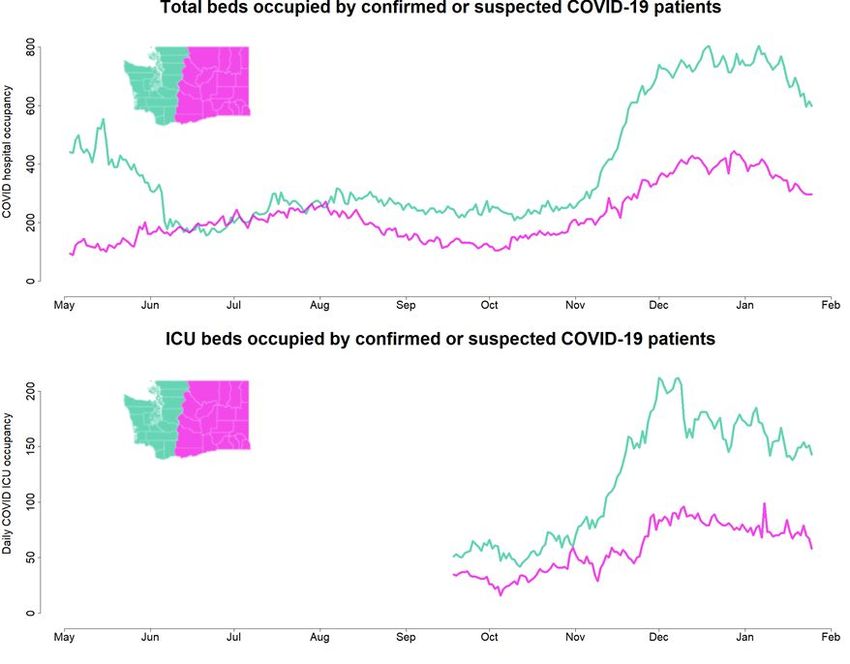
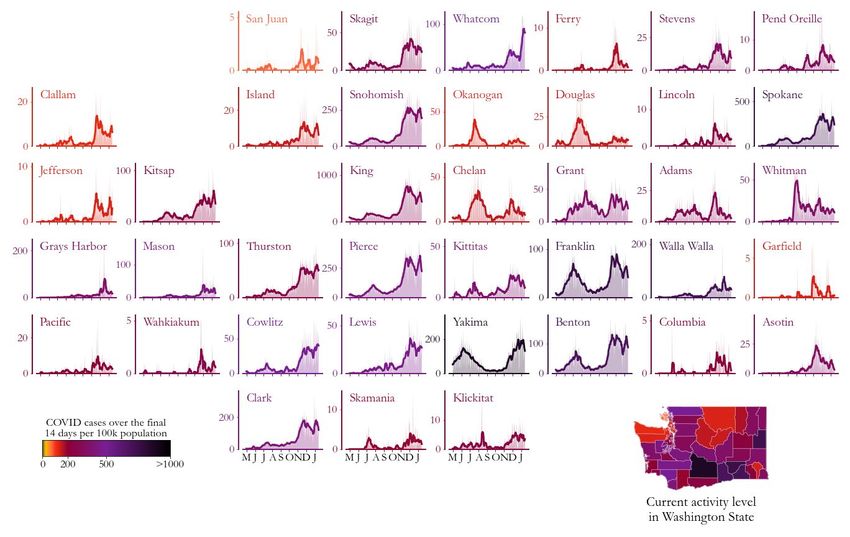
Figure 3: Daily COVID-19 positives (shaded areas) and 7-day moving averages (curves) arranged geographically and colored by COVID-19 activity level (total cases from January 1 to January 14 per 100,000 people). Case trends across counties highlight geographic correlations and help us better understand region-level estimates of the transmission rate (see Figure 1). A temporary reduction in case counts, with subsequent rebounds, was evident in most counties in late December due to the Christmas and New Year’s holidays. Reductions in case counts thereafter are evident in many counties after the first week of January; however, cases per 100,000 people remain high in most counties as of January 14.
Absolute case rates remain high across Washington state, but are moving in the right direction, with 29
of 39 counties showing 14-day average rates of new cases above 200 per 100,000 population, and 5 of
39 counties above 500 per 100,000 population (Figure 3).

    ●   All of the five largest counties (Clark, King, Pierce, Snohomish, and Spokane) show sharp
        declines in case counts after the first week of January, returning to levels similar to those
        observed in early/mid November.

    ●   Most medium-sized counties (Benton, Franklin, Grant, Kitsap, Skagit, Thurston) also show
        declines in case counts to early- or mid-November levels starting after the first week of January.
        Case counts in Yakima declined to mid-December levels, and Whatcom county also shows slight
        declines from its highest-ever peak levels in January. Counts in Cowlitz county are plateauing
        after increases through the first week of January.

    ●   Several small counties (Chelan, Douglas, Kittitas, Mason, Stevens) also show similar declining
        trends after the first week of January. Grays Harbor shows slight declines to late November
        levels, Whitman shows slight recent declines, and Walla Walla shows plateaus in case counts
        since after the first week of January.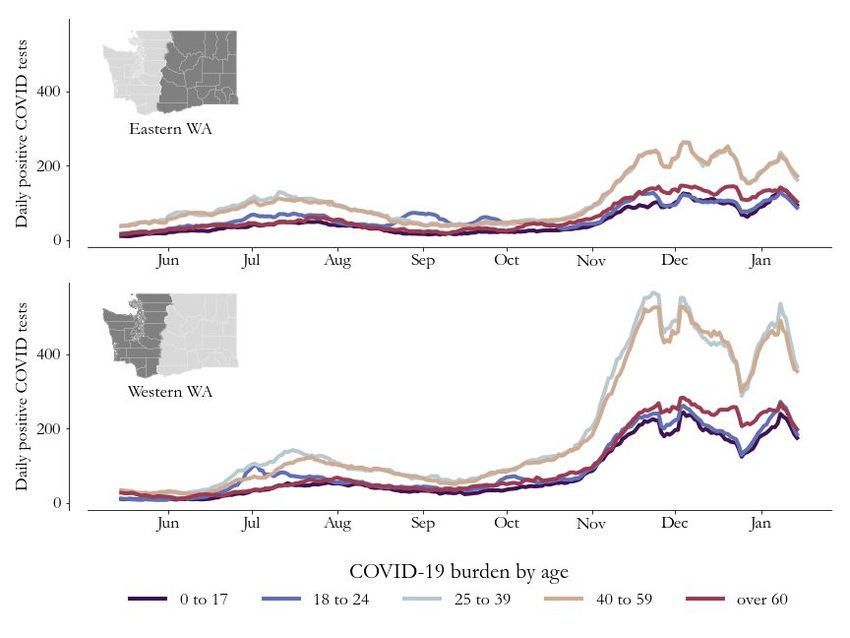
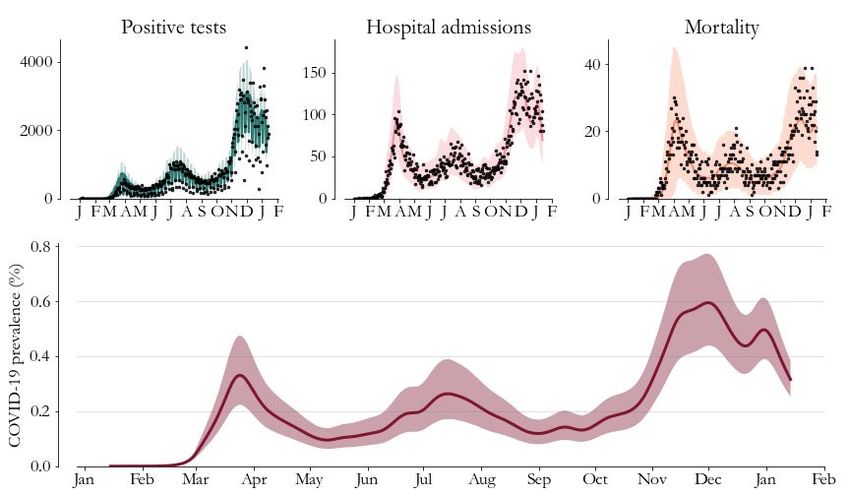
Figure 4: Model-based prevalence estimates (bottom, 95% CI shaded) and model fit to cases (top left), hospitalizations (top middle) and deaths (top right) for Washington state. Prevalence is the percentage of Washington state residents with active COVID-19 infection. On January 8, overall prevalence (the percentage of Washington state residents with active COVID-19 infection) in Washington state was likely between 0.25% and 0.38%, with a best estimate of 0.32% (Figure 4). Though a declining trend in prevalence is apparent in early January, this estimate remains close to the peak prevalence estimate in late March, and hospital admissions in early January still exceed late March levels. After sharp increases in October and early November, prevalence estimates flattened in mid-November, and declined through December. However, the drop in prevalence in late December could be related to reductions in healthcare-seeking behavior prior to the holidays, and the subsequent rebound could be related both to delayed healthcare-seeking after the December holidays and to temporary increases in transmission due to holiday gatherings. Hospitalizations and deaths occur some time after initial illness onset, and the most recent hospital admission rates generally reflect exposures that occured at least 4 or 5 days prior to illness
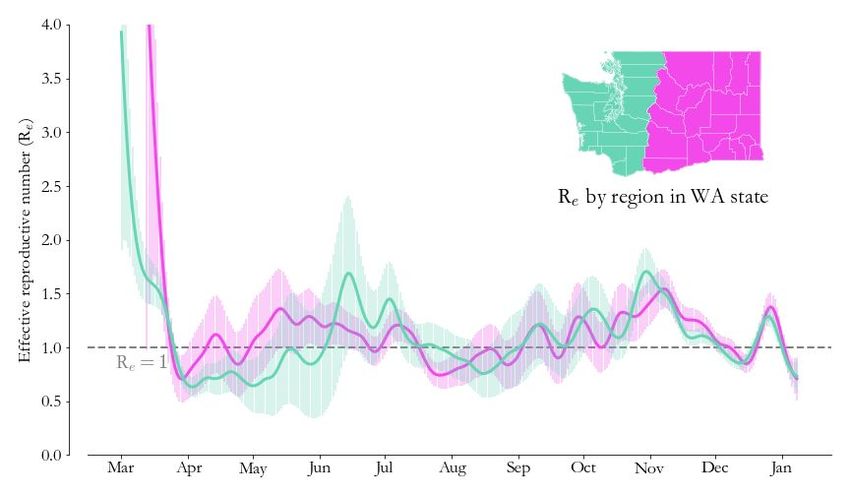
Figure 5. Seven-day rolling average case counts by age group for eastern Washington (top) and western Washington (bottom) showing rebounds in cases after the December holidays, followed by a recent decline in case counts. In both eastern and western Washington, case counts rebounded after the Christmas holidays in all age groups, followed by declines in early January. The rebounds in case counts in late December were shallower among those aged 60 and over in comparison to other age groups, similar to what was seen over the Thanksgiving holiday. This suggests that in this age-group, where vulnerability to severe disease is highest overall, holiday-related changes in health-seeking behaviour are smaller, and the trend may better reflect underlying transmission.
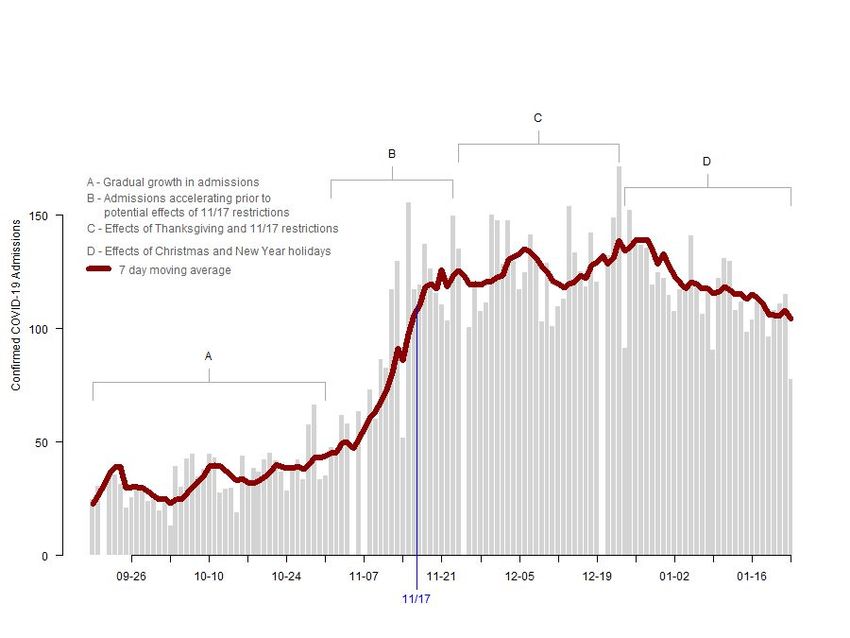
Figure 6. H ospital admissions for patients with confirmed COVID-19 infections reported by hospitals
through the WA Health system from October 19 to January 23. Through the WA Health system, hospitals
report the daily numbers of admissions for confirmed COVID-19 the previous day, as well as the number
of staffed acute-care ICU beds currently occupied by confirmed and suspected COVID-19 patients. The
blue line indicates the renewed restrictions that went into effect on November 17. As part of data quality
assurance, only dates on which over 75% of hospitals reported data to the WA Health system are
included in this graph.
Figure 6 highlights recent trends in hospital admissions in Washington state using aggregate daily
hospital admissions data reported through the WA Health system. These data provide a more timely
assessment of hospital admissions than the hospitalization data used to estimate Re and
prevalence.
However, the WA Health data do not distinguish between patients with confirmed COVID-19 who
require hospitalization because of COVID-19 symptoms and patients admitted for other reasons who
test positive for COVID-19. Additionally, the WA Health data assess total hospital admissions, including
readmissions, while the WDRS hospital admission data only include first admissions, which better
reflects disease transmission dynamics in the population, but has a longer time to data completion. For
these reasons, we use the WDRS hospital admission data as the basis for our model-based estimation of
Re and prevalence. We use the WA Health admission data as a check against major changes in admission
trends that have not yet been observed in the WDRS hospital admission data.
Four distinct time periods are apparent in these data: (A) a gradual increase in hospital admissions
through October 31, (B) a period of accelerating admissions through November 23, (C) a time period
that includes the combined effects of Thanksgiving and reductions in transmission (Re ) that started in
mid-November, and (D) the time period including the combined effects of the Christmas and New Year’s
holidays. Though some fluctuations are evident, total hospital admissions have flattened at a relativelyhigh level since late November at over 100 admissions per day, with indications of a slight decline by mid-January. The trends apparent in the WA Health data differ from those in the WDRS hospital admissions data primarily because WA Health data include readmissions which, by definition, lag the first admission by varying time spans. Therefore, the spike and subsequent decline evident in first admissions in late December/early January in WDRS hospital admissions (Figure 2) are not apparent in the WA Health data as that trend is “filled in” by readmissions. Figure 7. Hospital beds occupied by confirmed or suspected COVID-19 patients (top, western Washington hospitals indicated by the green line, eastern Washington hospitals indicated by the pink line) and ICU beds occupied by COVID-19 patients (bottom) reported through the WA Health system. Data collection for ICU beds occupied by COVID-19 patients started September 17. Hospital occupancy data has minimal reporting lag, and is shown here using data up to January 23. Both confirmed and suspected cases are included, rather than just confirmed cases, since this best reflects total resources being used. Note that bed occupancy will continue to increase for a period of time even after admissions level off since patients being treated for COVID-19 generally stay in the hospital for several days. In western Washington the rapid increase in the number of occupied hospital beds that started in early November slowed substantially in early December and remained fairly flat until mid-January, with slight declines thereafter (Figure 7). The slower increase that occurred in eastern Washington remained unabated until mid-December and then remained flat until mid-January, with slight declines subsequently. ICU beds occupied by confirmed or suspected COVID-19 patients flattened in western
Washington at the start of December, followed by a drop in mid-December and a plateau, with some variability, through January. In eastern Washington the number of ICU beds occupied has remained fairly flat since early December. Implications for public health practice Recent declines in transmission are apparent across Washington state, suggesting that the recent rebound in cases after the December holidays may have been more due to transient factors, such as delayed healthcare-seeking behavior and holiday-related gatherings, rather than due to sustained increases in transmission at the population level. While the observed recent declines in transmission and prevalence are promising, case and hospital admission rates remain high. Continued public health and policy efforts are necessary to sustain these declines, particularly in light of recent challenges posed by new strains of SARS-CoV-2, the virus that causes COVID-19, in increased circulation worldwide. Figure 8. Contextualizing the discovery of B.1.1.7 in Western WA (green) with data from other settings. In the UK, Portugal, and Ireland, substantial rises in cases per capita (purples, dark to light) were seen after the first B.1.1.7 strain was discovered in the population. While burden continues to rise in Portugal, mitigation efforts (grey circles) in the U.K. and Ireland, such as stay-at-home orders, have successfully reversed trends despite the new variant’s increased transmissibility. Two cases of the new B.1.1.7 strain of SARS-CoV2 have been identified in Snohomish County and one case in Pierce County. Current evidence indicates that the B.1.1.7 strain is substantially more infectious than prior strains, with estimates of a 1.5 - 1.7 fold increase in transmissibility compared to other strains. Currently there is mounting evidence that approved vaccines will remain highly effective against the B.1.1.7 variant. If this strain were to become prevalent in Washington State, with a 1.5 fold increase in transmissibility over current strains, prevention of exponential growth in hospitalizations and cases would become significantly more challenging. Portugal, the United Kingdom and Ireland (Figure 8) have all experienced a resurgence in COVID activity related to the B.1.1.7 variant, with peak per capita case rates between 2 to 17 times the rate when the variant was first sequenced in each location. In each of these locations peak per capita case rates did not occur until some time after the B.1.1.7 variant was observed; around 3.5 weeks in Ireland and 16 weeks in the United Kingdom. Portugal is still peaking after 10 weeks. With Re currently below one in Washington State, we have a window of opportunity to reduce case and hospitalization rates as much as possible before the B.1.1.7 strain becomes predominant. A longer window means more people can get vaccinated, which will ultimately reduce the
overall burden of additional cases that the new strain will bring. Continued firm adherence to masking
and social distancing remains critical. Protection of high-risk populations through the Washington state
COVID-19 vaccination distribution program is also essential to shield these populations from likely
increases in circulation of the B.1.1.7 strain within Washington state. Further efforts to protect essential
workers including food service workers, factory and warehouse employees, and agricultural workers are
also critical to keep levels of transmission as low as possible. In combination, these efforts both protect
the public now, and also reduce the possible emergence of other SARS-CoV-2 variants of concern.
The recent decline in COVID-19 prevalence since the first week of January is a positive potential sign of
reductions in population-level transmission. However, daily case rates remain high, at over 2,000 new
cases per day, daily hospital admissions remain at peak levels, and although both total hospital bed and
ICU occupancy have stabilized, they remain much higher than in the fall. Moreover, current prevalence
levels are similar to those observed during the peak of the last wave of infection in late March.
Therefore, sustained effort at the population and individual level to adhere to public health guidelines
remains essential to further reducing transmission, particularly in light of detection of the B.1.1.7 strain
within Washington state.
Key inputs, assumptions, and limitations of the IDM modeling approach
We use a COVID-specific transmission model fit to testing and mortality data to estimate the effective
reproductive number over time. The key modeling assumption is that individuals can be grouped into
one of four disease states: susceptible, exposed (latent) but non-infectious, infectious, and recovered.
● For an in-depth description of our approach to estimating Re and its assumptions and
limitations, see the most recent technical report on the modeling methods. The estimates this
week and going forward use the updated method in that report, which results in some
statistically-insignificant retrospective changes to Re relative to our previous report.
● In this situation report, we use data provided by Washington State Department of Health
through the Washington Disease Reporting System (WDRS). We use the WDRS test,
hospitalization, and death data compiled on January 24, and to hedge against delays in
reporting, we analyze data as recent as January 14 across the state. This relatively conservative
hedge against lags is in response to reports of increasing test delays.
● Estimates of Re describe average transmission rates across large regions, and our current work
does not separate case clusters associated with known super-spreading events from diffuse
community transmission.
● Results in this report come from data on testing, confirmed COVID-19 cases, and deaths (see
previous WA State report for more details). Also as described previously, estimates of Re are
based on an adjusted epi curve that accounts for changing test availability, test-positivity rates,
and weekend effects, but all biases may not be accounted for.
● This report describes patterns of COVID transmission across Washington state, but it does not
examine factors that may cause differences to occur. The relationships between specific causal
factors and policies are topics of ongoing research and are not addressed herein.
● To contextualize the increased transmission associated with the B.1.1.7 variant, we use data
compiled by the Center for Systems Science and Engineering (CSSE) at Johns Hopkins University.
Data was accessed on January 26 2021, and we used data up to January 20 to hedge against
reporting delays.
Collaboration notes
The Institute for Disease Modeling (IDM), Microsoft AI For Health, the University of Washington, and the
Fred Hutchinson Cancer Research Center are working with WA DoH to provide support for regionalmodeling of case, testing, and mortality data across Washington State to infer effective reproduction numbers, prevalence, and incidence from data in the Washington Disease Reporting System. Modeling and analysis for the report are led by WA DoH and are based on models developed by IDM and advanced by Microsoft to better represent the state. The WA DoH wishes to thank IDM for their support in model development and implementation for this report, in particular, Niket Thakkar of IDM developed and shared software and programming scripts and provided technical and scientific advice to the WA DoH. This collaboration has evolved alongside the science, data systems, and analysis behind the models, and it reflects the ongoing commitment of all parties involved to improve our understanding of COVID-19 transmission and to support WA DoH in its public health mission. This collaboration and its outputs will continue to evolve as scientific frontiers and policy needs change over time. These reports were previously published on the IDM InfoHub. Going forward, as of December, 9, 2020, new reports will be published on the DOH website. IDM will continue to provide technical assistance for the reports, as part of this collaboration.
You can also read


