COVID-19 transmission across Washington State
←
→
Page content transcription
If your browser does not render page correctly, please read the page content below
COVID-19 transmission across
                  Washington State

           Washington State Department of Health
                                 February 24, 2021

To request this document in another format, call 1-800-525-0127. Deaf or hard of hearing
customers, please call 711 (Washington Relay) or email civil.rights@doh.wa.gov.

Publication Number 820-114

For inquiries about this report from media, contact the Public Information Desk:
doh-pio@doh. wa.gov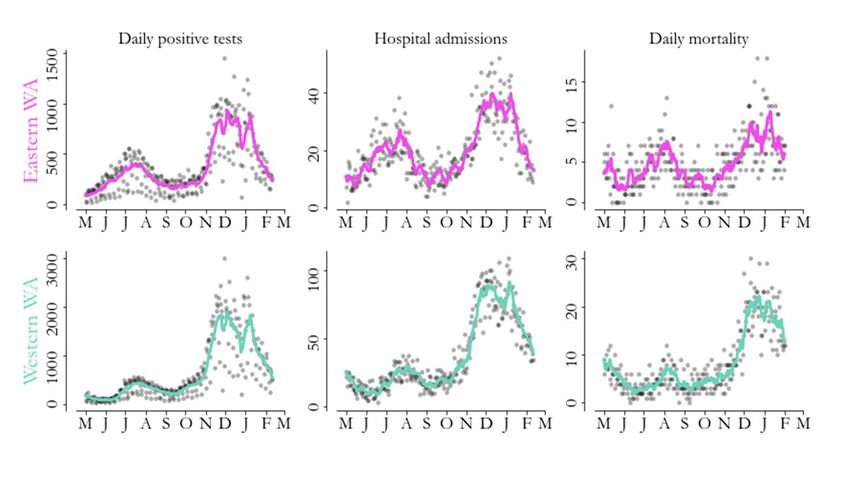
SitRep 27: COVID-19 transmission across Washington State
Gitanjali Singh1, Ian Painter1, Juan M. Lavista Ferres2, Ruth Etzioni3, Barbra A. Richardson3,4, Cathy Wasserman1
1
Washington State Department of Health; 2 Microsoft AI For Health; 3 Fred Hutch Cancer Center; 4 University of Washington
Results as of February 23, 2021.
We are publishing situation reports on a biweekly schedule on Wednesdays to better accommodate
news cycles. If, on an off week, we identify a time-sensitive feature in the data, we will produce an
updated report that week to ensure that changes in the situation are reported quickly.
For a comprehensive and up-to-date picture of what’s happening around the state, see the WA State
COVID-19 Risk Assessment and WADoH COVID-19 data dashboards.
Summary of current situation
Using data from the Washington Disease Reporting System (WDRS) through February 11, we estimate
the reproductive number ( Re ) in western Washington on February 5 was likely between 0.45 and 0.96,
with a best estimate of 0.71. Meanwhile, we estimate that in eastern Washington, Re was likely
between 0.35 and 1.42, with a best estimate of 0.88 (Figure 1).
Figure 1: Re estimates for eastern (pink) and western (green) WA, with 2 standard deviation error bars.
Our most recent estimates show Re has decreased in both eastern and western Washington since peaks
in late December, but remain close to 1. To reduce levels of cases and hospitalizations, Re needs to
maintain a value substantially below 1 for a sustained period of time. The large uncertainty in the
estimate for eastern Washington is driven by the increasingly small number of hospitalizations and
fluctuations in the rate of decline of hospital admissions in that region.
1
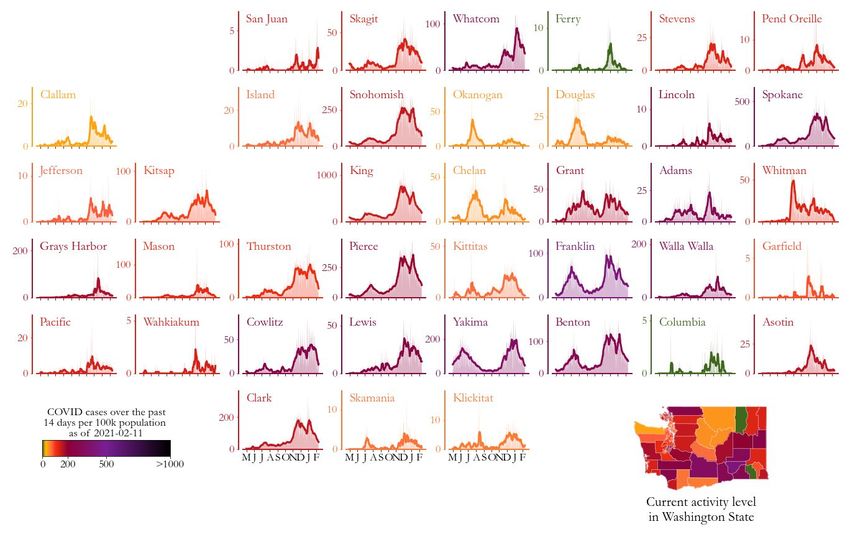
Figure 2: Seven-day rolling case counts (left panels), hospital admissions (middle panels) and deaths
(right panels) for eastern Washington (top) and western Washington (bottom) through February 11
(cases and hospitalizations) and February 1 (deaths). Because of a change in how confirmed deaths are
being reported, we are using an earlier cutoff for the mortality panel. Data are shown from May 2020
through February 11, 2021.
Trends by region
In both eastern and western Washington, the declines in case counts and hospital admissions that
started after the first week of January have continued, with slight decreases in the rate of decline of case
counts (Figure 2). Deaths in both eastern and western Washington have declined since early January.
The seven-day rolling average case count in eastern Washington increased from 169 cases per day on
September 13 to 1047 on December 4, decreased to 667 as of December 27, rebounded to 994 on
January 8, and then decreased to 292 on February 11. Similarly, daily hospital admissions in eastern
Washington showed a three-fold increase from early September through early December, with the
seven-day rolling average of hospital admissions flattening at around 35, then declining slightly to 32
admissions per day as of Dec. 30, rebounding to 43 as of Jan 8, and then dropping to 13 as of February
11.
Case counts in western Washington rose steadily after September 12, increasing from a seven-day
rolling average of 209 cases per day on September 12, to 1929 on December 4, followed by a decline to
1103 on December 25, rebound to 1896 as of January 8, and a recent decline to 606 as of February 11.
Daily hospital admissions in western Washington increased after the beginning of October, from a
seven-day rolling average of 16 admissions per day on October 3 to 80 on December 4, a decline to 65 as
of December 30, rebounding to 85 on January 6 and then declining again to 39 as of February 11.
2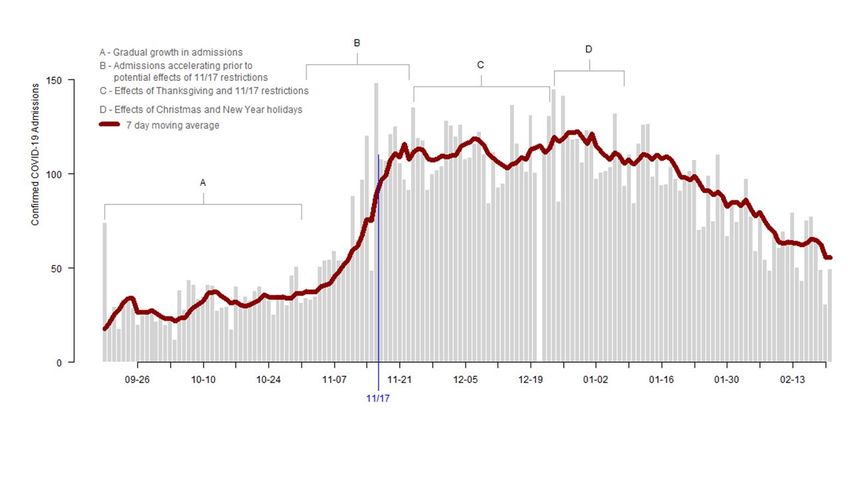
Figure 3: Daily COVID-19 positives (shaded areas) and 7-day moving averages (curves) arranged geographically and colored by COVID-19 activity
level (total cases from January 29 to February 11 per 100,000 people). Case trends across counties highlight geographic correlations and help us
better understand region-level estimates of the transmission rate (see Figure 1). Reductions in case counts are evident in many counties after the
first week of January, though some flattening in these declines is apparent.
3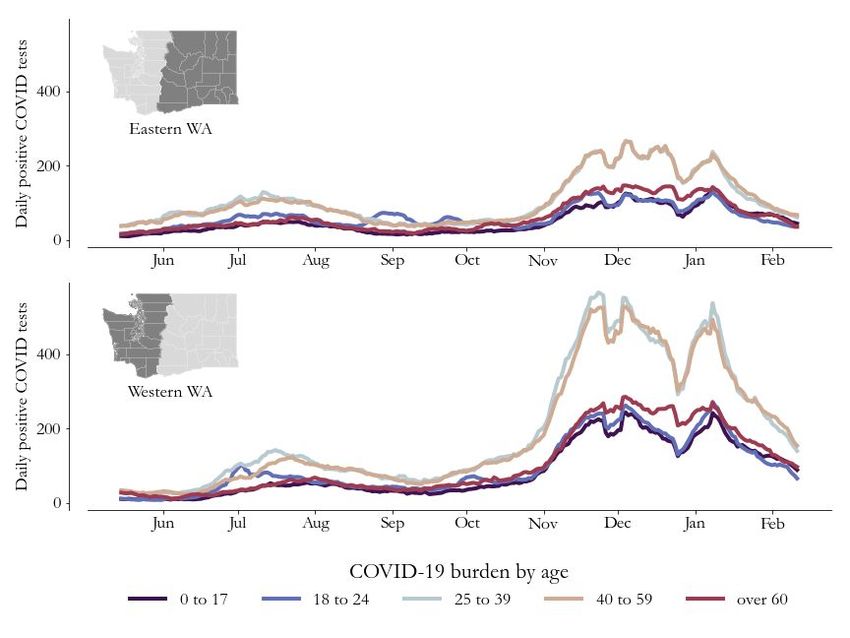
County-level trends
Absolute case rates remain high across Washington state, but continue moving in the right direction,
with 2 of 39 counties (Columbia and Ferry) showing an average rate of no new cases per 100,000
population over the two weeks prior to February 11, 9 of 39 counties showing 14-day average rates of
new cases above 200 per 100,000 population, and no counties above 500 per 100,000 population
(Figure 3).

   ●   All of the five largest counties (Clark, King, Pierce, Snohomish, and Spokane) continue to see
       declines in case counts after the first week of January and are now approaching levels similar to
       those observed in late October or early November. However, since mid-January, the rate of
       decline has slowed.

   ●   In most medium-sized counties (Benton, Grant, Kitsap, Skagit, Thurston), the declines since the
       first week of January have continued, though the rate of decline appears to be slower than in
       January. Case counts in Yakima have declined to mid-November levels, after some flattening
       earlier in February. Franklin County has seen recent flattening in the declines in case counts
       observed through late January. Cases in Cowlitz have declined sharply after plateauing at peak
       levels through late January. In Whatcom County, case counts have continued to decline from
       highest-ever peak levels in early January, despite temporary flattening in the decline in early
       February.

   ●   Among small counties, Lewis County shows continued steady declines in case counts, while in
       Chelan case counts are flattening after steady declines to late October levels. Walla Walla has
       seen flattening in counts since late January. All other small counties currently have fewer than
       10 cases per day.

                                                                                                          4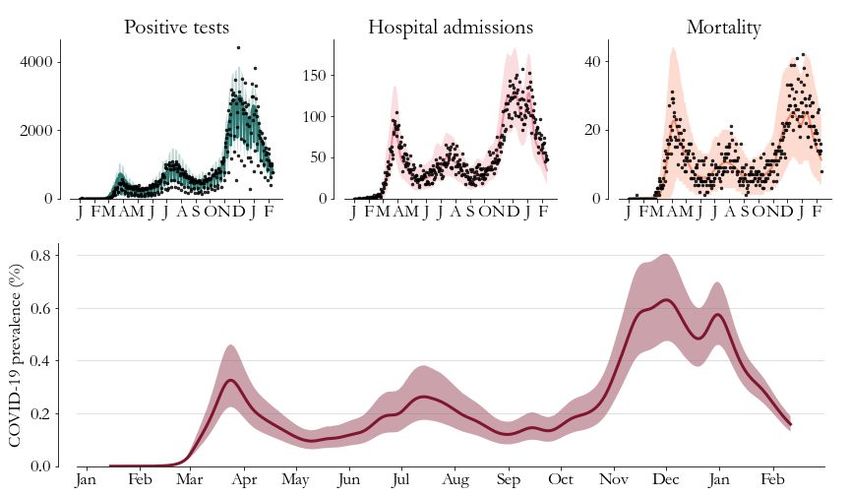
Figure 4. Seven-day rolling average case counts by age group for eastern Washington (top) and western
Washington (bottom) showing declines in case counts since early January with variations in the rate of
these declines evident across age groups and regions.
Trends in cases by age group
In both eastern and western Washington, case counts rebounded after the December holidays in all age
groups, followed by declines in early January (Figure 4). These declines have continued through early
February, though the rate of decline has slowed since mid-January. In eastern Washington, the declines
have largely flattened among ages 0-24 and 60 and over, and the rate of decline has slowed greatly
among those aged 25-59. In western Washington, the rate of decline among those aged 18-24 and
25-59 appears to have increased slightly in early February.
As the proportion of vaccinated individuals increases among the 65 and over population across
Washington state, it is expected that a more rapid decline in cases in this population will occur in
comparison to age groups in which a smaller proportion have been vaccinated; however, this change has
yet to manifest.
5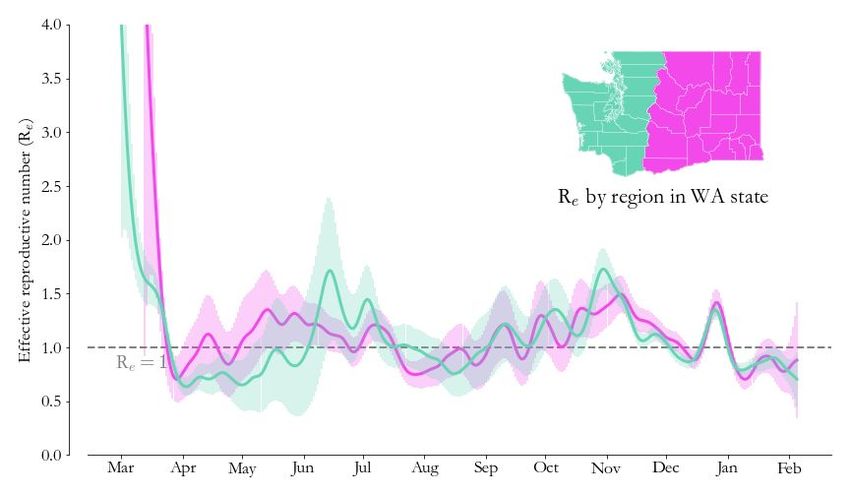
Figure 5: Model-based prevalence estimates (bottom, 95% CI shaded) and model fit to cases (top left),
hospitalizations (top middle) and deaths (top right) for Washington state. Prevalence is the percentage
of Washington state residents with active COVID-19 infection.
Model-based statewide prevalence
On February 5, overall prevalence (the percentage of Washington state residents with active COVID-19
infection) in Washington state was likely between 0.13% and 0.19%, with a best estimate of 0.16%
(Figure 5). The current prevalence estimate remains only slightly below the peak prevalence estimates in
earlier waves of disease in late March and mid-July. Similarly, hospital admissions in early February are
only slightly below levels observed at the peaks of the two earlier waves.
6Figure 6. H
ospital admissions for patients with confirmed COVID-19 infections reported by hospitals
through the WA Health system from October 19 to February 21. Through the WA Health system,
hospitals report the daily numbers of admissions for confirmed COVID-19 the previous day, as well as the
number of staffed acute-care ICU beds currently occupied by confirmed and suspected COVID-19
patients. The blue line indicates the renewed restrictions that went into effect on November 17. As part
of data quality assurance, only dates on which over 75% of hospitals reported data to the WA Health
system are included in this graph.
Hospital admissions
Figure 6 highlights recent trends in hospital admissions in Washington state using aggregate daily
hospital admissions data reported through the WA Health system. These data provide a more timely
assessment of hospital admissions than the hospitalization data used to estimate Re and
prevalence.
However, the WA Health data do not distinguish between patients with confirmed COVID-19 who
require hospitalization because of COVID-19 symptoms and patients admitted for other reasons who
test positive for COVID-19. Additionally, the WA Health data assess total hospital admissions, including
readmissions, while the WDRS hospital admission data only include first admissions, which better
reflects disease transmission dynamics in the population, but have a longer time to data completion. For
these reasons, we use the WDRS hospital admission data as the basis for our model-based estimation of
Re and prevalence. We use the WA Health admission data as a check against major changes in admission
trends that have not yet been observed in the WDRS hospital admission data.
Four distinct time periods are apparent in these data: (A) a gradual increase in hospital admissions
through October 31, (B) a period of accelerating admissions through November 23, (C) a time period
that includes the combined effects of Thanksgiving and reductions in transmission (Re ) that started in
mid-November, and (D) the time period including the combined effects of the Christmas and New Year’s
holidays. Total hospital admissions have steadily declined since early January, with slight flattening in
the decline evident in early February. The trends apparent in the WA Health data differ from those in
the WDRS hospital admissions data primarily because WA Health data include readmissions which, by
definition, lag the first admission by varying time spans. For example, the spike and subsequent decline
7evident in first admissions in late December/early January in WDRS hospital admissions (Figure 2) are
not apparent in the WA Health data as that trend is “filled in” by readmissions.
Figure 7. Hospital beds occupied by confirmed or suspected COVID-19 patients (top, western
Washington hospitals indicated by the green line, eastern Washington hospitals indicated by the pink
line) and ICU beds occupied by COVID-19 patients (bottom) reported through the WA Health system.
Data collection for ICU beds occupied by COVID-19 patients started September 17. Hospital occupancy
data has minimal reporting lag, and is shown here using data up to February 22. Both confirmed and
suspected cases are included, rather than just confirmed cases, since this best reflects total resources
being used. Note that bed occupancy would continue to increase for a period of time even if admissions
plateau since patients being treated for COVID-19 generally stay in the hospital for several days.
Hospital occupancy
In western Washington the rapid increase in the number of occupied hospital beds that started in early
November slowed substantially in early December and remained fairly flat until mid-January, with
steady declines thereafter (Figure 7). The slower increase that occurred in eastern Washington
continued until mid-December, flattened through early January, and has also steadily declined
subsequently.
8ICU beds occupied by confirmed or suspected COVID-19 patients flattened in western Washington at the
start of December, followed by a drop in mid-December and a plateau, with some variability, through
January, after which a generally declining trend is evident. In eastern Washington the number of
occupied ICU beds remained fairly flat through December and has declined steadily through February.
Implications for public health practice
Consistent declines in prevalence across Washington state have occured since early January, and case
counts, hospitalizations, and deaths continue to fall. This declining trend has been observed across the
United States, as well as globally. The reason for these widespread declines are not well understood,
but have been suggested to include more optimal behaviors at the individual level such as reduced
indoor gathering and improvements in masking ;coronavirus seasonality (which may not be the case as
these trends are also observed in the Southern Hemisphere); weather-related reductions in testing
(which haven't been observed in WA state); partial immunity in specific locations, particularly
high-density populations that were hit hard earlier and were more likely to be exposed to the virus
(frontline/essential workers and multigenerational families in dense living conditions), and impact of
vaccination (too early to see effects in WA, but evidence from other countries supports this). However
these suggested explanations are currently not empirically verifiable due to geographic, climactic, and
behavioral differences across regions, and may have partial or limited relevance to Washington state.
However, it is critical that these observed declines should not induce complacency or reduce vigilance in
use of non-pharmaceutical interventions (NPIs) such as effective masking, social distancing, and hand
hygiene because significant cause for concern continues due to the emergence and spread of
SARS-CoV-2 variants of concern, including the B.1.1.7 variant. This variant is substantially more
infectious than prior strains, with estimates of a 1.5 - 1.7 fold increase in transmissibility over
pre-existing strains in England, and 1.35 to 1.5 fold increase over pre-existing strains in the United
States, and has a doubling time of 10 days according to recent estimates. Evidence from countries such
as Denmark, where sequencing levels are high, suggest that declines in overall case counts in January
occurred at the same time as exponential growth in B.1.1.7, leading to predominance of B.1.1.7 by late
February. The B.1.1.7 variant was first detected in Denmark in December, and by mid-February 47.5%
of cases were attributable to the variant strain.
Additional variants, including B.1.351 and P.1 are also increasing in circulation in the United States,
although still at a low level. Approved vaccines remain highly effective against the B.1.1.7 strain, but
are less effective against the B.1.351 strain, which was detected in Washington state on February 22,
2021. Furthermore, the P.1 strain may also show some reduced response to antibodies generated
through vaccination or prior infection.
In combination, these data emphasize the critical importance of avoiding pandemic
fatigue/complacency now that absolute case counts and hospital admissions are declining, but B.1.1.7 is
spreading. Current prevalence estimates and hospital admissions remain only slightly below peak
estimates in earlier waves of disease in late March and mid-July, highlighting the precarious nature of
the current situation. Rapidly ramping up vaccine distribution is essential to curbing the spread of
B.1.1.7 and mitigating its impacts on COVID-19 mortality. As of February 20, 1,379,318 doses of
vaccine have been administered in Washington state at a current 7-day average of 26,380 doses per day;
912.73% of the state population have received a first dose, and 5.46% have been fully vaccinated. Data
from global examples have shown population-level impacts of vaccination on transmission. In Israel,
where 33% of the population has been fully vaccinated, severe illness decreased by 99.2% and
hospitalization decreased by 98.9% among the vaccinated two weeks after receiving both doses. In
Scotland, COVID-related hospital admissions declined by 84% (Pfizer vaccine) and 95% (Oxford-Astra
Zeneca vaccine) among vaccinated individuals by four weeks after receiving only the first dose of
vaccine.
The longer term outlook is highly uncertain and dependent on multiple variables, including the extent
to which the population can maintain firm adherence to NPIs, the rate at which vaccination occurs, the
spread of B.1.1.7 across Washington state, the spread or emergence of additional variants, and the
arrival of warmer weather. In the worst case scenario in which widespread vaccination does not occur
quickly enough, B.1.1.7 will predominate by early April, resulting in greater transmission, and increases
in cases, hospitalizations, and deaths. In the best case scenario a sufficient proportion of the population,
particularly those over age 65, will be vaccinated such that severe cases and deaths will be averted. This
uncertainty underscores the importance of continued use of NPIs to maintain a window of low
transmission while vaccine rollout is ramped up across the state. It also underscores the importance of
vaccination and NPIs to reduce overall transmission and curtail emergence of additional variants. Finally,
the public and policy makers should remain open to potential use of additional levers such as targeted
shutdowns if B.1.1.7 spread is not contained through other means, in order to mitigate severe disease
and mortality at the population level.
Key inputs, assumptions, and limitations of the IDM modeling approach
We use a COVID-specific transmission model fit to testing and mortality data to estimate the effective
reproductive number over time. The key modeling assumption is that individuals can be grouped into
one of four disease states: susceptible, exposed (latent) but non-infectious, infectious, and recovered.
● For an in-depth description of our approach to estimating Re and its assumptions and
limitations, see the most recent technical report on the modeling methods. The estimates this
week and going forward use the updated method in that report, which results in some
statistically-insignificant retrospective changes to Re relative to our previous report.
● In this situation report, we use data provided by Washington State Department of Health
through the Washington Disease Reporting System (WDRS). We use the WDRS test,
hospitalization, and death data compiled on February 23, and to hedge against delays in
reporting, we analyze data as recent as February 11 across the state. This relatively
conservative hedge against lags is in response to reports of increasing test delays.
● Estimates of Re describe average transmission rates across large regions, and our current work
does not separate case clusters associated with known super-spreading events from diffuse
community transmission.
● Results in this report come from data on testing, confirmed COVID-19 cases, and deaths (see
previous WA State report for more details). Also as described previously, estimates of Re are
based on an adjusted epi curve that accounts for changing test availability, test-positivity rates,
and weekend effects, but all biases may not be accounted for.
● This report describes patterns of COVID transmission across Washington state, but it does not
examine factors that may cause differences to occur. The relationships between specific causal
factors and policies are topics of ongoing research and are not addressed herein.
10Collaboration notes
The Institute for Disease Modeling (IDM), Microsoft AI For Health, the University of Washington, and the
Fred Hutchinson Cancer Research Center are working with WA DoH to provide support for regional
modeling of case, testing, and mortality data across Washington State to infer effective reproduction
numbers, prevalence, and incidence from data in the Washington Disease Reporting System. Modeling
and analysis for the report are led by WA DoH and are based on models developed by IDM and
advanced by Microsoft to better represent the state. The WA DoH wishes to thank IDM for their support
in model development and implementation for this report, in particular, Dr. Niket Thakkar, PhD, of IDM,
who developed and shared software and programming scripts and provided technical and scientific
advice to the WA DoH. This collaboration has evolved alongside the science, data systems, and analysis
behind the models, and it reflects the ongoing commitment of all parties involved to improve our
understanding of COVID-19 transmission and to support WA DoH in its public health mission. This
collaboration and its outputs will continue to evolve as scientific frontiers and policy needs change over
time.
These reports were previously published on the IDM InfoHub. Going forward, as of December, 9, 2020,
new reports will be published on the DOH website. IDM will continue to provide technical assistance for
the reports, as part of this collaboration.
11You can also read