Impact of ENSO on variability of global CO 2 concentration retrievals from GOSAT and AIRS - IOPscience
←
→
Page content transcription
If your browser does not render page correctly, please read the page content below

IOP Conference Series: Earth and Environmental Science

PAPER • OPEN ACCESS

Impact of ENSO on variability of global CO2 concentration retrievals from
GOSAT and AIRS
To cite this article: N Ying and Q Ye 2019 IOP Conf. Ser.: Earth Environ. Sci. 237 022009

View the article online for updates and enhancements.

                               This content was downloaded from IP address 46.4.80.155 on 26/03/2021 at 13:47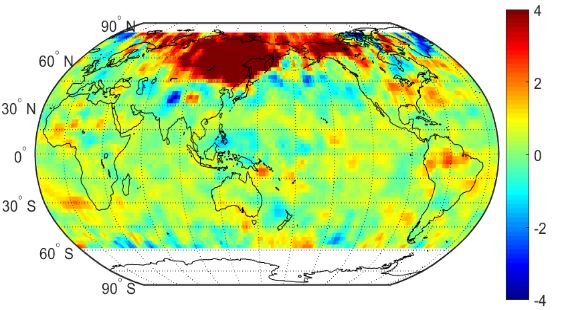
ICAESEE 2018                                                                                                   IOP Publishing
IOP Conf. Series: Earth and Environmental Science 237 (2019) 022009                        doi:10.1088/1755-1315/237/2/022009

Impact of ENSO on variability of global CO2 concentration
retrievals from GOSAT and AIRS

                     N YING 1, Q YE 1
                     1
                         Faculty of Geographical Science, Beijing Normal University, Beijing 100875, China
                     *
                         Corresponding author’s e-mail: yingna@mail.bnu.edu.cn

                     Abstract. The correlations between the growth rate of atmospheric CO2 concentrations and the
                     El Niño–Southern Oscillation (ENSO) events are well known. However, investigations of the
                     influence EN-SO events on global CO2 concentrations remain poorly constrained in space.
                     Here, we employ atmospheric CO2 concentrations retrieved from the Greenhouse Gases
                     Observing Satellite (GOSAT) and the Atmospheric Infrared Sounder (AIRS) to investigate the
                     impact of ENSO events on the spatial patterns during July 2009–April 2014. Empirical
                     orthogonal function decomposition was applied to the CO2 concentration series and it showed
                     that the spatial patterns of the GOSAT data compare well with those of the AIRS data. GOSAT
                     and AIRS CO2 concentrations exhibit a significant in-crease during warm ENSO episodes.
                     Furthermore, we directly observed significant variations be-tween the two datasets in the onset
                     and mature phases of ENSO. Specifically, during the onset phase, the GOSAT CO2
                     concentration decreases more remarkably over high latitudes compared with the AIRS data.
                     During the mature stage, the GOSAT CO2 concentration is reduced over the Atlantic and
                     Pacific oceans, whereas the AIRS CO2 concentration is reduced over North Asia and enhanced
                     over the Pacific Ocean. The differences between the GOSAT and AIRS data for the ENSO
                     decay phase are small. Using the high-resolution spatial and temporal observations available
                     from GOSAT and AIRS data, our study demonstrates that the impact of ENSO on CO2 spatial
                     patterns is significant and requires further investigation.

1. Introduction
Carbon dioxide (CO2) has been accumulating in the atmosphere since the pre-industrial period, mainly
due to the burning of fossil fuels and human activities, which has led to increasing surface
temperatures, rising sea levels and an increase in the occurrence of extreme weather conditions [1]. In
addition to the long-term increasing trend due to the burning of fossil fuels, the atmospheric CO2
concentration also exhibits a seasonal trend resulting from the seasonal growth and decay of land
plants [2]. Furthermore, the atmospheric CO2 concentration also shows variability on intraseasonal to
interannual timescales [3].
    The El Niño–Southern Oscillation (ENSO) is the strongest natural climate variability signal, which
is characterized by anomalous sea surface warming and cooling in the eastern and central Pacific [4].
ENSO events are well known to be associated with a variety of anomalous weather patterns around the
globe and leave an imprint on the global carbon cycle. It has been shown that the interannual
variability in atmospheric CO2 is mostly due to the effect of ENSO, based on singular spectrum
analysis of the Mauna Loa and South Pole data [5] and on principal component analysis (PCA) of the
rate of CO2 growth derived from 89 stations in the GLOBALVIEW–CO2 dataset [6]. High CO2 growth
rates correspond to El Niño climate conditions, and low growth rates to La Niña [7]. Moreover, Qian

              Content from this work may be used under the terms of the Creative Commons Attribution 3.0 licence. Any further distribution
              of this work must maintain attribution to the author(s) and the title of the work, journal citation and DOI.
Published under licence by IOP Publishing Ltd                          1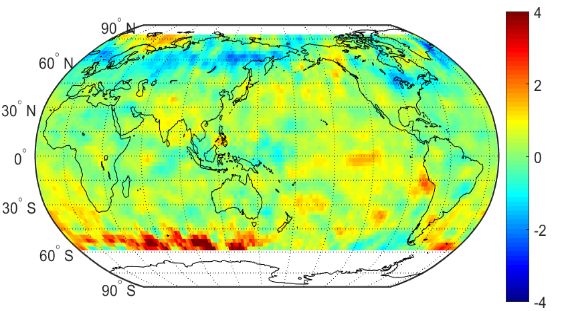
ICAESEE 2018                                                                                 IOP Publishing
IOP Conf. Series: Earth and Environmental Science 237 (2019) 022009      doi:10.1088/1755-1315/237/2/022009

et al. [8] revealed that the global atmospheric CO2 growth rate and the multivariate ENSO index (MEI)
exhibit a six-month lag.
    In recent years, CO2 concentration retrievals from different satellites have been used to determine
the global atmospheric CO2 spatial patterns, which can be used to track CO2 variability at different
locations. Using CO2 concentration retrievals from the Atmospheric Infrared Sounder (AIRS), it has
been found that ENSO influences the mid-tropospheric CO2 concentrations [9–11]. By analyzing CO2
data obtained from AIRS over seven years, Ruzmaikin et al. [12] found the first principal component
has a timescale typical for ENSO. In addition to AIRS measurements, Sun et al. [13] investigated the
spatial pattern of CO2 over South America based on GOSAT data. Chatterjee [14] showed the
gradients in the response of different tropical Pacific Ocean regions with OCO-2 data.
    These studies indicate that ENSO events can either directly affect the growth rate of atmospheric
CO2 or the spatial distribution of CO2 concentrations over regions. Although the ENSO cycle
originates in the equatorial Pacific, its impact is felt globally as a result of its regional teleconnections.
However, investigations of the relationship between ENSO events and global CO2 concentrations are
lacking. The CO2 concentration retrievals from AIRS and GOSAT provide an opportunity to examine
this relationship. In this study, we use AIRS and GOSAT data to analyze the CO2 spatial patterns and
the response of CO2 during different ENSO episodes across the globe. The spatial patterns for each
ENSO stage during warm and cold episodes are also analyzed.

2. DATA AND METHODS
The GOSAT satellite was launched on 23 January 2009 and was the first satellite dedicated to
monitoring atmospheric CO2 and methane (CH4) from space [15]. It is based on the thermal and near
infrared sensor for carbon observation Fourier transform spectrometer (TANSO-FTS). L3 data are
generated by interpolating and extrapolating the FTS L2 data and estimating the distribution of XCO2
for each month on a global scale. L3 global CO2 products are available from June 2009 to July 2015,
but are missing data for June 2014, December 2014, January 2015 and February 2015. After an
improvement of the retrieval algorithm from v01.xx to 02.xx, the accuracy and precision of GOSAT
SWIR XCO2 has been improved significantly. The bias and standard deviation of GOSAT v02.xx
XCO2 were estimated to be about –1.48 ppm and 2.09 ppm against the ground-based FTS XCO2 data
from the Total Carbon Column Observing Network (TCCON) sites [16].
    AIRS is the first in a new generation of high-spectral-resolution infrared sounder instruments
aboard the Aqua research mission. It is mounted on the sun-synchronous, near-polar orbiting satellite
and wavenumbers in the range 690–725 cm–1 are used for retrievals of the CO2 mixing ratio in the
mid-troposphere [17]. The spatial resolution of AIRS CO2 retrievals is 2.0° × 2.5° (latitude by
longitude) from 60°S to 90°N. AIRS mid-tropospheric CO2 has also been compared with CONTRAIL
aircraft CO2 and there is a bias of 0.1 ppm with a standard deviation of 1.8 ppm [18].
    Considering the continuity and comparability of AIRS and GOSAT data, we used CO2 monthly
mean data from July 2009 to April 2014. Regions around the South Pole (60°–90°S) are excluded,
which are either poorly covered by the retrievals or have large retrieval errors. The kriging
interpolation method was used to predict the missing values. Long-term in situ records of atmospheric
CO2 concentrations obtained from the Mauna Loa Observatory (MLO) from the National Oceanic and
Atmospheric Administration (NOAA) Earth System Research Laboratory (ESRL) are for comparison
with the AIRS and GOSAT data. ENSO episodes are selected based on the definition of Ocean Niño
Index (ONI) data.

3. RESULTS AND DISCUSSION

3.1Spatiotemporal characteristics of CO2
The interannual variation of the monthly mean CO2 concentration from July 2009 to April 2014 is
shown in Figure 1. The CO2 concentrations during the observation period show a clear increasing
trend as well as clear seasonal fluctuations, with peaks occurring in April and May, and lows occurring

                                                       2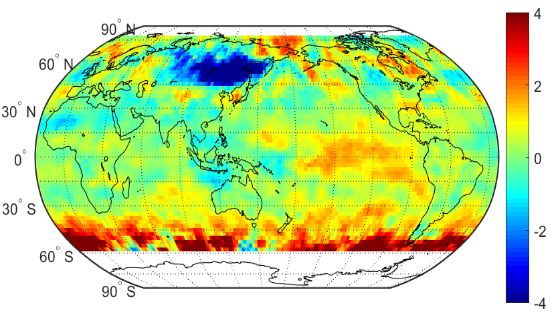
ICAESEE 2018 IOP Publishing
IOP Conf. Series: Earth and Environmental Science 237 (2019) 022009 doi:10.1088/1755-1315/237/2/022009
in July and August. The mean GOSAT CO2 concentration is about 389 ppm, generally lower than that
of the AIRS data by 3 ppm. The peak-to-trough variation amplitude of the GOSAT CO2 matches that
of AIRS, with small amplitude. The mean CO2 concentration for the AIRS and MLO data is 392.7 and
392.3 ppm, respectively. This small discrepancy may be due to the similar retrieval height. However,
the values from the MLO show larger fluctuations due to they were retrieving in the Northern
Hemisphere (NH)satellites rather than in both hemispheres.
Furthermore, we can see that hemispheric differences are evident. Larger CO2 concentrations from
GOSAT measurement appear in Central Africa, East Asia and West Asia in response to the effects
produced by both natural sources and intense human activities over these regions [19]. AIRS CO2 has
a zonal distribution pattern with high values in mid- and high latitudes of the NH, which may be
strongly influenced by surface sources and large-scale circulations of mid-latitude NH pollution belts
[20]. The enhanced CO2 concentrations over the Southern Hemisphere (SH) are probably due to
contributions from multiple processes, including fires in Australia and the uptake of CO2 at the ocean
surface [21].
a b c
Figure 1. (a) Time-series of monthly mean CO2 concentration for 58 months from AIRS, MLO and
GOSAT (in ppm); (b) The spatial distribution of monthly mean GOSAT CO2; (c) The spatial
distribution of monthly mean AIRS CO2. Units: ppm
3.2CO2 spatial pattern during different ENSO episodes
ENSO is the dominant mode of interannual variability that originates in the tropical Pacific but
influences regional weather and climate variability all over the world. Studies have shown that ENSO
events can affect the spatial distribution of CO2 concentrations over regions. Therefore, we further
examine the impact of ENSO on CO2 spatial patterns. Three ENSO episodes during our study period
were selected: a warm period (July 2009 to April 2010), a cold period (July 2010 to April 2011 and
July 2011 to April 2012) and a neutral period (July 2012 to April 2013 and July 2013 to April 2014).
The linear trend is removed from the GOSAT and AIRS CO2.
a b c
Figure 2. GOSAT CO2 for ENSO neutral warm episode (a); cold episode (b) and neutral episode (c).
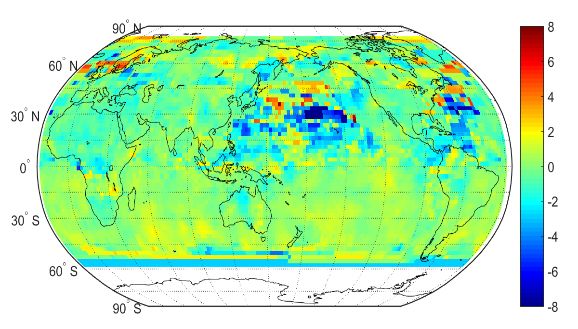
a b c
Figure 3. AIRS CO2 for ENSO neutral warm episode (a); cold episode (b) and neutral episode (c).
The GOSAT CO2 spatial distributions during the ENSO episodes are shown in Figure 2. In the
warm episode (Figure 2(a)), the CO2 concentration in tropical Africa and East and West Asia is higher
3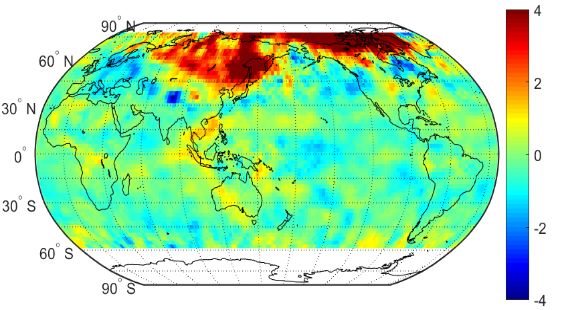
ICAESEE 2018                                                                              IOP Publishing
IOP Conf. Series: Earth and Environmental Science 237 (2019) 022009   doi:10.1088/1755-1315/237/2/022009

than during the cold and neutral episodes (Figure 2(b,c)). In the cold episode, the subtropical Pacific
Ocean and Atlantic Ocean CO2 concentrations are significantly greater than in the warm and neutral
episodes. The results indicate that warm episodes have a notable impact on land, while cold episodes
have a greater impact on ocean regions.
    The AIRS CO2 spatial distributions during the ENSO episodes are shown in Figure 3. Significant
differences can be found over the NH high latitudes (40°–60°N) and the Atlantic Ocean from South
America to Africa (0°–20°S) between the values for the warm and neutral episodes and the values for
the cold episode. The values over Northeast Asia, eastern North America and the Atlantic Ocean are
found to be enhanced in the warm episode and reduced in the cold and neutral episodes. The
difference between the highest and lowest values in the cold episode is larger than that in the warm
episode. ENSO has a greater impact in the GOSAT data than in the AIRS data.
           a                                             b

           c                                             d

           e                                             f

  Figure 4. GOSAT CO2 patterns processes in ENSO warm (a,c,e) and cold (b,d,f) episode. We select
   month of September (a,b), December (c,d), and the March (e,f) represent ENSO onset, prevail and
                                             decay stage.
    Furthermore, we illustrate the CO2 spatial variability during different stages of both ENSO warm
and cold episodes. To reveal the changes in CO2 during an ENSO episode, we subtract the neutral
episode from the warm and cold episodes, respectively. As both warm and cold episodes begin in July
and end in April of the following year, the results for September, December and March are shown to
represent the onset, mature and decay stages of ENSO, respectively. For the GOSAT data (Figure 4),
during the onset stage, CO2 in the warm episode decreases by about 4–6 ppm over the mid–high
latitude land and ocean regions (40°–80°N) in the NH, whereas it decreases by 1–2 ppm in the cold
episode. During the mature stage, higher values in the warm episode move southward to the mid-
latitudes and concentrate in the Pacific and Atlantic oceans. Synchronized with the warm episode,
higher values in the cold episode also move to the Pacific and Atlantic oceans, but with a weaker
magnitude. During the decay stage, the differences over land are not obvious while the values over the
subtropical Pacific Ocean during the warm episode are significantly enhanced. There is a significant

                                                     4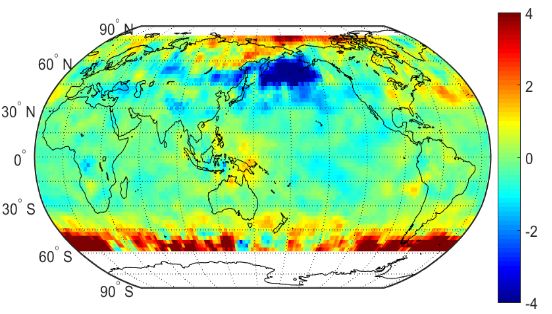
ICAESEE 2018                                                                              IOP Publishing
IOP Conf. Series: Earth and Environmental Science 237 (2019) 022009   doi:10.1088/1755-1315/237/2/022009

influence on the high latitudes in the NH and Pacific Ocean during the onset and mature stages of an
ENSO warm phase.
    Meanwhile, for the AIRS data (Figure 6), during the onset stage, CO2 decreases significantly in
Northern Asia and northern United States during the warm episode, while the variations in the cold
episode are slight. During the mature stage, CO2 in the warm episode decreases by about 4 ppm over
Northern Asia, which is 2 ppm in the cold episode. It is worth noting that CO2 in the cold episode
decreases by 4 ppm in Pacific Ocean, whereas it is enhanced in warm episode. During the decay stage,
the CO2 patterns in the warm and cold episodes are similar. These results demonstrate that a warm
ENSO episode has a remarkable impact on Northern Asia and the Pacific Ocean, especially in its onset
and mature stages. ENSO regions in the AIRS data are more pronounced compared with GOSAT data.
          a                                          b

          c                                           d

          e                                              f

        Figure 5. AIRS CO2 patterns processes in ENSO warm (a,c,e) and cold (b,d,f) episode.

4. CONCLUSION
Using data retrieved from AIRS and GOSAT measurements, we analyze the spatial-temporal patterns
of atmospheric CO2 concentration and their variations in various ENSO episodes. We find that the
spatial patterns of 58 month GOSAT CO2 are mostly related to strong CO2 emissions, while AIRS
CO2 is distributed zonally, increasing from the tropics to the high latitudes and reaching a maximum at
40–60°N. There is an overall increase in CO2 concentration during the warm ENSO episode, while
there is an overall decrease during the cold ENSO episode for both the GOSAT and AIRS data. The
analysis of CO2 variations in different ENSO stages shows that the differences are significant during
the onset and mature phases. For the GOSAT measurements, we directly observe a decrease in CO2
concentration over high latitudes (about 4–6 ppm) during the ENSO warm onset phase. During the
ENSO warm mature stage, CO2 centers move to the mid- and low latitudes, especially in the Atlantic
and Pacific oceans (>6 ppm). During the ENSO warm decay phase, CO2 concentrations are
significantly enhanced over the high latitudes and subtropical Pacific Ocean. For the AIRS
measurements, CO2 decreases significantly over Northern Asia and the northern United States during
the ENSO warm onset stage. During the ENSO warm mature stage, CO2 concentration decreases by

                                                     5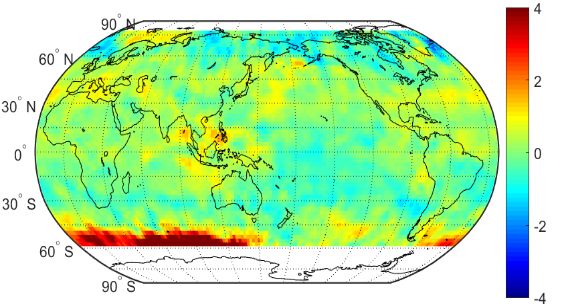
ICAESEE 2018                                                                              IOP Publishing
IOP Conf. Series: Earth and Environmental Science 237 (2019) 022009   doi:10.1088/1755-1315/237/2/022009

about 4 ppm over Northern Asia and the Pacific Ocean. The differences between the GOSAT and
AIRS data for the decay phase in both ENSO warm and cold episodes are small.
   ENSO influences atmospheric and oceanic circulation, precipitation, temperature and fire
emissions [22–23]. Wang et al. [24] suggested that environmental factors, such as forest cover,
vegetation, fire emissions and temperature, could determine the spatial distribution of CO2 on a large
scale. Therefore, CO2 anomalies may be attributed to a combination of terrestrial sources, such as
global biosphere uptake, soil and plant respiration, and fire emissions, as well as oceanic sources. As
no model simulations were used to derive the distribution of CO2, the reasons discussed in this paper
need further investigation.

Acknowledgments
This work was supported by the National Key Research and Development Program of China (Grant
No. 2016YFA0602503). We thank the members of the GOSAT Project for providing the GOSAT
Level 3 data products, and NASA for providing the AIRS CO2 datasets.

References
[1] Solomon, S., Qin, D., Manning, M., Chen, Z., Marquis, M., Averyt, K.B., Tignor, M., Miller, H.L.
          (2007) Climate Change 2007: The Physical Science Basis, Contribution of Working Group 1
          to the Fourth Assessment Report of the Intergovernmental Panel on Climate Change (IPCC).
          Cambridge University Press, Cambridge.
[2] Bacastow, R.B., Keeling, C.D., Whorf, T.P. (1985) Seasonal amplitude increase in atmospheric
          CO2 concentration at Mauna Loa, Hawaii. J. Geophys. Res., 90: 529–540.
[3] Nevison, C.D., Mahowald, N.M., Doney, S.C., Lima, I.D., van der Werf, G.R., Randerson, J.T.,
          Baker, D.F., Kasibhatla, P., McKinley, G.A. (2008) Contribution of ocean, fossil fuel, land
          biosphere, and biomass burning carbon fluxes to seasonal and interannual variability in
          atmospheric CO2. J. Geophys. Res., 113: 255–270.
[4] Sarachik, E.S., Cane, M.A. (2010) The El Nino-southern Oscillation Phenomenon. Cambridge
          University Press, pp. 381
[5] Denning, A.S., Fung, I.Y., Randall, D. (1995) Latitudinal gradient of atmospheric CO2 due to
          seasonal exchange with land biota. Nature, 386: 240–243.
[6] Lintner, B.R. (2002) Characterizing global CO2 interannual variability with empirical orthogonal
          function/principal component (EOF/PC) analysis. Geophys. Res. Lett., 29: 1921.
[7] Jones. C.D., Cox, P.M. (2005) On the significance of atmospheric CO2, growth rate anomalies in
          2002–2003. Geophys. Res. Lett., 32: 337–349.
[8] Qian, H., Joseph, R., Zeng, N. (2008) Response of the terrestrial carbon cycle to the El Nino-
          Southern Oscillation. Tellus B, 60: 537–550.
[9] Jiang, X., Chahine, M.T., Olsen, E.T., Chen, L., Yung, Y.L. (2010) Interannual Variability of Mid-
          tropospheric CO2 from Atmospheric Infrared Sounder. Geophys. Res. Lett., 37: 232–236.
[10] Jiang, X., Wang, J., Olsen, E.T., Liang, M., Pagano, T.S., Chen, L., Licata, S.J., Yung, Y.L. (2013)
          Influence of El Nino on mid-tropospheric CO2 from Atmospheric Infrared Sounder and
          Model. J. Atmos. Sci., 70: 223–230.
[11] Kumar, R.K., Tiwari, Y.K., Revadekar, J.V., Vellore, R., Guha, T. (2016) Impact of ENSO on
          variability of AIRS retrieved CO2 over India. Atmos. Environ., 142: 83–92.
[12] Ruzmaikin, A. H., Aumann, H., Pagano, T. S. (2012) Patterns of CO2 Variability from Global
          Satellite Data. J. Clim., 25: 6383–6393.
[13] Sun, Z., Wang, X., Tani, H., Zhong, G. (2016) CO2 concentration spatial distribution of different
          ENSO episodes in South America Using GOSAT Data. American Journal of Climate Change,
          5: 77–87
[14] Chatterjee, A., Gierach, M.M., Sutton, A.J., Feely, R.A., Crisp, D., Eldering, A., Gunson, M.R.,
          O’Dell, C.W., Stephens, B.B., Schimel, D.S. (2017) Influence of El Nino on atmospheric
          CO2 over the tropical pacific ocean: findings from nasa's OCO-2 mission. Science, 358: 5776.

                                                     6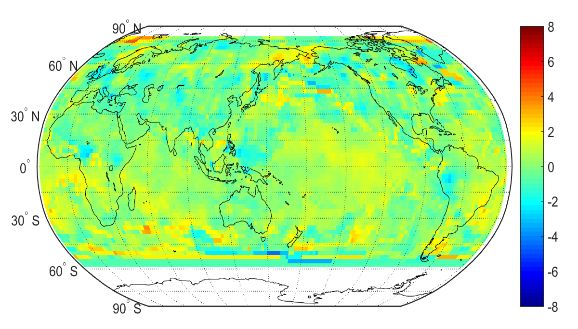
ICAESEE 2018                                                                              IOP Publishing
IOP Conf. Series: Earth and Environmental Science 237 (2019) 022009   doi:10.1088/1755-1315/237/2/022009

[15] Yoshida, Y., Ota Y., Eguchi, N., Kikuchi, N., Nobuta, K., Tran, H., Morino, I., Yokota, T. (2011)
         Retrieval algorithm for CO2 and CH4 column abundances from short–wavelength infrared
         spectral observations by the Greenhouse gases observing satellite. Atmos. Meas. Tech., 4:
         717–734.
[16] Yoshida, Y., Kikuchi, N., Morino, I., Uchhino, O. (2013) Improvement of the retrieval algorithm
         for GOSAT SWIR XCO2 and XCH4 and their validation using TCCON data. Atmos. Meas.
         Tech., 6: 1533–1547
[17] Chahine, M., Barnet, C., Olsen, E.T., Chen, L., Maddy, E. (2005) On the determination of
         atmospheric minor gases by the method of vanishing partial derivatives with application to
         CO2. Geophys. Res. Lett., 322: 154–164.
[18] Chahine, M., Chen, L., Dimotakis, P., Jiang, X., Li, Q., Olsen, E.T., Pagano, T., Randerson, J.,
         Yung, Y.L. (2008) Satellite remote sounding of mid-tropospheric CO2. Geophys. Res. Lett.,
         35: 179–190.
[19] Hammerling, D.M., Michalak, A.M., O'Dell, C., Kawa, S.R. (2012) Global CO2 distributions over
         land from the greenhouse gases observing satellite (GOSAT). Geophys. Res. Lett., 39: 8804.
[20] Zhang, L., Jacob, D. J., Bowman, K.W., Logan, J.A., Turquety, S., Hudman, R.C. (2006) Ozone–
         co correlations determined by the TES satellite instrument in continental outflow regions.
         Geophys. Res. Lett., 33: l18804.
[21] Wofsy, S.C. (2011) HIAPER Pole-to Pole Observations (HIPPO) fine-grained, global-scale
         measurements of climatically important atmospheric gases and aerosols. Philos. Trans. Roy.
         Soc. London, 369A: 2073–2086.
[22] Page, Y. L., Pereira, J.M.C., Trigo , R., Camara, C.D., Oom, D., Mota1, B. (2008) Global fire
         activity patterns (1996–2006) and climatic influence: an analysis using the World Fire Atlas.
         Atmos. Chem. Phys., 8: 1911–1924.
[23] Resplandy, L., Séférian, R., Bopp, L. (2015) Natural variability of CO2 and O2 fluxes: What can
         we learn from centuries–long climate models simulations. J. Geophys. Res., 120: 384–404.
[24] Wang, J., N. Zeng, M. Wang. (2016) Interannual variability of the atmospheric CO2 growth rate:
         roles of precipitation and temperature. Biogeosciences, 13: 2339–2352.

                                                     7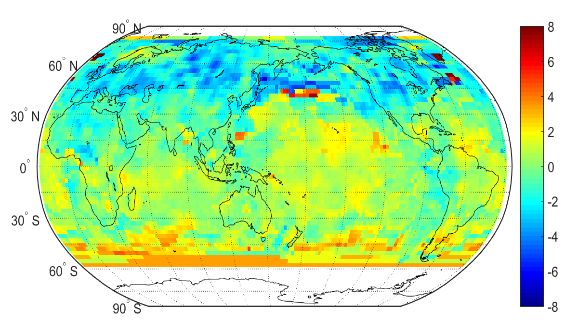
You can also read