Research on Submarine landslide monitoring and early warning system
←
→
Page content transcription
If your browser does not render page correctly, please read the page content below
E3S Web of Conferences 257, 03016 (2021)                                                            https://doi.org/10.1051/e3sconf/202125703016
AESEE 2021

         Research on Submarine landslide monitoring and early warning
         system
         Shanshan Yan 1, Liang Xue1, Tianyang Liang1, Yankai Hou1, Hanlu Liu1, and Hongxian Shan1,2,*
         1Institute
                 of Environmental Science and Engineering, Ocean University of China, Qingdao, Shandong, China
         2The Key Laboratory of Marine Environment and Ecology, Ministry of Education (Ocean University of China), Qingdao, Shandong,
         China

                        Abstract. Monitoring and early warning of submarine landslides could provide instant predictions for
                        landslides, which is to avoid the destructive damage of submarine facilities such as pipelines and optical
                        cable, etc effectively. However, researches on submarine landslide focus on numerical simulation and
                        laboratory test, lacking support of in-situ observation data. This paper established the submarine landslide
                        monitoring and early warning system by combining real-time monitoring data with web network platform
                        and database technique. Based on the computational analysis of key monitoring parameters in the process of
                        seabed deformation and sliding, the system has realized the accurate prediction and early warning of
                        submarine landslides. The system has been applied to the submarine landslide monitoring in Zhoushan sea
                        area, Zhejiang province, China, which has ensured the safety of offshore platforms and submarine projects
                        in this area. The establishment of this system provides a new idea and method for submarine landslide
                        warning.

                                                                                 Domestic and foreign scholars have used side-scan
      1 Introduction                                                         sonar, pressure sensor, acceleration sensor, and other
                                                                             equipment to monitor submarine landslides [13-15].
      Submarine landslide refers to the geological                           Saito et al.[15,16] used acceleration sensors to monitor
      phenomenon that the slope located on the seafloor is                   the sliding velocity of the seabed and calculated the
      destabilized and damaged by its internal dynamic factors               sliding displacement of the seabed. Fabian M et al.[17,18]
      such as seismic activity, volcanic activity, active fault, or          used a triaxial acceleration sensor and an inclinometer to
      by Marine dynamic factors such as storm surge and tidal                monitor the lateral deformation of the seafloor, while
      change, and moves downhill along a certain slope due to                Stenvold and Wallace et al.[19,20] used a high-precision
      the action of gravity [1-3]. Submarine landslides can                  manometer to monitor the seafloor pressure, thereby
      damage oil and gas exploitation platforms, pipelines,                  obtaining the seafloor subsidence deformation. The
      submarine communication cables, and other facilities                   monitoring parameters of submarine landslides in the
      [4-6]. At the same time, it can also cause the                         above studies are relatively single and have not been
      decomposition of natural gas hydrates, and induce wave                 combined with the landslide warning work.
      whirlpools and tsunamis [7-11].                                            In this paper, the monitoring and early warning
          The monitoring and early warning of submarine                      methods of land-based landslides are used for reference,
      landslides can effectively avoid the massive damage and                and a monitoring and early warning system of submarine
      reduce the loss of lives and property. However, at present,            landslides is built by using the Web platform combined
      the monitoring and early warning techniques for                        with database technology. The system can monitor the
      submarine landslides are lacking. Most of the research                 parameters closely related to submarine landslides in
      work on submarine landslides focuses on numerical                      real-time, and set parameter threshold and early warning
      simulation and laboratory tests, which are not highly                  formula for submarine landslides. Taking Zhujiajian Sea
      related to in-site monitoring. Therefore, it is impossible             Area of Zhoushan City, Zhejiang province, China as an
      to carry out real-time early warning and prediction for                example, this study conducted in-site monitoring on the
      submarine landslides. Peng Xiao and Anlong Li [12]                     potential area of submarine landslide, and combined with
      used GIS technology and AHP multi-level analysis                       in-situ monitoring data, carried out early warning on the
      method to build a landslide risk assessment model to                   occurrence of submarine landslide.
      give early warning of submarine shallow landslides in
      the underwater delta of the Yellow River and made a
      preliminary exploration on the submarine landslide early
      warning.

             *Corresponding author: Hongxian Shan, E-mail address: hongxian@ouc.edu.cn

© The Authors, published by EDP Sciences. This is an open access article distributed under the terms of the Creative Commons Attribution License 4.0
(http://creativecommons.org/licenses/by/4.0/).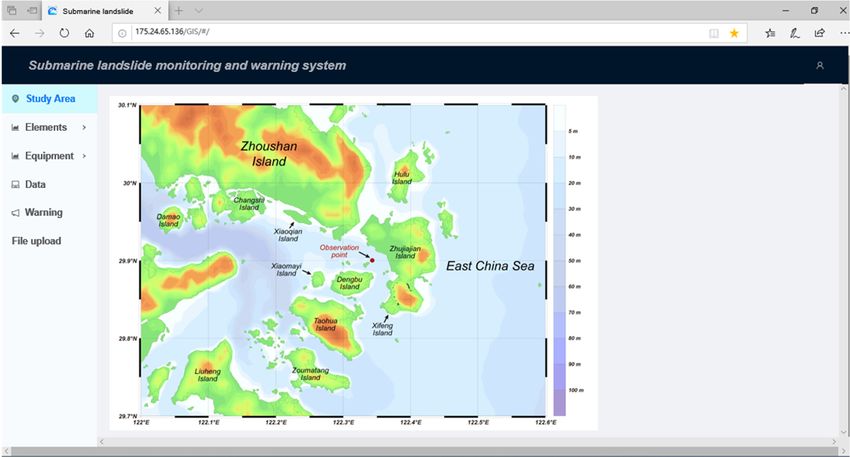
E3S Web of Conferences 257, 03016 (2021)                                                         https://doi.org/10.1051/e3sconf/202125703016
AESEE 2021

      2 Design and working principle of the                                 equipment is mainly composed of 4G wireless router and
      system                                                                transmission antenna. Data storage and acquisition
                                                                            devices can connect to 4G wireless router by peripheral
      There are four parts in this system (Fig.1): monitoring               extension interfaces, and plug in Ethernet and build a
      indicators, data acquisition and transmission, system                 network to form a local or region-wide monitoring
      operation, and release of early warning information.                  network. A real-time data transmission module is placed
                                                                            in the sealed cabin, in which the antenna needed for
                                                                            transmission is connected with the floating ball on the
                                                                            surface of the sea by a water-tight plug to the outside, to
                                                                            carry out network signal communication.

                                                                            2.3 System operation
                                                                            The submarine landslide monitoring and early warning
                                                                            system is divided into the front-end page system and
                                                                            back-end data processing and calculation system. The
                                                                            Tomcat server was selected to build the system and
                                                                            deployed on the Linux system, the Tomcat server enables
                                                                            connections to local resources, providing services to Java
                                                                            JARs and static packages on the front end and its ports
                                                                            can be configured directly. The server provides the
                                                                            front-end page display and a deployment environment
                                                                            for the back-end JAR packages, meanwhile, the logging
                                                                            system records the state of the running JAR package. By
       Figure 1. Principles of system structure. This system consists       forming a map on the Linux system, the ports mapped to
        of four parts, here are the principles of each part, and each       the Tomcat server can be accessed on the public network.
                    workflow is connected by an arrow                       At this point, the public IP can correspond to the IP on
                                                                            the Linux system, which means the user can access the
                                                                            public IP to obtain the resources on the Tomcat server.
      2.1 Monitoring indicators                                             The back-end server is connected to the database, while
      In the part of monitoring indicators, seabed deformation              the front-end page system is connected to the GIS API
      and displacement, pore water pressure, wave, and tide,                Server, and when the front-end page system calls API, it
      etc are included. Monitoring of seabed soil deformation               will conduct data interaction with the back-end system,
      is aimed to analyze the vertical and horizontal                       the back-end system will feed back the calculation
      displacements of the slope, besides, identifying the                  results to the front-end page for the user to consult.
      position of discontinuity points in the displacement field,
      so as to identify landslides, in this way we recognize                2.4 Release of early warning information
      where the slide is. There is a certain relationship between
      seabed stability and hydrodynamics, the variation of                  The release of warning information is based on the
      wave load and velocity will cause the variation of pore               monitoring data (Fig.1), parameter threshold setting and
      water pressure on the seabed, while the increase of                   modification are provided by the system, users can view
      excess pore water pressure in the seabed will lead to the             the basic information and monitoring data of the
      decrease of effective stress, the stability of the seabed             monitoring field in combination with the base map.
      would be reduced as well [21]. The influence of tides and             When a monitoring indicator exceeds the threshold value,
      waves lead to excess pore water pressure in the seabed,               the system will automatically make a pop-up alert, or
      therefore, monitoring of pore water pressure and                      users input the warning model parameters as required, if
      hydrodynamic plays an important indicator role in                     the result is determined by the algorithm to be in danger
      monitoring and warning of submarine landslide.                        of slipping, the system will give warning information.
                                                                            The hydrodynamic factor is the main initiation
                                                                            mechanism of submarine landslide in shallow sea area.
      2.2 Data acquisition and transmission                                 In Xu’s study [22], he calculated the sliding stability of
      The data acquisition and transmission part is composed                sediments under the influence of wave cyclic load, he
      of acquisition and communication equipment. The                       noticed that the shear strength determines the stability of
      acquisition equipment includes seabed deformation and                 the sediment, slip failure occurs when the shear strength
      displacement monitoring system (array displacement                    of partial seabed sediments decreases to a level
      sensor, watertight acquisition warehouse, data storage                consistent with the critical condition of wave-induced
      acquisition instrument), pore water pressure monitoring               sediment instability. In the study of Wu et al.[23],
      system (sensor, probe rod, acquisition instrument), and               numerical simulation shows that when the shear stress
      integrated hydrodynamic monitoring system (tidal wave                 along the slope is greater than the shear strength of
      instrument, Acoustic Doppler Current Profiler, and                    seabed sediments, submarine landslides may occur in
      Acoustic Doppler Velocimeter). Communication                          this area.

                                                                        2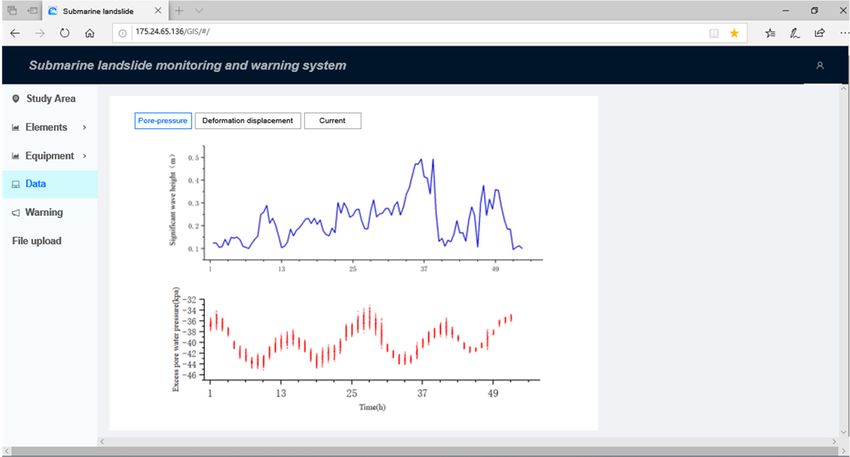
E3S Web of Conferences 257, 03016 (2021) https://doi.org/10.1051/e3sconf/202125703016
AESEE 2021
3 Composition of the system of geological environment elements, the monitoring
equipment display, visualization of monitoring data
The submarine landslide monitoring and early warning analysis, and release of early warning information.
system (Fig.2) consists of six parts: the login part of the
system, the overview of the research area, visualization
Figure 2. The user interface of the submarine landslide monitoring and warning system, here is the overview of the study area, the
left content includes other functions
In the login part of the system, administrators and The release of early warning and forecast is the early
casual users are separated. Casual users log in the system warning about the monitoring data. The system provides
mostly to consult the geological environment the setting and modification of threshold parameters.
information and monitoring data of the research area, Users can view the basic information and monitoring
check the submarine landslide warning information, etc. data of the monitoring area with the base map. When a
The administrators can edit, delete and modify the data monitoring data exceeds the threshold, the system will
and chart information on the system. automatically give a pop-up box warning.
The physical geographic information of the research
area can be seen from the overview of the research area.
This part is an embedded part in advance. When the 4 Application of the system
research area is changed, the files uploaded in the In this chapter, the submarine landslide monitoring and
implementation process can be changed, which applies to early warning system is applied in the southwest sea area
different research areas. of Zhujiajian Island, Zhoushan City, Zhejiang Province,
The visualization module of geological environment China. The landslide area is located on the north-eastern
elements systematically displays the collected geological slope of the tidal scour trough on the southwest side of
data of the research area on the interface, which can the island, with a depth of more than 100 m. According
provide more standard reference materials for users, so to the depth data of the water and multi-beam sounding
as to get a comprehensive understanding of the area and data of Zhujiajian landslide, the terrain in this region is
research on submarine landslide. from northeast to southwest, first lower and then higher.
The purpose of the display of monitoring equipment In general, the southwest is lower than the northeast, and
is to make users understand the equipment and technical the terrain is concave.
parameters used in the in-situ monitoring work, and The geographical coordinates of the monitoring area
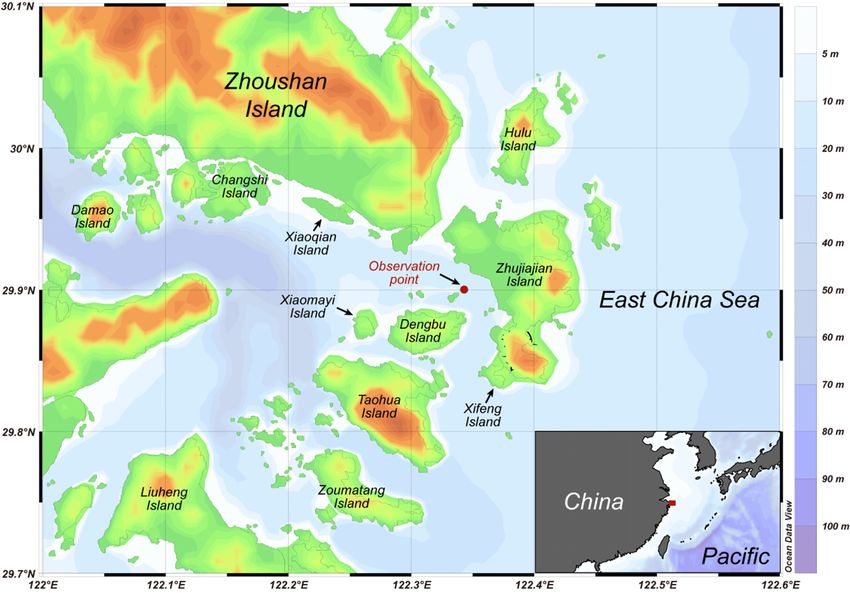
know the acquired monitoring parameters. The are: N 29°54 '1 ", E 122°20' 36 "(Fig.3). In-situ
monitoring equipment are: seabed deformation and monitoring of the area began on Jul 22th, 2019, and the
displacement monitoring system, pore water pressure equipment was recovered on Dec 10th to finish the
monitoring system and integrated hydrodynamic monitoring task. The data analysis visualization module
monitoring system. analyzed and displayed the in-site monitoring data during
Monitoring data analysis visualization includes data this period. The monitoring area was about 350 km away
uploading, data browsing, data downloading, data from the landfall of Typhoon “Lekima”. The monitoring
deleting, modification, editing, etc. In order to data changed significantly during the landfall of
understand the change trend and overall situation of each Typhoon “Lekima” (Aug 10-11th, 2019), and the
monitoring parameter better, this study includes data analysis of the monitoring data during this period was
analysis description files, which can be uploaded and introduced as an example.
analyzed by other auxiliary mapping software.
3E3S Web of Conferences 257, 03016 (2021) https://doi.org/10.1051/e3sconf/202125703016
AESEE 2021
Figure 3. Monitoring stations. This figure shows the exact location of the monitoring station, and the insert shows the location of the
study area
As shown in Fig. 4, under the influence of Typhoon condition. According to the velocity monitoring results,
“Lekima”, the effective wave height increased neap tides occurred on Aug 10th and 11th, with the
significantly, rising from about 0.1 m under calm sea maximum surface velocity of 1.07 m/s, the minimum
conditions to the highest 0.5 m. Correspondingly, surface velocity of 0.03 m/s, the maximum bottom
influenced by the change of wave intensity, the excess velocity of 0.72 m/s, and the minimum bottom velocity
pore water pressure on the seabed also changes of 0.01 m/s. During the observation period, there were
significantly. The excess pore water pressure in the two obvious periods: around 13:40 and 23:00 on Aug
shallow sediments on the seabed fluctuates significantly 10th, the average surface velocity (0.91 m/s) was
under the action of waves, with an amplitude of 2-4 kPa. significantly higher than that of the bottom velocity (0.61
As a comparison, it can be seen that the excess pore m/s), indicating that the near-surface velocity was greatly
pressure amplitude is about 0.5 kPa under the calm sea affected by wind and waves.
Figure 4. Data analysis of the system, the significant wave height and the excess pore water pressure on the seabed changes
obviously under the influence of Typhoon “Lekima”
During the monitoring period, the maximum seabed the monitoring data, the system found that the shear
deformation displacement was 10 mm. After calculating strength of soil in this area was relatively large, and the
4E3S Web of Conferences 257, 03016 (2021) https://doi.org/10.1051/e3sconf/202125703016
AESEE 2021
system calculated that there was no submarine landslide 6. Q.L. Yang, Journal of Ocean Technology, 4, 65-67,
risk in this area. (1994)
7. C.K. Paull, W.J. Buelow, W. Ussler, Geology,24,
5 Conclusions 143-146, (1996)
8. H.Y. Gan, J.S. Wang, G.W. Hu, Journal of disaster
In this paper, a submarine landslide monitoring and early prevention and mitigation engineering, 24,
warning system was built based on in-situ observation 177-181,(2004)
data, the main conclusions are as follows: 9. X.T. Peng, H.Y. Zhou, G.Q. Chen, Journal of
(1) Based on the on-site monitoring data, the Natural Disasters, 11, 18, (2002)
submarine landslide monitoring and early warning
system has been established to realize the prediction and 10. H.X. Weng, Y.Y. Xu, Z.S. Lou, Journal of Zhejiang
early warning of submarine landslide. University. Sciences Edition, 47, 588-594+600,
(2) The system’s judgment of monitoring and (2006)
warning results for submarine landslide is consistent with 11. H.B. Song, Progress in Geophysiscs, 3, 503-511,
the analysis of on-site monitoring results. (2003)
12. P. Xiao, A.L. Li, Geological Science and
Technology Information, 35, 226, (2016)
Acknowledgements
13. T. Yokoyama, M. Shimoyama, S. Matsuda, K. Tago,
This work was supported by the project of National J. Takshima, Tenth ISOPE Ocean Mining and Gas
Natural Science Foundation of China (41877223): Hydrates Symposium. (2013)
Research on initiation process and controlling factors of 14. J.G. Moore, D.A. Clague, R.T. Holcomb, J Geophys
submarine landslide in Yellow River underwater delta Res-Sol Ea, 94, 17465-17484, (1989)
based on in-situ observation. I would like to extend my
15. H. Saito, T. Yokoyama, S. Uchiyama,
deep gratitude to my senior fellow apprentices Tian Chen,
OCEANS,(2006)
Fang Lu, Zhihan Fan, and Zhiwen Sun, who offered me
pratical cordial and selfless support in writing this 16. Y. Awashima, H. Saito, T. Hoaki, S. Sawada,
manuscript. T.Fukasawa, S. Sukizaki, Y. Ishihara, K. Kano, N.
Arata, OCEANS, (2008)
17. M. Fabian, H. Villinger, GEOCHEM GEOPHY
References GEOSY, 9, 2008
1. M.A. Hampton, H.J. Lee, J. Locat, Rev Geophys, 34, 18. M. Fabian, H. Villinger, Mar Geophys Res,
33-59, (1996) 28,13-26, (2007)
2. J. Locat, H.J. Lee, Can Geotech J, 39, 193-212, 19. L.M. Wallace, S.C. Webb, Y. Ito, M.
(2002) Kimihiro,Science, 352, 701-704, (2016)
3. G.H. Hu, Z.X. Liu, J.W. Fang, Advances in Marine 20. T. Stenvold, O. Eiken, M. Zumberge, G. Sasagawa,
Science, 24, 130-136, (2006) S. Nooner, Spe Journal, 11, 380-389, (2006)
4. .Maslin, Mark, Mikkelsen, Geology, 26, 1107, 21. Z.H Wang, Y.G. Jia, X.L. Liu, W. Wei, X.L. Wang,
(1998) S.T. Zhang, H.X. Shan, Periodical of Ocean
5. G. Dan, N. Sultan, B. Savoye, Mar Geol, 245, 40-64, University of China, 47, 104-112, (2017)
(2007) 22. G.H. Xu, D, 2006
23. S.G. Wu, S.S. Chen, Z.J. Wang, Geoscience,
22,430-437, (2008)
5You can also read


