Investor presentation - April 2021 - pfandbrief.market

Page created by Randy Jordan
 
CONTINUE READING
Investor presentation - April 2021 - pfandbrief.market
Investor presentation

April 2021
Investor presentation - April 2021 - pfandbrief.market
Leading lender for green

    1990                    and   social infrastructre                                    4.7million
  FOUNDING YEAR                                                                               CLIENTS
     100% subsidiary
       of BayernLB
                            Second largest                                            Local authorities. companies
                                                                                            and retail clients
                            onlinebank in Germany

                            Industry Leader in
                            sustainability
   110 billion                                                                             77billion
BALANCE SHEET TOTAL                                                                       CLIENT LOANS
  One of the top 20 banks                                                                     in Germany
       in Germany

    4.500                                                                                954 million
     EMPLOYEES                                                                        NET INTEREST INCOME
                                                       Target: Sustainable TechBank
Investor presentation - April 2021 - pfandbrief.market
Stable Development. Despite Corona crisis.

Business                                                              Results
 Continued growth in lending business across                          Net interest income at previous year's level with
  all segments of EUR 7bn                                               EUR 954m
 Significant deposit growth of EUR 11.6bn                             Profit before tax of 249m above expectations
 The main driver of the increase in total assets                      Investments in transformation. digitization and
  is participation in the TLTRO programme with                          restructuring as main cost drivers
  EUR 14bn

Risk                                                                  Ratios
 Robust credit portfolio in the environment of the                    Return on equity:          7.7%
  corona crisis due to focus on sectors largely
                                                                       Cost-Income-Ratio:       61.2%
  independent of economic cycles
                                                                       Equity ratio:            11.6%
 Improved risk result compared to the previous year

3 I Investor presentation I April 2021 I IFRS-data as of 31/12/2020
Investor presentation - April 2021 - pfandbrief.market
Corona-crisis impact. Minor.

 Germany                                                              Business Development
 Comprehensive package of measures by the                             Up to 90% of employees took advantage of the home
  German government and federal states to                               office option in 2020
  combat the economic consequences of corona                           Support of borrowers with the help of promotional
 Public authorities and development banks as                           loans and other tools
  financiers and guarantors for many aid                               Stable core business
  programmes

Risk management                                                       Credit risk
 Operational risks limited by digital mindset and                     Credit Risk Task Force established to monitor and
  appropriate technology and processes                                  manage the Corona crisis
 No relevant liquidity effects                                        DKB's business almost exclusively in Germany
 Equity exposure in the low three-digit range                         Only single customer groups affected by Corona
                                                                        pandemic - including tourism
 Bond exposure almost exclusively in LCR-eligible
  bonds of core European issuers

4 I Investor presentation I April 2021 I IFRS-data as of 31/12/2020
Investor presentation - April 2021 - pfandbrief.market
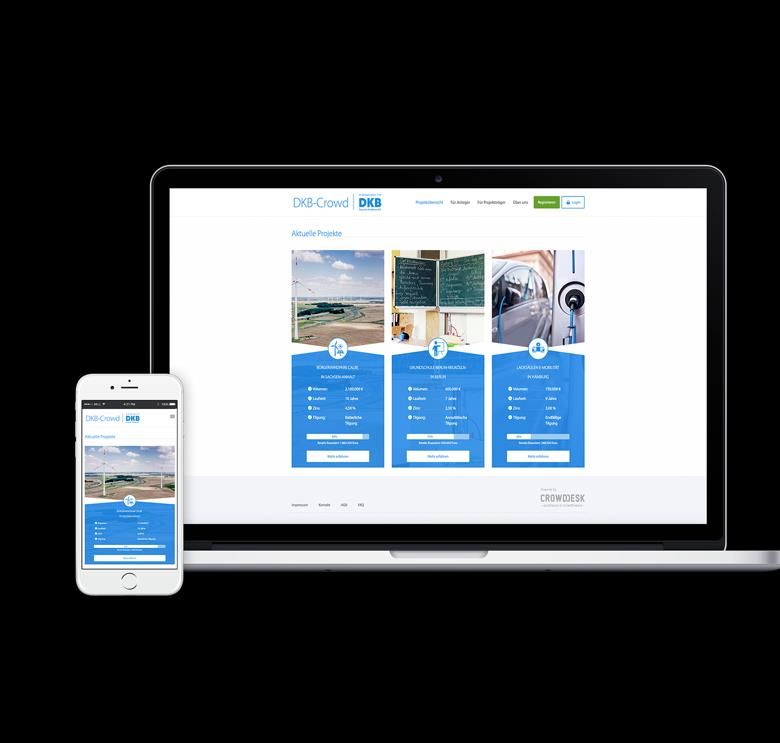
Covid-19. Impact scenario analysis.
Loan volume (EUR bn)                                                                                                Corona impact scenario
30
                                                                                                                   German Savings Banks Association
                              Housing                                                                               (DSGV) has published a scenario
                               24,5                                                                                 analysis regarding the impact of
                                                                                                                    Covid-19
20                          Local authorities &
                            social infrastructure                                                                  Based on economic sectors and
                                     16,8                                                                           DSGV industry forecast
                                                                                                                   Considers supply shortfalls. the drop
                                                          Environmental
                                                           technologies
                                                                                                                    in demand and the government
10                                                                                                                  interventions
                                                               8,9

                   Food & agriculture                                       Individual clients                     Impact index (6 = strong impact of
                          3,8                             Energy & supply          2.6         Other corporates
                                                                7,2                                                 crisis. 1 = low impact)
                                                                                                (incl. Tourism)
                                                                                                       1,3         “Translation” of the impact index into
0                                                                                                                   DKB client groups
     DSGV
     0scale          1               2               3               4             5              6

     Source: DSGV and DKB
     5 I Investor presentation I April 2021 I IFRS-data as of 31/12/2020
Investor presentation - April 2021 - pfandbrief.market
Agenda.

                                                         1            Business model

                                                         2            Facts and figures

                                                         3            Sustainability

                                                         4            Funding

                                                         5            Contact

6 I Investor presentation I April 2021 I IFRS-data as of 31/12/2020
Investor presentation - April 2021 - pfandbrief.market
1

Business model.
                                                                       2

 7 I Investor presentation I April 2021 I IFRS-data as of 31/12/2020
Investor presentation - April 2021 - pfandbrief.market
Ownership structure. Munich. Berlin.

               Free State of Bavaria                                                                Association of Bavarian Savings Banks
                 ≈ 75 %
                                                                BayernLB Holding AG                              ≈ 25 %
                                                                          100%

                                                                                               Binding letter of comfort and profit/loss transfer agreement

                                                                       Real Estate &
     Corporates & Markets
                                                                 Savings Banks/Association

 Specialized bank for future                            Real estate financier in Germany    Innovative Tech-Bank with
  sectors                                                 and chosen markets abroad            sustainable focus (#geldverbesserer)
 Structuring experts                                    Central Bank of the Bavarian        Strong earnings growth planned
                                                          savings banks and partner for        through targeted doubling of customer
 Focused financial markets offer
                                                          public business                      base

8 I Investor presentation I April 2021 I IFRS-data as of 31/12/2020
Investor presentation - April 2021 - pfandbrief.market
Business model. Market leadership.

                                                                                    Infrastructure
                                                                                         48.6
              Second biggest
               Online Bank in
               Germany                                                                                Financing of services for the
                                                                                                       public welfare
              Market leader
               regarding current
               accounts                             Retail clients
                                                        13.8

              Biggest renewable
               energy portfolio in                                                                    Projects usually with a
               Germany                                                                                 municipal background
                                                                  Corporate
              Market leader in                                    clients
                                                                    14.0
               agricultural
               business                                                  Loan volume
                                                                               =
                                                                       70% of total assets

9 I Investor presentation I April 2021 I IFRS-data as of 31/12/2020
Investor presentation - April 2021 - pfandbrief.market
Business units. Two.

26 branches
                                     Business customers                                             Retail clients
   across
 Germany                                                                                                                               Online
                       Infrastructure                             Corporate clients                                                   approach
                                             7.2bn
                                                                             8.9bn                     8.7bn
                24.5bn

                                           Energy &                       New energies
                                            supply                                                                           2.5bn
                                                                                         3.8bn     Mortgage loans
                                           16.8bn
               Housing
                                                                                                                         Personal loans
                                                                                                         2.6bn
                                                                          1.3bn       Food &
                                                                                     agriculture

                                    Local authorities &                                             Individual clients
                                          social                       Other                            and other
                                      infrastructure                 corporates

   10 I Investor presentation I April 2021 I IFRS-data as of 31/12/2020
Customer strategy. Growth. Sustainability.

                                                                                                         8m clients until 2024
9,0

8,0

7,0

6,0                                                                                    Scalability of
                                                                                       lending
5,0                                                  DKB Broker                        business
4,0

3,0
                                                                                                                                        Increase
2,0                                                                                           Expansion of                             profitability
                                                                                              product range
1,0                                           DKB Cash
0,0
      2007      2008      2009      2010      2011      2012      2013   2014   2015     2016    2017   2018   2019   2020   2021   2022   2023

11 I Investor presentation I April 2021 I IFRS-data as of 31/12/2020
Digitization. Key to success.

                         DKB Crowd

                                                                           Own Fintech

                                                                       Stake in municipal
                                                                        funding platform

12 I Investor presentation I April 2021 I IFRS-data as of 31/12/2020
2

Facts & Figures.

 13 I Investor presentation I April 2021 I IFRS-data as of 31/12/2020
Overview.

Key figures*                                                2020               2019       2018       2017       2016       2015

Total assets                                                109.840 m          83.754 m   77.388 m   77.323 m   76.522 m   73.429 m

Customer receivables                                          76.557 m         69.526 m   65.933 m   64.552 m   63.228 m   61.582 m

Customer liabilities                                          72.409 m         60.767 m   54.366 m   53.931 m   53.438 m   48.558 m

Net interest income                                               954 m          954 m      945 m      935 m      795 m      790 m

Profit after tax                                               249 m            298 m      301 m      263 m       327 m      225 m

Cost income ratio (CIR)                                           61.2%          56.7%      51.5%      50.8%      45.8 %     48.0 %

Return on equity (ROE)                                              7.7%          9.5%      10.2%       9.6%      12.4 %      9.6 %

Equity ratio                                                      11.6%          11.1%      11.1%      10.5%      10.0 %      9.1 %

     * DKB Group in accordance with IFRS. Angaben in EUR

     14 I Investor presentation I April 2021 I IFRS-data as of 31/12/2020
Business performance. Positive.
                         Loan volume (EURbn)                                          Customer deposits (EURbn)
                                                 +7.1        76.6
            65.9         +3.6        69.5                     0,2                                                         72.4
                                      0,2                     13,8                                             +11.6
             0,1                      12,8                                                 +6.4     60.8                   4,6
             12,4
                                                              14,0
                                                                              54.4                    3,6
                                      13,5                                     4,0
             13,2
                                                                                                                          49,4
                                                                                                      40,8
                                                                               35,0
                                      43,0                    48,6
             40,2
                                                                                2,4                    2,3                 2,5
                                                                               13,0                   14,1                15,9

             2018                    2019                     2020             2018                  2019                 2020

             Infrastructure     Corporates        Retail      Other             Infrastructure    Corporates     Retail   Other

   Growth was driven by all segments, especially the                   Exceptional growth in deposits, especially in the retail
    customer groups, products:                                           customer segment
    - Local authorities & social infrastructure                         Slight increase in deposit volumes in the corporate
    - Housing                                                            customer segment
    - Mortgage Loans

15 I Investor presentation I April 2021 I IFRS-data as of 31/12/2020
Earning figures. Solid.

     Net interest income (EURm)                                          Cost Income Ratio               LCR

                                                                                        61,2%   31.12.2020     356%
                                                                               56,7%
        945            954             954                             51,5%

                                                                                                31.12.2019     164%

       2018           2019           2020                              2018     2019     2020

        Net profit after tax (EURm)
               Tourismus                                                  Return on equity         Leverage Ratio

                                                                       10,2%    9,5%            31.12.2020     3.64%
                                                                                         7,7%
          301             298
                                          249
                                                                                                31.12.2019     3.71%

         2018            2019            2020                          2018     2019     2020

16 I Investor presentation I April 2021 I IFRS-data as of 31/12/2020
Risk and figures. Improved.
       RWAs based on SA* (EURbn)                                               Risk result (EURm)             Equity ratios (SA*)
                                                                                                          10.8%          11.1%            11.6%
                        69,5            76,6                                                              9.4%            9.3%             9.6%
         65,9
                                                                       - 112
         31,5           33,2            33,7
                                                                                     - 56      - 39       9.1%            9.1%             9.1%

        2018            2019           2020                            2018          2019      2020       2018            2019            2020
                                                                                                                  Equity ratio
                Loan book              RWAs                                                                       Core capital ratio (T1)
                                                                                                                  Common equity ratio (CET1)

          Loan portfolio quality                                        Non Performing Loans                 Capital measures
               0,5%
             1,1%           Investmentgrade (bis BBB-)
                                                                        0.9%         0.9%              Equity increase of EUR 200
          9,9%                                                                                 0,5%
                            Non-Investmentgrade (bis BB-)                                               million through capital reserve
                            Non-Investmentgrade (bis C)                                                 allocation by BayernLB
              88,6%
                            Non Performing Loans                        2018         2019      2020

* Standardised approach (SA)
17 I Investor presentation I April 2021 I IFRS-data as of 31/12/2020
3

Sustainability.

 18 I Investor presentation I April 2021 I IFRS-data as of 31/12/2020
Sustainability. A business model.

1996
First wind                   2001                   2004                 2011                                                        2018
turbine                      Launch of the                                                 2014                                      First social bond
                                                    Establishment of     EMAS-             Account opening     2016
financed.                    online bank.           DKB STIFTUNG.                                                                    issued.
                                                                         Certification     process             First green bond
                                                                                           becomes 100%        issued.
                                                                                           digital.

  1998                         2002                    2009                                  2015
  First public-                First day-care
                                                       Sustainability                        Industry
  private                      centre for
                                                       management                            Leader with
  partnership                  children (Kita).                                                                                                              2020
                  2000                                 embedded                              ISS-oekom for                              2019
  project.
                  First              2003              directly in the       2013            the first time.     2017
                                                                                                                                        World's first blue
                  biogas             First             Board of              DKB Bürger-                         New forms of
                                                                                                                                        social bond
                  plant.             PV plant          Management.           sparen                              work through
                                                                                                                                        issuance
                                     financed.                               scheme.                             “Projekt Arbeiten
                                                                                                                 4.0” project.

 19 I Investor presentation I April 2021 I IFRS-data as of 31/12/2020
Sustainability approach. Blue.

     Differentiation                                                     Blue sustainability

 Expansion of the concept
  of sustainability                                                     Ecological + social

 Sustainable Development                                               Orientation towards people's
  Goals (SDGs) as a                                                      needs
  strategic foundation                                                  Positioning sustainability in the
 Inclusive instead of                                                   mainstream
  exclusive

20 I Investor presentation I April 2021 I IFRS-data as of 31/12/2020
Sustainability goals. Ambitious.

            Until 2023                                                            Until 2030
            the most convincing sustainable                                       Become carbon neutral
            product range among the top 20                                        in our office operations
            banks

                                                                                                             Until 2050
                                                        Until 2030                                           Meet the 2-degree-goal with
                                                        EUR 80bn in sustainable                              all DKB products
                                                        financing

Source: DKB Sustainability Strategy 2019
21 I Investor presentation I April 2021 I IFRS-data as of 31/12/2020
SDGs. Mapping.
                   Signi-
                   ficant                                                     Share of
                   Sub-                             Volume       Change vs.   loan        Customer groups according
                   targets       Description        in € bn      2018         portfolio   to Bundesbank code

                                Access to financial                                       Private customers, employees,
                   1.4          services            10.6 bn €   +4.5%         15.8%       family members & others

                                Access to
                   3.8          healthcare          2.6 bn €     +13.7%       3.8%        Doctors, nursing & hospitals

                   4.1; 2; 3;                                                             Schools, kindergartens,
                                Access to education 0.8 bn €

                                                                                                                                77,8%
                   5                                             -16.6%       1.2%        universities and inclusion

                                Access to clean
                   6.1; 3       water               0.8 bn €     -3.0%        1.2%        Water / sewage, waste
                                                                                                                                of our customer
                   7.2; 3; a;   Support for                                               Wind, solar, bioenergy,               loans (EUR 54.1bn)
                   b            renewable energies 9.9 bn €      +0.5%        14.9%       hydropower & energy efficiency
                                                                                                                                have a significant
                                Access to                                                 Public transport, communal &          contribution
                   9.1          affordable housing 16.7 bn €     +6.1%        24.8%       cooperative housing

                                Justice & strong                                          Municipalities, foundations, public
                   16.3; 6      institutions       10.6 bn €     +6.5%        15.9%       institutions & corporations

                   17.1         Improve tax levies 0.1 bn €      +14.7%       0.8%        Tax consultancy

Source: DKB Annual Report 2019 (Data from 31.12.19)
22 I Investor presentation I April 2021 I IFRS-data as of 31/12/2020
Sustainable performance. Outstanding.

             Industry Leader since 2015
             Decile Rank: 1
             Peergroup: Financials/ Public & Regional
              Banks
             Size of peer group: 277 Banks

23 I Investor presentation I April 2021 I IFRS-data as of 31/12/2020
4

Funding.

 24 I Investor presentation I April 2021 I IFRS-data as of 31/12/2020
Credit. Ratings.
                                                                                              Mortgage
Agency                           Type of rating                        Public Pfandbriefe                     Senior Unsecured
                                                                                             Pfandbriefe
Moody‘s                      Covered Bond Rating                               Aaa                Aaa

                                  Issuer Rating
                                                                                                                      A1
                                (senior preferred)
                           Junior Senior Unsecured
                                                                                                                      A2
                            (senior non-preferred)

                                   Adjusted BCA                                                                     baa1

                                       Outlook                                                                      stable

ISS-ESG                        Sustainability rating                             -                 -              B- (Prime)

  imug                         Sustainability rating                     Very positive (A)   Positive (BBB)      Positive (BB)

25 I Investor presentation I April 2021 I IFRS-data as of 31/12/2020
Funding. Mix.
                                                                                                         2%
                                                                                                    4%
                                     Primary funding source,                                   8%
Customer deposits                    diversified through all client segments

                                                                                         13%
Development                          Pass-through and global loans
banks                                (e.g. from KFW. EIB. Rentenbank)                               Liabilities**
                                                                                                                        62%
                                    Since 2006 mainly via Pfandbriefe                    11%
Capital markets
                                    Since 2016 Green Bonds
funding                             Since 2018 Social Bonds

                                                                                                    Customer deposits
                                    Central bank operations on an opportunistic basis.              Development Banks
Central Bank                        Participation in TLTRO III with EUR 14bn due to                 ECB
                                                                                                    Capital market
                                    attractive conditions                                           Equity
                                                                                                    Other

    * Treasury perspective without registered bonds held by non-banks
    ** In relation to total assets
    26 I Investor presentation I April 2021 I IFRS-data as of 31/12/2020
Funding strategy. Exclusively sustainable.

                                                                                                                      Focus:
 Three Green Bond issuances:                                                                                 Green and Social Bonds
  First Senior Unsecured                                                         16%
  Green Bond in Germany (2016).                                                                                Future issuances
  further issuance (2017)                                                                                       EXCLUSIVELY in
  First Green Bond complaint with                                        11%                                    sustainable formats
  EU Green Bond Standard and                                                                                   As green or social bonds
  Taxonomie (2021)                                                                                              or new sustainable bond
                                                                                                                formats
                                                                                                        73%
 Three Social Bond issuances:                                                                                 For both benchmark
  First social covered bond (2018)                                                                              transactions and private
                                                                               Conventional issues
                                                                                                                placements (in progress)
  First Blue Social bond (2019)                                                Social Bonds (Pfandbriefe)

  First Retail Social Bond (2019)                                              Green Bonds (Sen. Unsecured)

  27 I Investor presentation I April 2021 I IFRS-data as of 31/12/2020
Funding. Volume.

                    Placement volume (EURm)                                                              Maturity profile (EURm)

2500                                                                              2000
2000                                                                              1500
1500
                                                                                  1000
1000
 500                                                                               500

    0                                                                                0
        2011 2012 2013 2014 2015 2016 2017 2018 2019 2020                                2021 2022 2023 2024 2025 2026 2027 2028 2029 2030
             Pfandbriefe     Senior unsecured (Green Bond)       Social Bond               Pfandbriefe   Social Bond   Senior unsecured (Green Bond)

                                                       • Capital markets funding depends on deposit
                                                         growth and maturities
                                                       • New driving factor: ECB actions, in
                                                         particular TLTRO

28 I Investor presentation I April 2021 I IFRS-data as of 31/12/2020
Green. Bonds.

Renewable energy portfolio: EUR 10.8bn
                                                                                                                          !
10.000
 8.000
 6.000
                                                                       Funding                                       
 4.000
 2.000
     0

          Wind     Photovoltaik      Sonstige
                                                                       Green
                                                                       Bonds
                                                                                   2016   500m EUR Senior non-preferred

                                                                                   2017   500m EUR Senior non-preferred
                                                                       Reporting
                                                                                   2021   500m EUR Senior preferred       new

29 I Investor presentation I April 2021 I IFRS-data as of 31/12/2020
Social. Bonds.

                   Social                                              Funding
               infrastructure

                                                                       Social
                                                                       Bonds
                                                                                   2018   500m EUR Social Pfandbrief

                                                                                   2019   Retail Social Pfandbrief
                                                                       Reporting
                                                                                   2019   500m EUR Blue Social Pfandbrief

30 I Investor presentation I April 2021 I IFRS-data as of 31/12/2020
Public Pfandbrief. Cover pool.                                                       Federal
                                                                                                                          Republic of
                                                                                                                           Germany
                                                                                                            Municipal       0.2%
                                                                                                             service
                                                                                                            authorities            Federal States
                                                                                                              0,0%                     9,1%
 Cover assets                         Number       Volume

 German federal government                6                13

 German federal states                  109               965           100% German assets
 German cities and municipalties       5,383             7,701          High granularity (Ø-Volume:               Cities and

 Other cover assets                       1                 1            EUR 1.5m)                                municipalities
                                                                                                                    (GER)
                                                                                                                    90,7%
 Total                                 5,499             8,680
 Volumen in EURm

 Key figures*
                                                                                                                                                    Aaa
 Outstanding bond volume (EURm)                4,424.8
                                                                        Rating over-collateralization                                              Aa1
                                                                         requirements significantly
 Rating Moody's                                 Aaa
                                                                         exceeded
 Over-collateralization required by
                                                1.0%
 Moody‘s                                                                Collateral score stable on
 NPV over-collateralization                     98%
                                                                         low level
 Collateral score                               2.4%
                                                                                                         Collateral Score               Rating
* As of December 2020
  Source: Moody’s

31 I Investor presentation I April 2021 I IFRS-data as of 31/12/2020
Public Pfandbrief. Cover pool.
                      Overcollateralization                                             Distribution of volumes
                                  (EURm)                                                           (EURm)

                                                                       2500

                                                                       2000

                                                                       1500

                                                                       1000

                                                                        500

                                                                         0
                                                                              up to 1 up to 2 up to 3 up to 4 up to 5 up to over 10
                                                                               year year year year year 10 year years
                                                                                       In circulation    Cover pool

32 I Investor presentation I April 2021 I IFRS-data as of 31/12/2020
Mortgage Pfandbrief. Cover pool.
                                                                                                                                       Thuringia 6%
                                                                                                                                                       Baden-Württtemberg 5%
                                                                                                                    Schleswig Holstein 2%                       Bavaria 5%
 Cover assets                         Number       Volume                                                           Saxony-Anhalt 7%
                                                                                                                                                                         Berlin 11%
 Residential loans                    33,584           1,805            100% Germany                               Saxony 11%

 Housing-industry investors            3,232           4,958            Very high granularity                 Saarland 0.4%
                                                                                                                                                                         Brandenburg 11%

 Other cover assets                      10              410
                                                                        Housing-industry investors      Rhineland-Palatinate 1%                                       Bremen 1%
 Total                                36,826           7,173             are mainly residential
                                                                                                              Northrhine-Westphalia                                   Hamburg 3%
Volume in EURm                                                           property companies                            15%

                                                                                                                          Lower Saxony 5%                        Hesse 8%
                                                                                                                                                 Meckenburg Western
                                                                                                                                                   Pomerania 7%

 Key figures*                                                                                                                                                                  Aaa
                                                                                                                                                                               Aa1
 Outstanding bond volume (EURm)                4,283.5                                                                                                                         Aa2
 Rating Moody's                                 Aaa                     Rating over-collateralization
 Over-collateralization required by                                      requirements significantly
                                               11.5%
 Moody‘s                                                                 exceeded
 NPV over-collateralization                    66.4%
 Collateral score                               8.6%
                                                                                                                               Collateral Score               Rating

* As of Dezember 2020
  Source: Moody’s

33 I Investor presentation I April 2021 I IFRS-data as of 31/12/2020
Mortgage Pfandbrief. Cover pool.
                               Overcollateralization                                     Distribution of volumes
                                           (EURm)                                                    (EURm)

                                                                       2500

                                                                       2000

                                                                       1500

                                                                       1000

                                                                        500

                                                                         0
                                                                              up to 1 up to 2 up to 3 up to 4 up to 5 up to 1 above
                                                                               year years years years years years              10
                                                                                                                              years
                                                                                         In circulation   Cover pool

34 I Investor presentation I April 2021 I IFRS-data as of 31/12/2020
Mortgage. Cover pool.

                                        Type                                                 Type. Details

                                          2%                                                         0%
                                                                                                1%        1%

                                                                                               8%

                                                                                        19%

                                                                                                           71%
                                              98%

                                                                       Apartment buildings            One- and two-family houses
                              Residential          Commercial          Condominiums                   Office building
                                                                       Trade building                 Other (for commercial purpose)

35 I Investor presentation I April 2021 I IFRS-data as of 31/12/2020
5

Contact.

 36 I Investor presentation I April 2021 I IFRS-data as of 31/12/2020
Personal.
Uwe Jurkschat
Head of Funding and Investor Relations
Tel.: +49 (0)30 12030-2924
E-Mail: uwe.jurkschat@dkb.de

Anna Stawowy
Funding and Investor Relations
Tel.: +49 (0)30 12030-2910
E-Mail: anna.stawowy@dkb.de

Hannes Merlecker
Funding and Investor Relations
Tel.: +49 (0)30 12030-3317
E-Mail: hannes.merlecker@dkb.de

www.dkb.de

Follow us on

                     @DKB_de
Disclaimer
The information in this presentation constitutes neither an offer nor an invitation to subscribe to or purchase securities. It does not
represent a recommendation to buy, sell or hold any securities. The information in this presentation is solely intended for
informational purposes and does not serve as a basis for any kind of obligation, contractual or otherwise. The presentation may not
be copied in whole or in part, distributed, forwarded or sent directly or indirectly by any means to a third party without prior written
consent.

Statements in this presentation represent solely the opinion of Deutsche Kreditbank AG. All the information contained in this
presentation has been compiled with care. However, Deutsche Kreditbank AG does not expressly or silently guarantee the
accuracy, completeness or suitability of the information in this presentation for any particular purpose. Deutsche Kreditbank AG
assumes no direct or indirect liability from this presentation. Furthermore, investors should bear in mind that statements concerning
past performance do not indicate or represent a guarantee of future performance or returns. Deutsche Kreditbank is under no
obligation to update or regularly review the information in this presentation.

This presentation may be subject to legal restrictions in some jurisdictions. All persons in possession of this presentation are
explicitly advised to personally inquire about any restrictions that may apply and to comply with them. The information may not be
used in foreign jurisdictions without permission.

39 I Investor presentation I April 2021 I IFRS-data as of 31/12/2020
You can also read