Aaronia EMF-Monitor Software - User Guide
←
→
Page content transcription
If your browser does not render page correctly, please read the page content below
Aaronia EMF-Monitor Software

          User Guide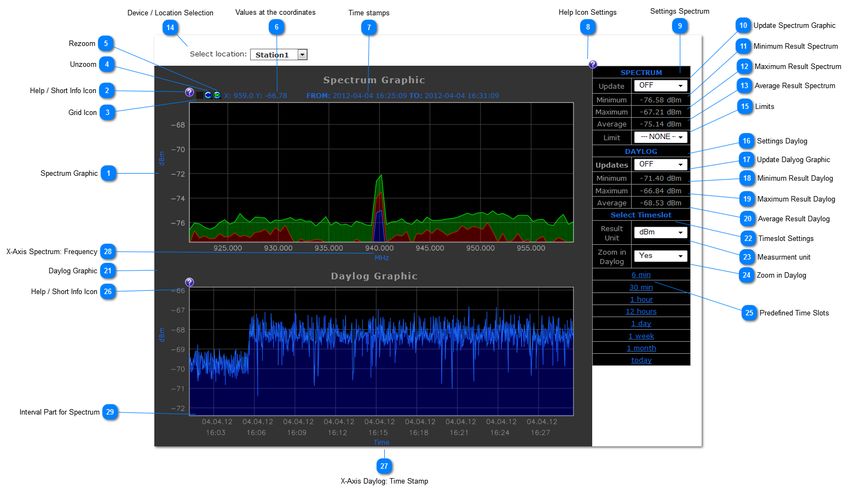
Summary
Aaronia EMF-Monitor Software................................................................................................................. 3
 Hardware Overview................................................................................................................................. 4
 Installation & Configuration..................................................................................................................... 6
   System Requirements........................................................................................................................... 7
   Installation in local network................................................................................................................... 8
   Customize your User settings............................................................................................................. 11
   Stand-alone Installation....................................................................................................................... 13
   Date and Time Settings...................................................................................................................... 14
 Web based usage with EMF - Monitor Software.................................................................................. 15
   Graphical Analysis...............................................................................................................................17
   Login page...........................................................................................................................................21
   IP4 Network Configuration.................................................................................................................. 22
   IP6 Network Configuration.................................................................................................................. 24
   Box Updates........................................................................................................................................ 25
   Spectran Settings................................................................................................................................ 28
   User Configuration...............................................................................................................................33
   System Overview.................................................................................................................................36
   Filebrowser for Recordings................................................................................................................. 38
   Graphics / Visualization....................................................................................................................... 40
   Recording / Configuration Examples...................................................................................................45
     Single recording................................................................................................................................ 46
     Infinite recording................................................................................................................................49
 Stand-alone Installation with MCS Software......................................................................................... 50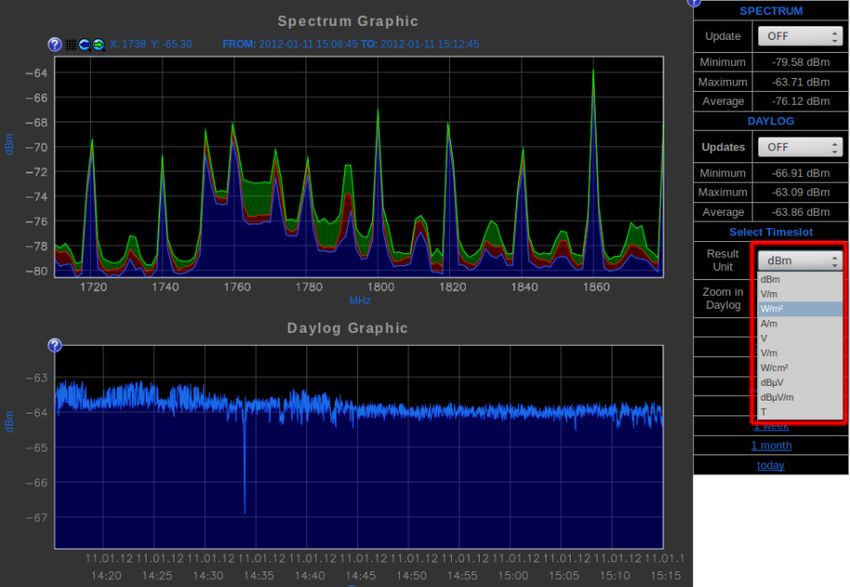
Aaronia EMF-Monitor Software
Aaronia EMF-Monitor Series

Our SPECTRAN RSA Series is available with three different Aaronia SPECTRAN spectrum analyzer (two high
frequency analyzer and one low frequency analyzer). You can find all technical details in the specific datasheet
on our website.

The EMF - Monitor software is an optional part for our RSA series. This software gives you the possibility to
access the spectrum analyzer via web interface all over the world (for example bound to a static IP address). You
can control the SPECTRAN settings, start or stop a recording or download data from the RSA. Create your own
network of measurement stations at different locations.
The EMF - Monitor software offers a lot of features, like a graphical spectrum and daylog which have additional
interactive controls. Exported data can be imported to our MCS software for further analysis etc. Please note, the
EMF - Monitor software is completly based on web technolgies and it isn't possible to integrade all features like
we offer in our MCS software. But at the moment it supports a lot of features and we are currently working on the
EMF - Moinitor software to improve performance, designs and features.
You will get new enhancements as updates for your SPECTRAN RSA.

All other components of the SPECTRAN RSA are based on open source products. There are no additional costs
for licences for third party software. This gives you also the possibility to integrade your customized automations
into the SPECTRAN RSA. This makes the SPECTRAN RSA very flexible in the technical capabilities.

IMPORTANT: If you develope on your RSA, we can't give you any warranty that all will work after your changes.
 If you decide to develop new features for the system, please make a complete running backup for security
reasons.
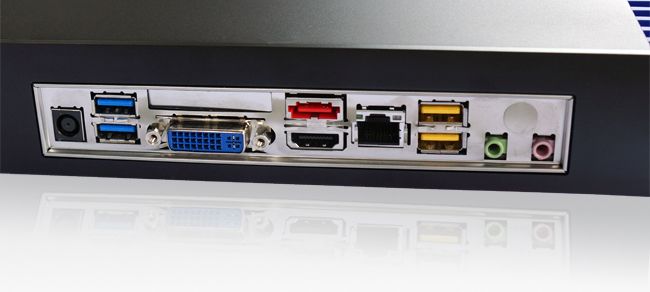
Hardware Overview

The SPECTRAN RSA is usable in two different variations. First, you can use it as stand-alone compter. The RSA
is installed with a Linux operating system with a graphical desktop environment. Our latest version of the MCS
Spectrum Analyzer software is already installed on the system. You can connect a monitor, keyboard and mouse
to the RSA and work with it like with a normal office computer. You'll find all information about this in the chapter
Stand-alone Installation with MCS Software.

If you have also bought this EMF Monitor software, you have the possibility to use a web interface to control the
SPECTRAN RSA via web browser. You'll find a detailed description about the web interface in the chapter Web
based usage with EMF - Monitor Software.

SPECTRAN RSA Front and back panel overview

The front panel is divided into to areas. On the left side you'll find the controls for the internal computer. As
described on the panel, it's the button to turn on/off the pc and a front panel USB 2.0 port. On the right side you'll
find the controls for the internal spectrum analyzer, in- and outputs. From the left to right of the spectrum analyzer
panel, you find a audio output, thr RF input and the on/off button.

The RSA has all important ports to connect external peripherals. Four USB ports (2 USB 3.0, 2 USB 2.0), HDMI
and DVI monitor port, Ethernet, audio and microphone input, DC-Power input and a SATA port. At the side of the
spectrum analyzer, you'll only find a mini USB port to connect the analyzer to the computer. This connection is
required to use the analyzer with the computer. The USB cable will be included in delivery.
Installation & Configuration
In this chapter you find all necessary information about the general configuration of your SPECTRAN RSA.
System Requirements
Our EMF-Monitors work with an internal computer. Therefore no special system is required. The default
configuration of the the system is a Intel Celeron G530 CPU @ 2,4GHz and 4GB RAM. For all who need a bit
more power, we can offer the system with a Intel i5-2405S and 8GB of RAM.
Installation in local network
Configure IP -Address

You can connect the SPECTRAN RSA with a ethernet cable to your local network or computer. The Analyzer
has a default IP4 address (192.168.178.33, netmask 255.255.255.0). Please open a browser like
Firefox (recommended), Safari, Internet Explorer 9 and open the web interface by entering the ip address into the
address line.

Example for browser address line with default ip: http://192.168.178.33/

Now the welcome page opens (see picture below). If you don't get the the start page please check the network
configuration of your local pc or ask your network administrator.

Start screen of the web interface (description of the graphic views)

Now select the menu entry "SYSTEM CONFIGURATION -> IPv4 Configuration"
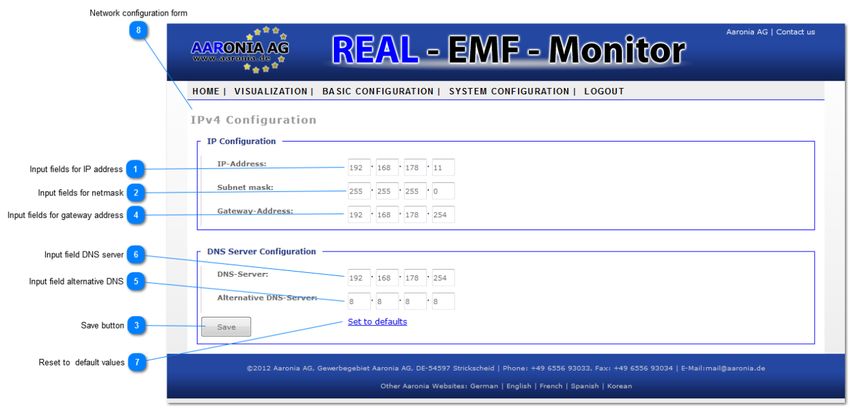
Enter your login data into the login dialog (default user: aaronia, default password: aaronia) and press the button
Login.

Login screen for configuration area (more details)

On the configuration page you can change the ip address, subnetmask and all other needed network parameters.
Save your changes by clicking the Save button.

IP4 Configuration page (more details about the configuration page)

After changing and storing the ip settings, you have to reconnect to the web interface by changing the address
line in your web browser.

Example: http://new-ip-address/

To configure the system with a IPv6 address please select the menu entry "SYSTEM CONFIGURATION -> IPv6
Configuration" and fill the IP6 formular.
Customize your User settings
Configure User settings
In the menu "BASIC CONFIGURATION -> User Settings" you can insert your personal information like
name, company, address, etc. This form isn't required for the usage of the SPECTRAN RSA, but if your are
working with more than one analyzer, you can add specific information to each box to identify them.
The configuration page looks like the screenshot below:

User settingins page (click here for more details)

At the user settings page, you can also change the username and the password (recommended to create your
own login settings!).
To save the new settings, click the "Save" or "Send" button.
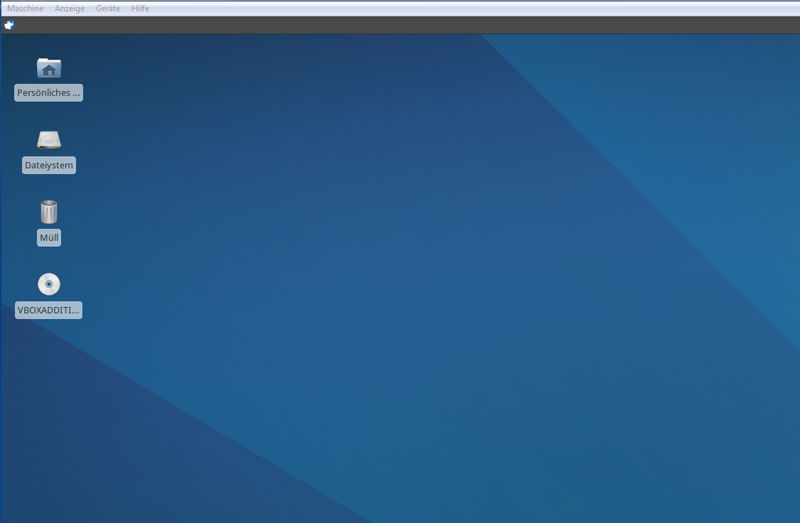
Stand-alone Installation
Booting the system

The second way to configure your SPECTRAN RSA is to connect a monitor, keyboard and mouse directly to the
computer. Turn on the computer and the system will boot up. You'll see the desktop environment like shown on
the image below.

Linux desktop environment.

Default user: aaronia
Default password: aaronia

Please change the password for security reasons.
In the Linux desktop environment you can change the network settings if you are experienced in using Linux.

It is also possible to configure the system by using the local web browser. Open the web browser from the
programs menu and follow the instructions in the chapter Installation in local network.
Date and Time Settings
Date and Time Settings for the SPECTRAN RSA

In all cases of usage, you have to configure the time and date of the RSA to the settings of your local system
or the system you'd like to see the graphics in the browser. This is required to show the right time range in the
graphical web screens like spectrum or daylog. If you choose a interval on the "Graphic / Visualisation" page, the
browser sends a request with the current start time (from your local system) to the webserver and waits for
a reply. This is important to fetch the right data for the graphics. Differences between RSA and local time can
cause problems like the message "No data found" or empty graphics.

If you have problems that no graphics were loaded, please check the time settings on your local pc and on the
RSA.
To configure the date and time of your SPECTRAN RSA, please boot the system with monitor, mouse, etc. and
set the time and date direcly in the operating system. In future versions of the EMF- Monitor software, there will
be a possibility to configure the time and date via web interface.

Keep your local date and time Settings synchronously with the RSA date and time!
Web based usage with EMF - Monitor Software
Before you start, make sure you made all necessary configurations before, like network configuration, date and
time of the RSA and your local pc.
After configuration you can access your SPECTRAN RSA with a browser from any computer you have connected
to the network by entering the configured IP address into the browser address line.

You will see the Welcome page in your browser window.

Now you can start your recordings. Please select the entry in the menu:
"BASIC CONFIGURATION -> SPECTRAN Settings"

The configuration page of the SPECTRAN will open. Please login if your asked (Default user: aaronia, Default
password: aaronia). At the settings page you can configure all important device parameters. Start your recording
by clicking the "Run profile" button.

You can find a detailed description of all available parameters on the page Spectran Settings.

After recording starts, you have to wait until enough data files are written to the harddisk. Then you can switch to
the start page or to the page "VISUALIZATION -> Graphical Analysis" to see the graphical diagrams of
your recorded data.

The speed of the graphical analysis depends on the recording properties (frequency range, RBW, Sample points,
selcted time slot, etc.).

IMPORTANT:
Lots of data take much more time in calculation of the graphics. This is important to know if you select a time slot
bigger than 12 hours in the daylog graphic.

On the page Recording Examples, we will give you some examples how to configure your SPECTRAN RSA for
different application areas.
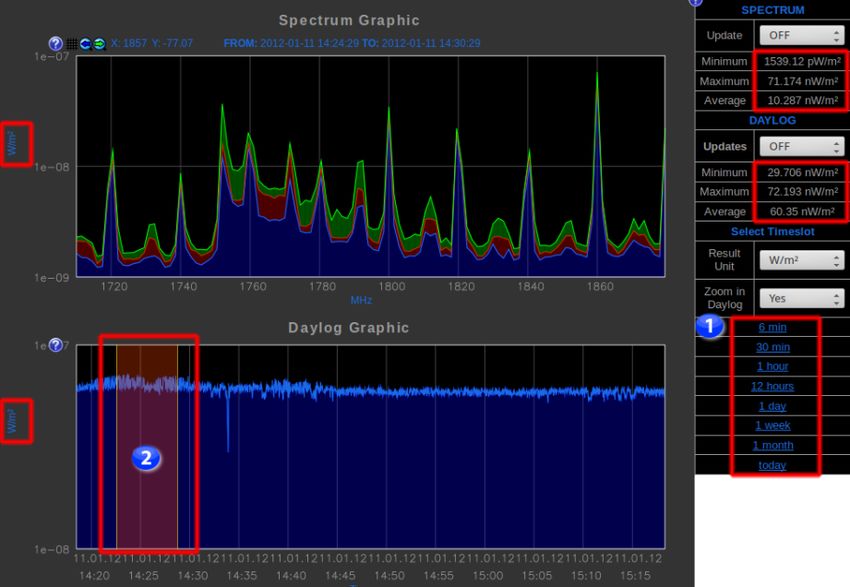
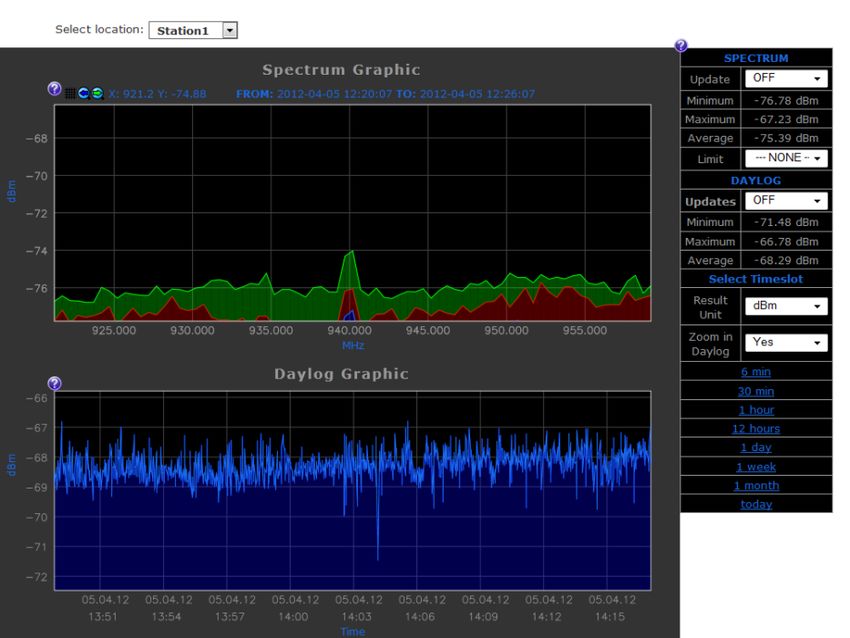
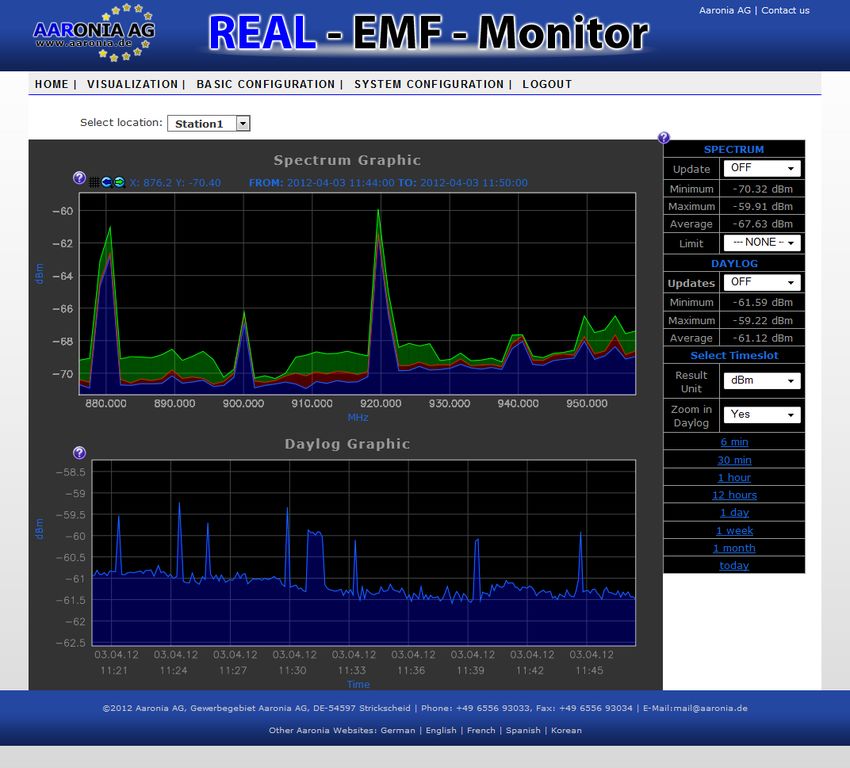
Graphical Analysis
In the graphical view, you will see two diagrams of your recorded data. These diagrams visualize by default the
history of the last 30 minutes of the data, if there are data available in this time interval. Otherwise it shows that
there are no data available.
The visualization result should look like the image below.

Here you can find a detailed description of all elements on this page.

You can find a detailed desciption of all usable parameters of the graphics page at this page.

How to work with the graphics?

If you'd like to see the graphic with another result unit, select the unit in the result window, reload the daylog by
choosing a time slot and refresh the spectrum by selecting an interval in the daylog. All values and graphics are
now converted to your selected measurement unit.
Select the result unit.
Refresh all graphics by selecting a time slot (1) and Daylog interval (2) to get a new spectrum view.

Features in Spectrum Graphic

Set custom points in the spectrum:
You can set customized points into the spectrum graphic by clicking into the graphic with the left mouse button.
To remove one or more points you have to leave the graphic area with the mouse and to hover it again.

Zoom in Spectrum Graphic:

It is possible to zoom into a spectrum graphic. For best results you should use Firefox as browser. Hold down the
right mouse button and mark the area you'd like to zoom in. For unzoom and rezoom you find a buttons at the left
corner of the graphic. Please note, to refresh the drawing, you have to leave and hover the graphic again.

For quick help you can click on the "?" icons.
Login page

Label for username field

Label for password field

Login area

Input field username

Login button

Input field password
IP4 Network Configuration

Input fields for IP address

Input fields for netmask

Save button

Input fields for gateway address

Input field alternative DNS

Input field DNS server
Reset to default values

Network configuration form
IP6 Network Configuration

Input field subnet prefix length

Input field IP6 gateway address

Input field IP6 address

Save button

Input field DNS IP6 address

Reset to default values
Box Updates

Current version of the Web interface

 Shows the currently installed version of the web interface.

Update form for Web interface and profiles

 Complete fromular for handling updates for the web interface or specific files.

Web interface update controls
All controls in this coinainer are used to update the complete web interface.

Available version

 Shows the newest version you can download.

Button Download update

 Starts update download from our update server.

Button Upload file

 Starts the file upload.

Input field for file upload

 Shows the path and filename of the selected file before upload.

Browse Button

 Opens your local file browser (e.g. Explorer, Finder) to choose the file for upload.

Profiles update controls

 This container gives you the possibillity to update / customize the settings files. If you have added new
 sweep profiles to the sweepprofiles.xml with our MCS software, you can easily install these changes on
 your RSA by uploading the file.

Button Restore backup

 The update installer creates a local backup of the current web interface before installation. If update fails,
 you can restore your old version by clicking the restore button.

Button Install update

 After downloading an update, you can install it by clicking the install button.

Indicators for actions
Column shows progress of downloading and installing the update.
Spectran Settings

Device selection

 Choose the SPECTRAN device which should be used for logging. Currently we support only one device
 in the RSA.

Default Profiles
The list shows all defined profiles from the sweepprofiles.xml file. You have the possibilitiy to edit or
define custom profiles by using the profiles editor inculded in our MCS software. You can import your
customized file as described in chapter "Box Update", into your RSA.
External Calibration Settings

 All settings in the calibration area are for external equipment which influence the measurement results.

Antenna calibration

 Choose connected antenna for calibration.

Cable calibration

 Choose connected cable type for calibration.

Attenuator calibration

 If connected an external attenuator, please select type for calibration.

Preamplifier calibration

 If connected an external preamplifier, please choose the right option for calibration.

Trigger settings

 Currently not in use, but feature will come. Attach a trigger to your measurement to get an information or
 a message if e.g. a limit has reached. This option gets it's own category in future.

Input Profilename

 Field shows the name of the selected profile from the list on the left side. Changes are not saved in the
 sweepprofiles.xml. For persitent changes, please use the profile editor included in our MCS software. All
 changes take effect only if a recording is started after configuring (e.g. changes in Startfrequency field
 etc.).

Input Startfrequency
Shows the start frequency of the selected profile. Changes only take effect if a recording is started after
 editing!

Input Stopfrequency

 Shows the stop frequency of the selected profile. Changes only take effect if a recording is started after
 editing!

Input Sweeptime

 Shows the sweep time in milliseconds of the selected profile. Changes only take effect if a recording is
 started after editing!

Resolution / SamplePoints

 Shows the sample points of the selected profile. Changes only take effect if a recording is started after
 editing!

Resolution Bandwidth

 Shows the RBW of the selected profile. You can choose between our defined RBW's. Changes only take
 effect if a recording is started after editing!

Video Bandwidth

 Shows the VBW of the selected profile. You can choose between our defined VBW's. Changes only take
 effect if a recording is started after editing!

Internal attenuator

 Shows the internal attenuator settings of the selected profile. Our SPECTRAN device includes an internal
 attenuator. You can choose between the different settings to set the attenuator in the measurement
 device. Changes only take effect if a recording is started after editing!

Detector

 Shows the detector mode of the selected profile. Changes only take effect if a recording is started after
 editing!

Internal Cache
Shows if the internal cache is enabled / disabled in the selected profile. Turning on the cache speeds up
 the measurement. But it varies due to different settings. Changes only take effect if a recording is started
 after editing!

Internal Preamplifier

 Shows if the internal preamplifier is enabled / disabled in the selected profile. Turning on the preamplifier
 gives you 15dB more sensitivity. Changes only take effect if a recording is started after editing!

Recording Options

 With this setting, you can influence the recording behavior. By default it records one sweep if the "Run
 profile" button was clicked. For other settings, please select your preferred interval from the combobox,
 enter a number into the input field.
 Writes "amount" of complete sweeps in "interval" to a file.

 Examples:

 Duration: 1 Sweeps, records only one sweep
 Duration: 100 Sweeps, records 100 sweeps
 Duration: 10 Seconds, records all complete sweeps in the time interval of 10 seconds
 Duration: 1 Minute, records all complete sweeps in the time interval of one minute
 etc.
 Infinite is a special option for unlimited recording. In that case the number in the input field describes the
 amout of sweeps per file.

Button Run profile

 Button starts the recording with the settings you selected / entered in the formular on the right.

Button Stop logging

 Button stops a currently running recording process. This may take some seconds.
User Configuration

User Configuration

 Customize your SPECTRAN RSA. Add your personal data or change the username or password.

Input Company

 Input field for inserting a company name.

Input Department

 Input field for inserting a department.

Input First Name
Input field for inserting your first name.

Input Last Name

 Input field for inserting your last name.

Input Phone

 Input field for inserting a phone number.

Input FAX

 Input field for inserting a fax number.

Input Street

 Input field for inserting a street.

Button Save

 All changes in the user profile are will be saved by clicking the save button.

Input ZIP/City

 Input field for for inserting a ZIP code and the city.

Input Country

 Input field for inserting a country.

Input Email

 Input field for inserting an email address.

Input Username

 The username is required to change the password.
Input Old Password

 The password is required to set a new password.

Input New Password

 Input field for the new password.

Button Send (Password area)

 Saves your new password settings.

Input New Password Retry

 Field for retrying new password.

Input Username

 The username is required to change it.

Input New Username

 Input field to set the new Username.

Input Password

 Required to change the username.

Button Send (Username area)
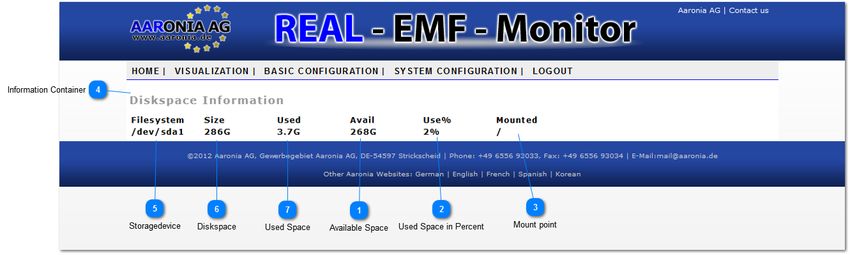
System Overview

Available Space

Used Space in Percent

Mount point

Information Container

Storagedevice

Diskspace

Used Space
Filebrowser for Recordings

Filebrowser

Create Archive

 If pressed, the web interface creates a download archive from all selected files in the file tree. If the
 package is ready, a link will appear. You can downoad the package by clicking the generated link. The file
 export creates files in the *.mdr format. You can import them into the MCS software.

Schaltfläche Delete selected files

 Deletes selected files from the harddisk. Caution, the files will be removed permanently!

Amount of Files

 Shows the amount of files in the selected directory.
Fileinformation

 Filetree shows information about the files.
       • Checkbox for selecting the file
       • Filename
       • Creation date
       • Filesize

Directory Size

 Shows the size of the selected directory.

Select / Unselect all

 Selects or unselects ALL VISIBLE files.

Directory Structure

 Expandable / collapsable directory tree. Click the directory to open or close it.
Graphics / Visualization Spectrum Graphic The spectrum graphic shows the avaraged result of the measurement data in the selected time slot of the Daylog. This means, an interval in Daylog contains mostly more than one sweeps. To show the spectrum, all sweeps in the interval are merged as average to one spectrum.
Help / Short Info Icon

 Show / hide a short help text for the usage of the spectrum graphic.

Grid Icon

 toggle grid: turns on / off the grid in the spectrim graphic.

Unzoom

 If zoomed before, you can switch back to the original graphic.

Rezoom

 Rezooms the last unzoomed area.

Values at the coordinates

 Shows the frequency and the value of the coordinate if you hover the spectrum graphic with the mouse.
 The unit of the value is equal to the stetting for the spectrum graphic.

Time stamps

 Time stamps show the current interval of the spectrum.

Help Icon Settings

 Show / hide short information

Settings Spectrum

 In this area you find all controls and also the measurement results for the spectrum graphic.

Update Spectrum Graphic

 If turned on, the Spectrum graphic will update automatically with the given settings.

Minimum Result Spectrum

 Shows the minimum value of the spectrum.
Maximum Result Spectrum

 Shows the maximum value of the spectrum.

Average Result Spectrum

 Shows the average value of the spectrum.

Device / Location Selection

 Choose device or location to gnerate the graphics. It depends on the hardware and software
 configuration. By default, each SPECTRAN RSA spectrum analyzer works with only one measurment
 device. Therefore the web interface works also only with one device and generates the graphics from the
 device measurement data.

Limits

 You have the possibillity to add a a limit curve to the spectrum graphic. It is important for the limit curve
 that you switch the measurment unit to the limit unit. Otherwise you can't see the limit curve.

Settings Daylog

 In this area you find all controls and also the measurement results for the daylog graphic.

Update Dalyog Graphic

 If turned on, the Daylog graphic will update automatically with the given settings.

Minimum Result Daylog

 Shows the minimum value of the daylog.

Maximum Result Daylog

 Shows the maximum value of the daylog.

Average Result Daylog

 Shows the average value of the daylog.

Daylog Graphic
The Daylog shows the maximum results in a special time slot. You can decide the size of the time
 interval by clicking a slot link on the right side (6 min, 30min,... etc. see Time Slots ).

Timeslot Settings

 The time slot settings only affect to the daylog. The daylog graphic always represents the data from the
 selected time slot.

Measurment unit

 With this combobox you can select the unit in which the data are presented in the daylog and the
 spectrum. The changes only take effect, if you reload the graphic by clicking a slot below. To convert the
 spectrum to another unit, you have to select the interval from the daylog. The spectrum will get the same
 measurement unit as the daylog.

Zoom in Daylog

 Zoom in Daylog: If the selected time slot is bigger than 1 hour, the Daylog automatically zooms into the
 selected interval and shows the excerpt in a new daylog graphic, which is divided into smaller intervals.
 You can disable it by selecting the option NO, than select a slot again to refresh the graphic.

Predefined Time Slots
The time slots are defined as follows:
     • 6 min:      starting now, 6 minutes in the past
     • 30 min: starting now, 30 minutes in the past
     • 1 hour:     starting now, 1 hour in the past
     • 12 hour: starting now, 12 hours in the past
     • 1 day:      starting now, 24 hours in the past
     •  1 week:    starting now, 1 week in the past (defined as 7 days)
     • 1 month: starting now, 1 month in the past (defined as 4 weeks)
     • today:     starting now, back to clock 00:00 of this day

Help / Short Info Icon

X-Axis Daylog: Time Stamp

X-Axis Spectrum: Frequency

Interval Part for Spectrum

 Selectable parts of the Daylog to generate a spectrum graphic from the choosen time interval.
Recording / Configuration Examples
In this chapter you'll find to expamples how to configure your SPECTRAN RSA for different applications. But
you have to decide which kind of configuration fits best to your application area. It is also important to know,
that he amount of data and the duration of sweeps differ from profile to other profile. All settings like resolution
bandwidth, sample points, sweeptime, frequency range etc. influence the measurement.
For example:
The default profile for GSM1800 works with the following settings:
• Frequencyrange: 1710,0MHz to 1879,9MHz
• Sweeptime: 500ms
• Samplepoints: 51
• Resolution Bandwidth: 3MHz
If you modify some parameter from this profile you'll get an other measurement:
• Frequencyrange: 1710,0MHz to 1879,9MHz
• Sweeptime: 500ms
• Samplepoints: 100 (more sample points)
• Resolution Bandwidth: 1MHz (deeper resolution)
Your recording files will grow because the spectrum analyzer has to measure more points per sweep with a
deeper resolution.
This is only a short example what happens if you modify parameters.
What is important for your configuration?
You have to find the best configuration for your applications. You have to think about, whats the best recording
duration, and the best recording mode for your application. If you decide to save a special amount of sweeps per
recording file (see example Infinite recording), you should think about the following things:
• How long does a sweep take (time required until first data are available)
• Do you prefer bigger or smaller recording files (download speed if RSA runs over the internet)
• Do you need only a special interval from a day or have you got to record a hole day, week, etc.
• Would you analyse the data only in "real time" via web interface or would you use the MCS software
(much more features) to make detailed analysis from your recordings
We can't offer you the ultimate tutorial "Best Practice of measuring with a SPECTRAN RSA" because
there are to many possibilities in usage, and all optimized settings depend on special application areas.
Configuration example overview:
1. Single recording configuration for a fixed time interval.
2. Infinite recording (long time recording) over days, weeks or longer.
More examples will follow.Single recording
Single recording for data export and analysis with our MCS software
A single recording means, that you'd like to record a fixed time interval or a fixed amount of sweeps for special
profile settings.
In the example we'd like to record GSM1800 over a time interval of 30 minutes.
Open the SPECTRAN Settings page in your browser and select the right profile from the profiles box on left.
The entries of that box differ if you have a RSA5000 or a RSA6000 to 9000. The RSA5000 is the low frequency
spectrum analyzer, therfore only profile for that device will be shown in the box.
Selected profile
Default profile parmeterAll avialable profile parameter will be inserted automatically by selecting the profile.
Calibration data
You have to select all external connected equipment to get a calibrated measurement.
If you'd like to set customized parameters, please insert them into the input fields manually. For further
configuration, please select the right antenna, cable, attenuator and preamplifier (if connected). This is required to
get a calibrated measurment.
In the field "Recording Options" you can set the duration of your recording. In our example we'd like to record
about 30 minutes. Please select "Minutes" from the combobox and write a "30" into the input field.
Now you can start the recording mode by clicking the button "Run profile".
You forgot something to configure?
Please use the button "Stop logging" to cancel the current process. Please note, it isn't possible to run more than
one logging process. You have always to cancel a currently running process before!
IMPORTANT: In our example, the process creates one data file at the end of the recorded time interval. If you
stop such a configured process, the data which are recorded before will be lost, because the process can't
reach the end of the time interval you have given. The data would be incomplete and don't match to the given
configuration. Therfore the data won't be written to the Harddisk.
Advantage of this kind of configuration:
• You get one bigger recording file which you can import into our MCS software. It's easier to analyse this
single file in the software because you have to load this file only.• If you set the recording interval bigger than 6 minutes, you can also use the graphical web screen to
visualize the data (Spectrum and Daylog).
• Records exactly the data you'd like to record.
Disadvantage of this kind of configuration:
• If you stop the recording before it is finished, the data will be lost.
• If you record a smaller time slot than six minutes, you won't see data in the graphical daylog screen,
because there are not enought data written to disk to calculate the first daylog interval.Infinite recording
Ininite recording to visualize the data in our EMF - Monitor software
This recording mode means, that the recording runs "infinite" after you started it. It only ends if you stop
it manually. In this example we also use the recording profile for GSM1800. Please open the "SPECTRAN
Settings" page and select the profile GSM1800 from the profiles list on the left. All important parameters for the
measuremet will be loaded to the input fields. Make our external calibration settings like already described in the
chapter Single recording.
Now the difference to the single recording mode.
In the group "Recording Options" select the value "Infinite" from the duration combobox. You'll see that
the lable changes from "Duration" to "Sweeps per file". Enter the number of sweeps you'd like to save per file,
into the input field. In our example 20 sweeps per file.
Start your recording by hitting the "Run profile" button.
Now your SPECTRAN RSA runs until it is stopped manually. All 20 sweeps a file will be saved which contains
these sweep data.
Advantage of this kind of configuration:
• If you stop the process manually, only the last x (amout of sweeps configured) sweeps will be lost. (If
configured with 1 sweep per file, you onloy loose one sweep)
• Easiest way for long time recordings (over days, week, etc.)
• Better data sercurity.
• Faster graphical visualization. (If you save only 5 sweeps per file, and enought data are written to the
harddisk, you can update the graphical scenes all one or five seconds and you'll see a moving daylog for
example)
• You get smaller files (depends on amout of sweeps an configured profile)
Disadvantage of this kind of configuration:
• You have to control it manally.
• You often record more data than you need.
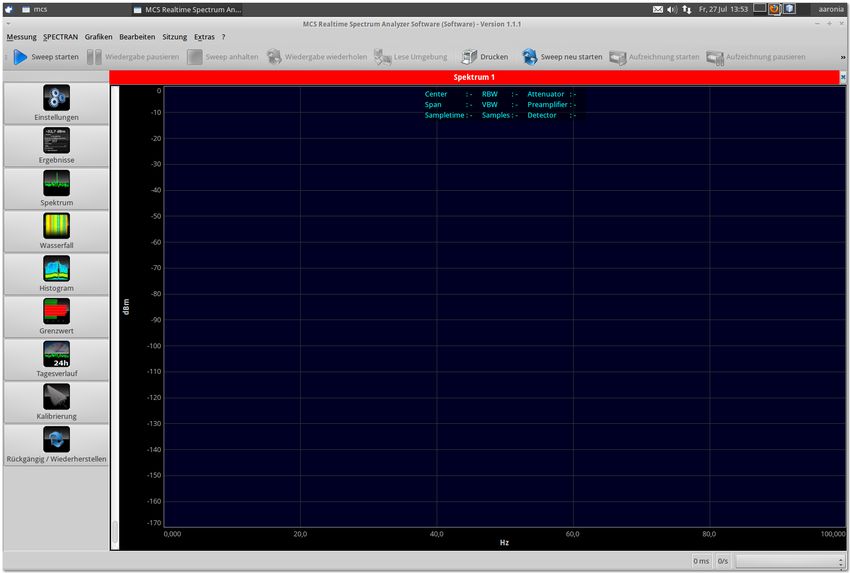
• You get losts of files (depends on settings)Stand-alone Installation with MCS Software It is also possible to use the SPECTRAN RSA as a standalone solution like a normal desktop pc if you haven't bought the EMF - Monitor software. You have to connect all external peripherals like monitor, mouse, keyboard, etc. After the system boot, you'll see a Linux desktop environment. On the button in the upper left corner you can open the programm menu. In the categorie "Aaronia" you find the shortcut to the MCS software. Left-click to the shortcut "MCS Spectrum Analyzer" and the software will open after few seconds.
Now you can start measuring with your new spectrum analyzer. A detailed documentation about our MCS
software you can find on our developer website spectran-developer.net
You can also read