BEYONDINSIGHT ANALYTICS & REPORTING 21.1 - BEYONDTRUST
←
→
Page content transcription
If your browser does not render page correctly, please read the page content below
BeyondInsight
                                           Analytics & Reporting 21.1

©2003-2021 BeyondTrust Corporation. All Rights Reserved. Other trademarks identified on this page are owned by their respective owners. BeyondTrust is not a chartered bank or trust company, or   TC:7/8/2021
depository institution. It is not authorized to accept deposits or trust accounts and is not licensed or regulated by any state or federal banking authority.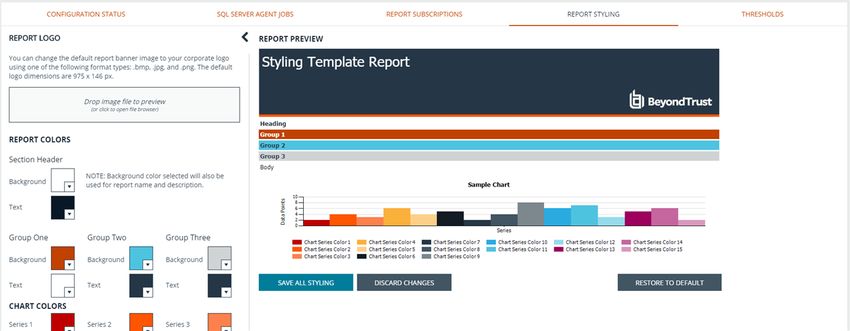
BEYONDINSIGHT
                                                                                                                                                                    ANALYTICS & REPORTING 21.1

                                 Table of Contents

                                      BeyondInsight Analytics & Reporting                                                                                                          3
                                          Run Reports in BeyondInsight                                                                                                             4
                                              Save a Snapshot                                                                                                                      6

                                          Manage Subscriptions in BeyondInsight                                                                                                    7
                                              Create a Subscription                                                                                                                7
                                              View, Edit, and Delete Subscriptions                                                                                                 8
                                              Override the Owner of a Subscription                                                                                                 9
                                          Work with Pivot Grids in BeyondInsight                                                                                                 11
                                              Create a Pivot Grid                                                                                                                11
                                              Save Pivot Grid Views                                                                                                              12
                                              Save Data to a File                                                                                                                13
                                              Import the JSON File                                                                                                               14
                                              Display Data as a Chart                                                                                                            14
                                              Create a Custom Report                                                                                                             14
                                              Example Measures in the Vulnerabilities Cube                                                                                       15
                                          Configure BeyondInsight Analytics & Reporting                                                                                          17
                                              Configure Report Styles                                                                                                            17
                                              SQL Server Agent Jobs                                                                                                              17
                                              Configure Clarity Analytics                                                                                                        18

                                          Connect Excel to the SQL Analysis Cube in BeyondInsight                                                                                20
                                          Integrate BeyondInsight and Microsoft SharePoint                                                                                       21
                                              Email Integration to SharePoint                                                                                                    21
                                              UNC Share Integration to SharePoint                                                                                                21

SALES: www.beyondtrust.com/contact             SUPPORT: www.beyondtrust.com/support                 DOCUMENTATION: www.beyondtrust.com/docs                                                                  2
©2003-2021 BeyondTrust Corporation. All Rights Reserved. Other trademarks identified on this page are owned by their respective owners. BeyondTrust is not a chartered bank or trust company, or   TC: 7/8/2021
depository institution. It is not authorized to accept deposits or trust accounts and is not licensed or regulated by any state or federal banking authority.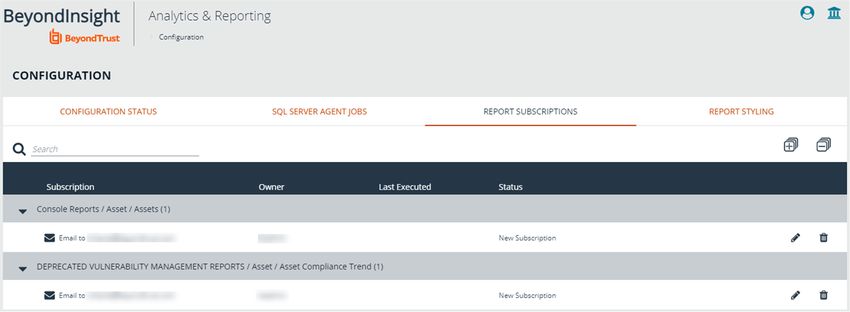
BEYONDINSIGHT
                                                                                                                                                                    ANALYTICS & REPORTING 21.1

      BeyondInsight Analytics & Reporting
      BeyondInsight contains a data warehouse solution with business intelligence and analytics. This module extracts data from the
      BeyondInsight database and then processes the data in Microsoft SQL Server Integration and Analysis Services. You can browse these
      cubes in BeyondInsight, Microsoft SQL Server Management Studio, or using tools such as Microsoft Excel.
      Using BeyondInsight, you can:

             l   Run reports on your assets, Password Safe, Endpoint Privilege Management, or data from the BeyondInsight management
                 console.
             l   Subscribe to reports on a schedule for automatic delivery to a network file share or through email.
             l   Save report views to easily reuse a report with predefined parameters.
             l   Create report snapshots to save static views of report data.
             l   Interactively explore data and create and save custom reports with a Pivot Grid.
             l   Find and examine audits using the Audit Viewer.

      Report Categories

             l   Account
             l   Asset
             l   Attack
             l   Clarity
             l   Configuration
             l   Console Reports
             l   Endpoint Privilege Management
             l   Licensing
             l   Organizational
             l   Password Safe
             l   PowerBroker Identity Services
             l   PowerBroker for Sudo
             l   PowerBroker for Unix & Linux
             l   Saved Report Views
             l   Scan

                   Note: Vulnerability Management has been deprecated. Some report categories are visible only if certain product licenses are
                   present or if certain permissions have been set in the management console. Administrators can view all reports.

SALES: www.beyondtrust.com/contact             SUPPORT: www.beyondtrust.com/support                 DOCUMENTATION: www.beyondtrust.com/docs                                                                  3
©2003-2021 BeyondTrust Corporation. All Rights Reserved. Other trademarks identified on this page are owned by their respective owners. BeyondTrust is not a chartered bank or trust company, or   TC: 7/8/2021
depository institution. It is not authorized to accept deposits or trust accounts and is not licensed or regulated by any state or federal banking authority.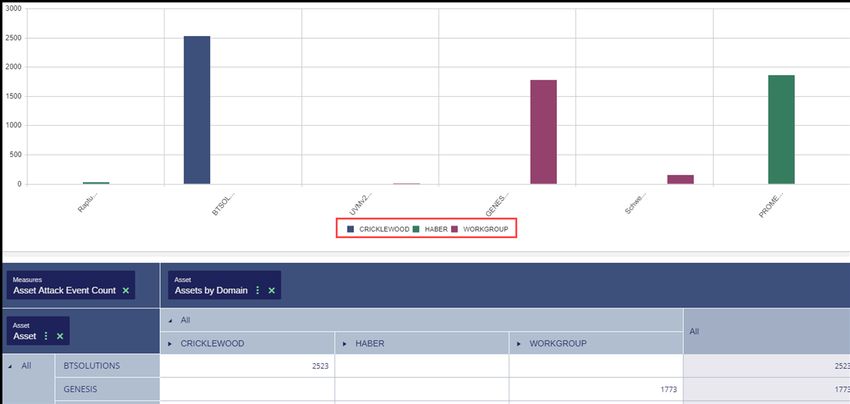
BEYONDINSIGHT
                                                                                                                                                                    ANALYTICS & REPORTING 21.1

      Run Reports in BeyondInsight

                   Tip: To view reports in BeyondInsight, you can use Internet Explorer or Edge, Safari, Firefox, or Chrome. Only Internet
                   Explorer enables you to print results directly. In other browsers, you must first create a PDF before printing.

                   Note: To make sure that all Analytics & Reporting features work properly, please set your browser's pop-up blocker to allow
                   pop-ups from your BeyondInsight management console.

                   Note: A drill-through action that opens a new report is limited to 10,000 rows of data by design.

                   Note: In order to run a report, users must have read access to Analytics & Reporting and Management Console Access
                   enabled.

      Log in to your BeyondInsight management console and click Analytics & Reporting.

            1. From the All Reports pane, locate a report using the report category folders, or search for a report using title or description
               keywords, and then select the desired report.

SALES: www.beyondtrust.com/contact             SUPPORT: www.beyondtrust.com/support                 DOCUMENTATION: www.beyondtrust.com/docs                                                                  4
©2003-2021 BeyondTrust Corporation. All Rights Reserved. Other trademarks identified on this page are owned by their respective owners. BeyondTrust is not a chartered bank or trust company, or   TC: 7/8/2021
depository institution. It is not authorized to accept deposits or trust accounts and is not licensed or regulated by any state or federal banking authority.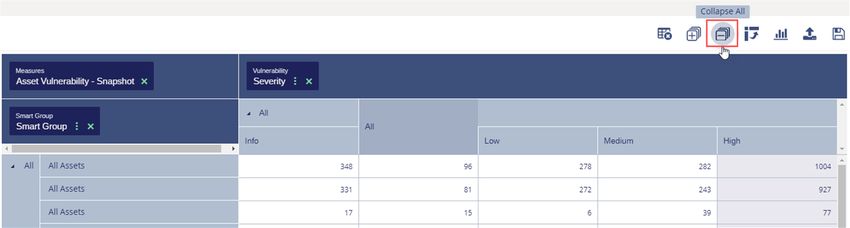
BEYONDINSIGHT
                                                                                                                                                                    ANALYTICS & REPORTING 21.1

            2. From the Configure Report pane:
                        l   Select the report parameters or leave them as default.
                        l   Click View Report.

                   Tip: After viewing the report, you can create a subscription to it by clicking the envelope button. For more information, please
                   see "Manage Subscriptions in BeyondInsight" on page 7.

      Save a Report View

      If you generate a certain report frequently and use the same parameters, you can save those parameters in a Saved Report View.

            1. Select the report.
            2. Select the report parameters.
            3. Click the Save View button.
            4. Enter a name and description for the report view, select an Organization from
               the list, and then click Save Report View. The name must be unique.
            5. This view is now located in the Saved Views panel on the Configure Report pane when you select a report and in the Saved

SALES: www.beyondtrust.com/contact             SUPPORT: www.beyondtrust.com/support                 DOCUMENTATION: www.beyondtrust.com/docs                                                                  5
©2003-2021 BeyondTrust Corporation. All Rights Reserved. Other trademarks identified on this page are owned by their respective owners. BeyondTrust is not a chartered bank or trust company, or   TC: 7/8/2021
depository institution. It is not authorized to accept deposits or trust accounts and is not licensed or regulated by any state or federal banking authority.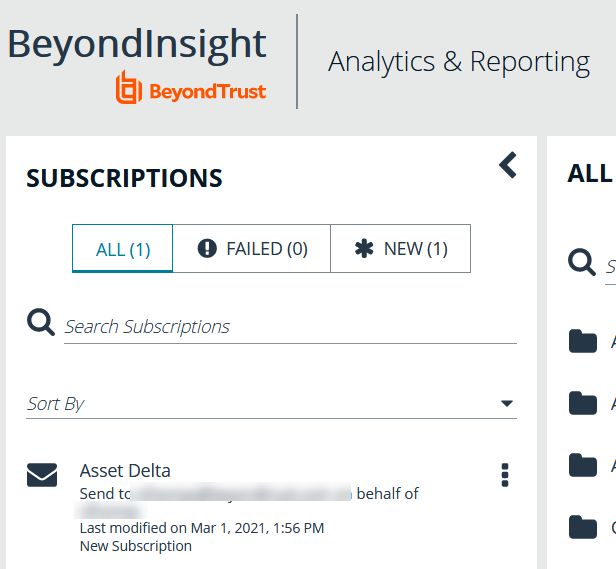
BEYONDINSIGHT
                                                                                                                                                                    ANALYTICS & REPORTING 21.1

                 Report Views folder on the All Reports page.
            6. When you select the saved view, the report loads automatically with the saved parameters.

      Save a Snapshot
      When you generate a report from a saved view, you can save the data in a snapshot. A snapshot is the saved report and results as they
      were when the snapshot was created. Time and date information is displayed with the snapshot.

            1. Open a saved view either from the Saved Views panel on the
               Configure Report pane in a report or from the Saved Report
               Views folder under All Reports.
            2. Once the report is displayed, click the Save Snapshot button.

            3. From the saved report view, you can view the snapshots from the
               left panel.

SALES: www.beyondtrust.com/contact             SUPPORT: www.beyondtrust.com/support                 DOCUMENTATION: www.beyondtrust.com/docs                                                                  6
©2003-2021 BeyondTrust Corporation. All Rights Reserved. Other trademarks identified on this page are owned by their respective owners. BeyondTrust is not a chartered bank or trust company, or   TC: 7/8/2021
depository institution. It is not authorized to accept deposits or trust accounts and is not licensed or regulated by any state or federal banking authority.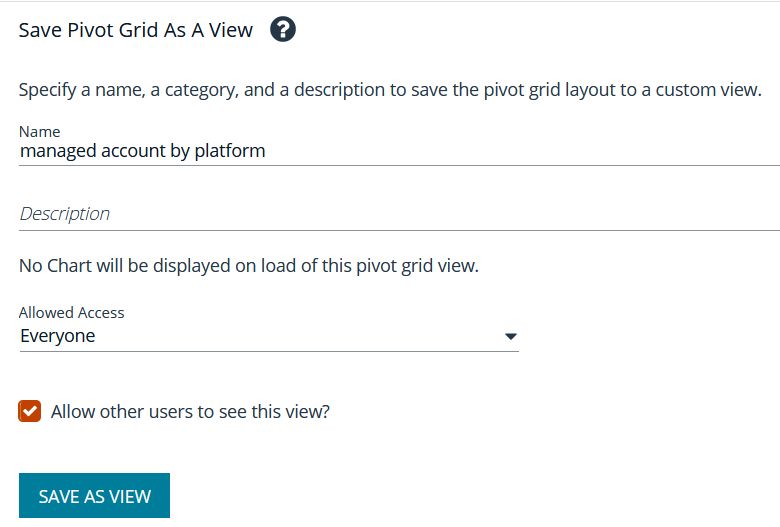
BEYONDINSIGHT
                                                                                                                                                                    ANALYTICS & REPORTING 21.1

      Manage Subscriptions in BeyondInsight
      In addition to running reports on demand, you can set up a subscription to the report. With a subscription, you can set a schedule to run a
      report and deliver the report output in an email or to a shared folder.

                   Note: SQL Server Reporting Services (SSRS) must be configured for email delivery. Use the Reporting Services
                   Configuration tool to configure the SMTP server or gateway and verify that the Report Server Windows service account user
                   is granted the Send As right.

      Create a Subscription
      After generating a new report or accessing a saved report view, you can subscribe to the report.

            1. From the BeyondInsight homepage, click Analytics & Reporting.
            2. Under All Reports, select the folder that contains the report you want to
               subscribe to.
            3. Select the report parameters and click View Report, or click the saved report
               view.
            4. Once the report displays, click the Subscribe to Report button.
            5. Select a delivery method:
                        l   Deliver the report through email: After selecting this option, click Next and enter the email addresses to send the report
                            to, along with an email subject.
                        l   Deliver the report to a shared folder: After selecting this option, click Next to enter the network information for the
                            share, network credentials, report file format, and file overwrite options.

                   Note: This email option is not available if SMTP is not configured in the Reporting Services Configuration Manager.

            6. Click Next.
            7. Select scheduling information.
            8. Click Subscribe to Report, and then click Close Wizard.

                   Note: If you have chosen to deliver the report output to a network share and the SSRS host server resides outside the domain,
                   you must install a reporting services delivery extension file.

SALES: www.beyondtrust.com/contact             SUPPORT: www.beyondtrust.com/support                 DOCUMENTATION: www.beyondtrust.com/docs                                                                  7
©2003-2021 BeyondTrust Corporation. All Rights Reserved. Other trademarks identified on this page are owned by their respective owners. BeyondTrust is not a chartered bank or trust company, or   TC: 7/8/2021
depository institution. It is not authorized to accept deposits or trust accounts and is not licensed or regulated by any state or federal banking authority.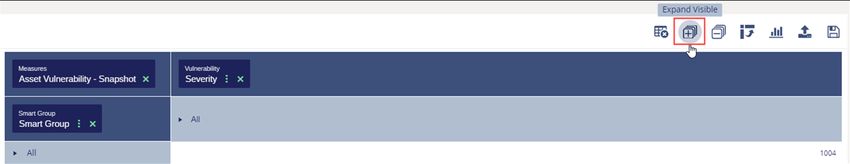
BEYONDINSIGHT
                                                                                                                                                                    ANALYTICS & REPORTING 21.1

                         1. Install the following MSI file on the server hosting the SSRS server:
                              C:\Program Files (x86)\eEye Digital Security\Retina CS\Support\BeyondInsight-
                              ReportingServicesExtensionsSetup.msi

                         2. Configure Analytics & Reporting with the SSRS server that is hosted on a server that is not a member of the domain.
                         3. Create a subscription that writes to a domain network share using domain credentials. The subscription will be saved
                            to the network share.

      View, Edit, and Delete Subscriptions
      You can view, edit, and delete subscriptions from the Analytics & Reporting page, from the Configuration page, or from the report
      where the subscription was created. Only subscription owners and administrators can edit or delete a subscription.

      From the Analytics & Reporting Page

            1. From the BeyondInsight homepage, click Analytics & Reporting.
            2. Click Subscriptions.
            3. By default, all subscriptions are listed in the Subscriptions pane.
               Click Failed or New to filter the subscriptions.

            4. To edit a subscription:
                        l   Select the subscription, and then click the vertical ellipsis button for the subscription.
                        l   Select Edit Options. The same wizard is displayed as when you create a subscription.
                        l   Change the settings as needed, and then click Finish to complete wizard.
            5. To delete a subscription:
                        l   Select the subscription, and then click the vertical ellipsis button for the subscription.
                        l   Select Delete.
                        l   Click Delete on the confirmation message.

SALES: www.beyondtrust.com/contact             SUPPORT: www.beyondtrust.com/support                 DOCUMENTATION: www.beyondtrust.com/docs                                                                  8
©2003-2021 BeyondTrust Corporation. All Rights Reserved. Other trademarks identified on this page are owned by their respective owners. BeyondTrust is not a chartered bank or trust company, or   TC: 7/8/2021
depository institution. It is not authorized to accept deposits or trust accounts and is not licensed or regulated by any state or federal banking authority.
BEYONDINSIGHT
ANALYTICS & REPORTING 21.1
From the Configuration Page
1. From the BeyondInsight homepage, click Configuration.
2. Under Analytics & Reporting, click Configuration.
3. Enter the administrative username and password to log into the Analytics & Reporting Configuration pages.
4. Click Report Subscriptions.
5. To edit a subscription:
l Click the report name or saved report view to expand its
subscriptions.
l On the subscription, click the Edit button. The same wizard
is displayed as when you create a subscription.
l Change the settings as needed, and then click Save Changes.
6. To delete a subscription, click the Delete button for the subscription.
From a Report or Saved Report View
1. Open Analytics & Reporting.
2. Select the folder where the report is located or select the Saved Report Views folder.
3. Select the report or saved report view.
4. Click Subscriptions in the left pane.
5. By default, all subscriptions are listed. Click Failed or New to filter the subscriptions.
6. To edit a subscription:
l Select the subscription, and then click Edit Options. The same wizard is displayed as when you create a subscription.
l Change the settings as needed, and then click Save Changes to complete wizard.
7. To delete a subscription:
l Select the subscription, and then click the Delete button.
l Click Delete on the confirmation message.
Note: Endpoint Protection reports have been removed. Any subscriptions to these reports cannot be used, and should be
deleted.
Override the Owner of a Subscription
You might need to override a subscription owner if the creator no longer has a BeyondInsight account, as subscriptions tied to non-
existent users will fail. You can change the owner of a subscription only if you are a BeyondInsight administrator.
SALES: www.beyondtrust.com/contact SUPPORT: www.beyondtrust.com/support DOCUMENTATION: www.beyondtrust.com/docs 9
©2003-2021 BeyondTrust Corporation. All Rights Reserved. Other trademarks identified on this page are owned by their respective owners. BeyondTrust is not a chartered bank or trust company, or TC: 7/8/2021
depository institution. It is not authorized to accept deposits or trust accounts and is not licensed or regulated by any state or federal banking authority.BEYONDINSIGHT
ANALYTICS & REPORTING 21.1
1. Edit the subscription you wish to take ownership of.
2. An Override check box displays on the first page of the subscription
wizard if the administrator is not currently the owner. Check this box
to set your user account as the owner of the subscription.
SALES: www.beyondtrust.com/contact SUPPORT: www.beyondtrust.com/support DOCUMENTATION: www.beyondtrust.com/docs 10
©2003-2021 BeyondTrust Corporation. All Rights Reserved. Other trademarks identified on this page are owned by their respective owners. BeyondTrust is not a chartered bank or trust company, or TC: 7/8/2021
depository institution. It is not authorized to accept deposits or trust accounts and is not licensed or regulated by any state or federal banking authority.BEYONDINSIGHT
ANALYTICS & REPORTING 21.1
Work with Pivot Grids in BeyondInsight
Using pivot grids, you can interact with multidimensional data from the BeyondInsight cube and can create custom views of the data. Pivot
grids use standard analytical cube features:
l Measures: Provide the calculated data values that you want to view.
l Dimensions: Provide the filters, groups, and labels for the view.
Create a Pivot Grid
Using the measures and dimensions provided, you can build comprehensive pivot grid views to analyze your data.
1. From the left menu in the BeyondInsight console, click Menu.
2. Under Analytics & Reporting, click Pivot Grid.
3. In the Configure panel under Filters, select a View, a Cube, and a Measure Group.
You can perform a keyword search to find measures and attributes that contain specific
words.
4. Drag and drop measures and dimensions on indicated drop zones: Measure Fields,
Column Fields, and Row Fields.
5. Drag and drop multiple dimensions to enable more options that you can drill down
through.
SALES: www.beyondtrust.com/contact SUPPORT: www.beyondtrust.com/support DOCUMENTATION: www.beyondtrust.com/docs 11
©2003-2021 BeyondTrust Corporation. All Rights Reserved. Other trademarks identified on this page are owned by their respective owners. BeyondTrust is not a chartered bank or trust company, or TC: 7/8/2021
depository institution. It is not authorized to accept deposits or trust accounts and is not licensed or regulated by any state or federal banking authority.BEYONDINSIGHT
ANALYTICS & REPORTING 21.1
6. The available information populates the grid once the fields are
selected. Use the Expand Visible and Collapse All buttons in the
toolbar to show or hide all available data.
7. To completely clear the pivot grid and start over, click Clear Pivot
Grid in the toolbar.
8. To pivot your data in the grid, click Pivot in the toolbar. This flips the
rows to columns and the columns to rows.
Save Pivot Grid Views
Once you have created a pivot grid, you can save your selected filters, measures, and dimensions as a view for later use.
1. In the pivot grid toolbar, click Save, and then select Save as View.
2. Enter a Name and Description.
3. Select the appropriate group for Allowed Access.
4. Choose if other BeyondInsight users can see the saved pivot grid.
5. Click Save As View.
SALES: www.beyondtrust.com/contact SUPPORT: www.beyondtrust.com/support DOCUMENTATION: www.beyondtrust.com/docs 12
©2003-2021 BeyondTrust Corporation. All Rights Reserved. Other trademarks identified on this page are owned by their respective owners. BeyondTrust is not a chartered bank or trust company, or TC: 7/8/2021
depository institution. It is not authorized to accept deposits or trust accounts and is not licensed or regulated by any state or federal banking authority.BEYONDINSIGHT
ANALYTICS & REPORTING 21.1
6. Your saved view is now listed under Saved Views in the left panel.
You can also search to find views that contain the keyword.
7. Select the saved view, and then click Display Saved View to see
the most current information for that pivot grid. The data is retrieved
from the cube each time you select the saved view.
8. To delete the saved view, click the Delete button.
Note: You can collapse and expand the Filters section of the
Configure panel using the arrow. Each time you open a saved
view, the Filters section is either closed or open, depending on its
state when it was saved.
Save Data to a File
You can save the pivot grid data in JSON format and reload the data at a later time.
1. In the toolbar, click Save, and then select Save as JSON.
2. The file automatically saves to your default download location.
SALES: www.beyondtrust.com/contact SUPPORT: www.beyondtrust.com/support DOCUMENTATION: www.beyondtrust.com/docs 13
©2003-2021 BeyondTrust Corporation. All Rights Reserved. Other trademarks identified on this page are owned by their respective owners. BeyondTrust is not a chartered bank or trust company, or TC: 7/8/2021
depository institution. It is not authorized to accept deposits or trust accounts and is not licensed or regulated by any state or federal banking authority.BEYONDINSIGHT
ANALYTICS & REPORTING 21.1
Import the JSON File
1. In the toolbar, click Import.
2. Locate the JSON file from the download location and drag the file
into the drop box. Alternatively, click in the drop box to open a file
browser to navigate to the JSON file to upload it.
3. Click Apply to Pivot Grid.
Display Data as a Chart
Once you have created a pivot grid, you can display the data as a chart.
1. To display the data as a chart, click Display Charts in the toolbar,
and then select a chart type from the menu. The following chart
types are available:
l Area
l Category
l Line
l Spline
l Spline Area
l Step Area
l Step Line
l Waterfall
2. The chart displays above the grid, showing data that is currently expanded in the pivot grid.
3. Chart series data can be enabled or disabled by clicking the
corresponding data in the legend.
Note: If you save a pivot grid as a view while a chart is displayed,
the chart will be displayed each time the saved view is loaded.
4. In the toolbar, click Save, and then select either Save Chart as PDF, Save Chart as PNG, or Save Chart as SVG.
5. The file automatically saves to your default download location.
Create a Custom Report
Once you have created a pivot grid, you can create a report based on the fields selected in the grid.
SALES: www.beyondtrust.com/contact SUPPORT: www.beyondtrust.com/support DOCUMENTATION: www.beyondtrust.com/docs 14
©2003-2021 BeyondTrust Corporation. All Rights Reserved. Other trademarks identified on this page are owned by their respective owners. BeyondTrust is not a chartered bank or trust company, or TC: 7/8/2021
depository institution. It is not authorized to accept deposits or trust accounts and is not licensed or regulated by any state or federal banking authority.BEYONDINSIGHT
ANALYTICS & REPORTING 21.1
1. In the pivot grid toolbar, click Save, and then select Save as Report.
2. Enter a Name and Description.
3. Select the appropriate group for Allowed Access.
4. Optionally, select a Category.
5. Click Publish as Report.
6. Your report is saved in the Custom folder on the All Reports page.
Example Measures in the Vulnerabilities Cube
You can use the following table as a guide for commonly used measures in the Vulnerabilities cube.
To filter on… Select this measure…
Inventory (rolling count) of discovered assets Measures > Asset Discovery - Snapshot
Inventory (rolling count) of open ports on assets. Can be used to find which
Measures > Asset Port - Snapshot
ports are open on which machines
Inventory (rolling count) of services on assets Measures > Asset Service - Snapshot
Inventory (rolling count) or shares on assets Measures > Asset Share - Snapshot
Inventory (rolling count) of software on assets Measures > Asset Software - Snapshot
Inventory (rolling count) of local user accounts on assets Measures > Asset User Account - Snapshot
Usage Scenarios
To see the count of vulnerabilities by severity:
l In Measure Fields, place Measures > Asset Vulnerability -
Snapshot.
l In Row Fields, place Dimensions > Vulnerability > Severity.
To see the count of vulnerabilities by severity, and if there is an exploit
toolkit:
l In Measure Fields, place Measures > Asset Vulnerability -
Snapshot.
l In Row Fields, place Dimensions > Vulnerability > Severity.
l In Column Fields, place Dimensions > Vulnerability > Has Exploit Toolkit.
To see the count of high vulnerabilities by smart group:
l In Measure Fields, place Measures > Asset Vulnerability - Snapshot.
l In Row Fields, place Dimensions > Smart Group > Smart Group.
SALES: www.beyondtrust.com/contact SUPPORT: www.beyondtrust.com/support DOCUMENTATION: www.beyondtrust.com/docs 15
©2003-2021 BeyondTrust Corporation. All Rights Reserved. Other trademarks identified on this page are owned by their respective owners. BeyondTrust is not a chartered bank or trust company, or TC: 7/8/2021
depository institution. It is not authorized to accept deposits or trust accounts and is not licensed or regulated by any state or federal banking authority.BEYONDINSIGHT
ANALYTICS & REPORTING 21.1
l In Column Fields, place Dimensions > Vulnerability > Severity.
o Click the More Options button to display the menu.
o Select Filter Fields.
o Select is equal to.
o Enter high as the value, and then click Filter Values.
SALES: www.beyondtrust.com/contact SUPPORT: www.beyondtrust.com/support DOCUMENTATION: www.beyondtrust.com/docs 16
©2003-2021 BeyondTrust Corporation. All Rights Reserved. Other trademarks identified on this page are owned by their respective owners. BeyondTrust is not a chartered bank or trust company, or TC: 7/8/2021
depository institution. It is not authorized to accept deposits or trust accounts and is not licensed or regulated by any state or federal banking authority.BEYONDINSIGHT
ANALYTICS & REPORTING 21.1
Configure BeyondInsight Analytics & Reporting
Configure Report Styles
You can customize the colors of the report, including chart colors, header and description components, and horizontal bar components.
You can change the default image to your corporate logo, with a file type of PNG, JPEG, or BMP. The default size is 975 x 146 pixels.
1. In the console, click Configuration.
2. Under Analytics & Reporting, click Configuration.
3. Enter administrative credentials.
4. Click Report Styling.
5. To change the report banner logo, drop an image on the box in the
Report Logo section. You can also click inside the box to browse to
your image.
6. To change Report Colors or Chart Colors, click the square you want to change, select the new color, and then click the square
again.
7. You can click Discard Changes to reverse the most recent change.
8. Once satisfied with your color and logo changes, click Save All Styling.
9. To reset all changes to the default, click Restore to Default, then click Reset.
SQL Server Agent Jobs
BeyondInsight uses a SQL Server agent job to retrieve data from sources and process the data into the analysis cube.
1. In the console, click Configuration.
2. Under Analytics & Reporting, click Configuration.
3. Enter administrative credentials.
4. Click SQL Server Agent Jobs.
5. Select a job type from the left navigation: Process Daily, Process Full, or Process Full (OLAP only).
Note: During normal operation, you do not need to manually start the Process Daily job. The job is designed to run
automatically each day during off-peak hours. However, the job can be started from SQL Agent Jobs > Analytics &
Reporting.
Note: For SQL Analysis Services, the Server mode must be set to Multidimensional. Please refer to Microsoft
documentation on how to set or change the SSAS mode.
IMPORTANT!
Running a Process Full job erases all historical data and refreshes the Analytics & Reporting database with only active data from the
management console. This job should not be run under normal circumstances.
SALES: www.beyondtrust.com/contact SUPPORT: www.beyondtrust.com/support DOCUMENTATION: www.beyondtrust.com/docs 17
©2003-2021 BeyondTrust Corporation. All Rights Reserved. Other trademarks identified on this page are owned by their respective owners. BeyondTrust is not a chartered bank or trust company, or TC: 7/8/2021
depository institution. It is not authorized to accept deposits or trust accounts and is not licensed or regulated by any state or federal banking authority.BEYONDINSIGHT
ANALYTICS & REPORTING 21.1
6. Review the status showing the result of the last run. Expand a job to show the job history and diagnose issues that may prevent the
job from running.
7. Click Download logs to save diagnostic information and job history details in a zip file.
8. Click Refresh to update the view.
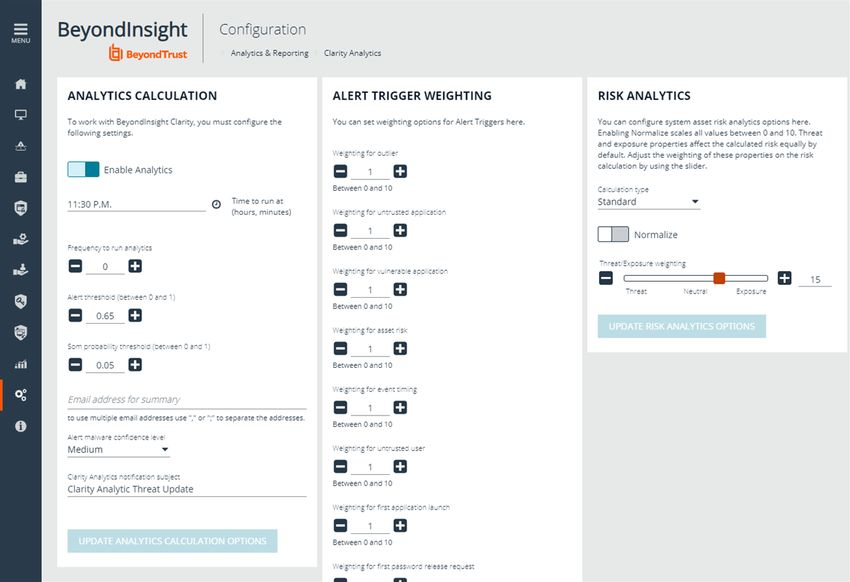
Configure Clarity Analytics
To work with BeyondInsight Clarity, you must configure settings in the BeyondInsight management console.
Configure the Analytics Calculation
1. In the console, click Configuration.
2. Under Analytics & Reporting, click Clarity Analytics.
3. From the Analytics Calculation section, you can:
l Toggle Enable Analytics to turn on the feature.
l Select the hours and minutes for Time to run at.
l Select the frequency for running analysis.
l Set the Alert Threshold for flagging explicit alerts. The higher the value, the higher the sensitivity and the fewer flagged
alerts. The range is from 0 to 1. The default value is 0.65.
l Set the Som Probablity Threshold for flagging pattern alerts. The lower the value, the higher the sensitivity and the fewer
flagged alerts. The range is from 0 to 1. The default value is 0.05.
l Enter an email address to send notifications to.
l Select an Alert malware confidence level to filter on the higher potential malware risks presented in the analytics data.
The default value is Medium.
l Set the notification subject.
4. Click Update Analytics Calculation Options.
Set Alert Trigger Weighing
From the Alert Trigger Weighing section, you can configure Clarity to
prioritize or weigh specific alerts. If an alert with a higher weight is triggered,
the alert appears more prominently in the Clarity analysis. This allows you
to quickly see and react to critical alerts.
To configure a weight for an alert, click on the up and down arrows to
modify its numeric value, ranging from 0 to 10. When you are satified with
your selections, click Update Alert Triggering Weighing Options to
finalize.
Configure Risk Analytics
From the Risk Analytics section, you can configure risk analytic options for
your system assets.
1. Select the Calculation type from the dropdown.
2. If you like, enable the Nomalize setting.
SALES: www.beyondtrust.com/contact SUPPORT: www.beyondtrust.com/support DOCUMENTATION: www.beyondtrust.com/docs 18
©2003-2021 BeyondTrust Corporation. All Rights Reserved. Other trademarks identified on this page are owned by their respective owners. BeyondTrust is not a chartered bank or trust company, or TC: 7/8/2021
depository institution. It is not authorized to accept deposits or trust accounts and is not licensed or regulated by any state or federal banking authority.BEYONDINSIGHT
ANALYTICS & REPORTING 21.1
Note: Enabling the Normalize setting scales all values from 0 to 10.
3. Slide the scale to indicate how much Threat and Exposure are weighed in the risk calculation.
Note: By default, threat and exposure are configured to be Neutral, which means both properties equally affect the risk
calculation.
SALES: www.beyondtrust.com/contact SUPPORT: www.beyondtrust.com/support DOCUMENTATION: www.beyondtrust.com/docs 19
©2003-2021 BeyondTrust Corporation. All Rights Reserved. Other trademarks identified on this page are owned by their respective owners. BeyondTrust is not a chartered bank or trust company, or TC: 7/8/2021
depository institution. It is not authorized to accept deposits or trust accounts and is not licensed or regulated by any state or federal banking authority.BEYONDINSIGHT
ANALYTICS & REPORTING 21.1
Connect Excel to the SQL Analysis Cube in BeyondInsight
You can connect Microsoft Excel to your BeyondInsight SQL Analysis Services cube to create custom data views, build custom reports,
use Excel filtering and graphing features, and use formulas to calculate custom metrics.
On the server hosting the SQL Analysis Services cube:
1. Create a local user account with the same username and password as their domain account.
2. Start SQL Management Studio, and connect to Analysis Services.
3. Right-click the server name in the tree and select Properties.
4. Click the Security tab.
5. Add the new local user created in the first step.
On the computer where Excel is installed:
1. Start Excel.
2. Select the Data tab.
3. Select Get Data > From Other Sources > From Analysis Services.
4. Enter the server name or IP address, making sure Use Windows Authentication is selected.
5. Select the Vulnerabilities cube.
6. Keep the default values for the remaining pages of the wizard, and then click Finish.
7. On the Import Data dialog, select to create a pivot table or a pivot chart and pivot table.
8. Click OK.
9. From the Show fields related to list, select Asset Vulnerability.
You can now build reports in Excel based on asset and vulnerability data.
SALES: www.beyondtrust.com/contact SUPPORT: www.beyondtrust.com/support DOCUMENTATION: www.beyondtrust.com/docs 20
©2003-2021 BeyondTrust Corporation. All Rights Reserved. Other trademarks identified on this page are owned by their respective owners. BeyondTrust is not a chartered bank or trust company, or TC: 7/8/2021
depository institution. It is not authorized to accept deposits or trust accounts and is not licensed or regulated by any state or federal banking authority.BEYONDINSIGHT
ANALYTICS & REPORTING 21.1
Integrate BeyondInsight and Microsoft SharePoint
Using BeyondInsight subscriptions, you can directly integrate into SharePoint either by emailing reports to a SharePoint SMTP mail
daemon or by publishing the reports to a Universal Naming Convention (UNC) share for directory-based and file-based publishing.
Begin by creating a new subscription or editing an existing subscription. Continue by choosing an email integration or a UNC share
integration.
For more information, please see "Manage Subscriptions in BeyondInsight" on page 7.
Email Integration to SharePoint
You can enable the receipt of SMTP email through SharePoint and set the appropriate permissions to receive .eml content. To avoid
internal spam and misuse, use only security settings that permit postings from BeyondInsight or other security tools.
1. For the subscription delivery method, select Deliver the report
through email.
2. Click Next.
3. In the delivery options, enter information including the SharePoint
email address.
4. Click Next.
5. Select the recurring schedule for the report, and complete the
setup.
6. The subscription generates a new report and emails it to SharePoint
for publication.
UNC Share Integration to SharePoint
By default, you can access SharePoint document libraries through a UNC share, assuming the system is properly set up. An important
consideration for shares is their visibility. For an additional layer of security, you may want to create shares to be hidden by suffixing the
share name with a $.
For more information, please see Connecting Web Sites to UNC Network Shares at https://docs.microsoft.com/en-
us/previous-versions/tn-archive/cc768023(v=technet.10).
SALES: www.beyondtrust.com/contact SUPPORT: www.beyondtrust.com/support DOCUMENTATION: www.beyondtrust.com/docs 21
©2003-2021 BeyondTrust Corporation. All Rights Reserved. Other trademarks identified on this page are owned by their respective owners. BeyondTrust is not a chartered bank or trust company, or TC: 7/8/2021
depository institution. It is not authorized to accept deposits or trust accounts and is not licensed or regulated by any state or federal banking authority.BEYONDINSIGHT
ANALYTICS & REPORTING 21.1
1. For the subscription delivery method, select Deliver the report to a
shared folder.
2. Click Next.
3. In the delivery options, enter information including the report title,
UNC address, file format for the report, credentials, and overwrite
options.
4. Click Test Access to verify that files can be copied to the UNC
share with the given settings.
5. Click Next.
6. Select the recurring schedule for the report, and complete the
setup.
7. The subscription automatically writes the report to SharePoint for publication.
SALES: www.beyondtrust.com/contact SUPPORT: www.beyondtrust.com/support DOCUMENTATION: www.beyondtrust.com/docs 22
©2003-2021 BeyondTrust Corporation. All Rights Reserved. Other trademarks identified on this page are owned by their respective owners. BeyondTrust is not a chartered bank or trust company, or TC: 7/8/2021
depository institution. It is not authorized to accept deposits or trust accounts and is not licensed or regulated by any state or federal banking authority.You can also read