Bård Bjølgerud The Nordic real estate market - Pangea Property Partners - FIRST fondene

Page created by Gene Clarke
 
CONTINUE READING
Bård Bjølgerud The Nordic real estate market - Pangea Property Partners - FIRST fondene
Pangea Property Partners
Bård Bjølgerud   The Nordic real estate market
CEO & Partner
                                    FIRST FONDENE, JANUARY 2020
Bård Bjølgerud The Nordic real estate market - Pangea Property Partners - FIRST fondene
TABLE OF CONTENT
                        Highlights
                                                                             Macroeconomic Overview
    Overall macroeconomic outlook arguing a strong real estate
    market in 2020 and onwards

    Slight drop in European transaction activity but new record year in     Nordic Transaction Market
    the Nordics (EUR 46bn, up 5 % from 2018)

    Continued strong inflow of foreign capital to the Nordics, driven by
    weak local currencies and plenty of “dry powder”                       Norwegian Transaction Market

    Strong listed Nordic property sector – Swedish listed property
    companies (1Y return: 57 %) and logistics (1Y return: 104 %)
    outperforming                                                            The Nordic Listed Sector

    Historically high premium to NAV – almost 40% above EPRA NAV
    on average (based on Q3-19)

                                                                                Property Segments
    A wave of sizeable takeovers and IPOs in the current market

    Downward pressure on retail property values, driven by negative
    rent expectations and large risk premiums

2
                                                                                     Market presentation   Pangea Property Partners
Bård Bjølgerud The Nordic real estate market - Pangea Property Partners - FIRST fondene
Pangea in 20 seconds

                                                                  NO. 1 IN 7 CATEGORIES

    +450
        projects
            in the Nordics 2010–2019

                                                                                                                              HELSINKI
                                                                                                   OSLO

      +10 years
                              +330bn
                                                            SEK
                                                                                                                         STOCK HOLM

                              total deal volume 2010–2019

                        SEK
              730m                                                                                     PANGEA OFFICES
              average deal-size      +35                                                               In Finland, Pangea collaborates with Mrec Oy
                                         dedicated employees
                                                                                          LONDON

3
                                                                                                   Market presentation    Pangea Property Partners
Bård Bjølgerud The Nordic real estate market - Pangea Property Partners - FIRST fondene
Pangea Research                     Full Nordic research coverage with a broad range of reports

              LEADING NORDIC PROPERTY RESEARCH
    Large Pan-Nordic research team closely following the Nordic region from a             Pangea Weekly            Pangea Monthly                  Pangea Outlooks
    property and capital market perspective

    A broad array of research reports that can be subscribed at our website for free
    (see examples to the right)

    Access to significant proprietary data, including listed sector coverage (Main list
    and First North) and our PREX index family

    Prestige clients such as e.g. the Swedish Riksbank, the Swedish Financial
    Authority, the International Monetary Fund, major property owners, etc.

    Brand new hotel research launched in August 2018, unique for the Nordic market
                                                                                          Pangea Listed Overview   Pangea Hotel Monthly            Special Reports

            SELECTED RESEARCH PARTNERS & CLIENTS

                                                                          SEPREF
                                                                                                                                    Sign up for free at pangeapartners.se/analys
4
                                                                                                                          Market presentation      Pangea Property Partners
Bård Bjølgerud The Nordic real estate market - Pangea Property Partners - FIRST fondene
Macroeconomic Overview

55
                              Market presentation   Pangea Property Partners
Bård Bjølgerud The Nordic real estate market - Pangea Property Partners - FIRST fondene
Market size                 The Nordics – one of the largest property markets in Europe

                                                                           Nordics
POPULATION                                     EU      Nordics   % of EU
                                                                           EU
                                                                           Other
Total 2019 (million)                           511       27        5%

5Y forecast (% p.a.)                          +0.1%     0.6%        -

ECONOMY

GDP 2019 (EURbn)                              16,447    1,408      9%

5Y forecast (% p.a.)                          1.6%      1.7%        -

PROPERTY MARKET

Trans. volume 2019 (EURbn)                     290       46       16%

Annual turnover (10Y)                         2.5%      4.7%        -

STOCK MARKET1)

Total market value (EURbn)                    12,370    1,540     12%

CRE market value (EURbn)                       444       73       14%

1) All developed markets in Europe (Sep-19)                                                                Source: Pangea Research, IMF, EPRA
6
                                                                                          Market presentation      Pangea Property Partners
Bård Bjølgerud The Nordic real estate market - Pangea Property Partners - FIRST fondene
Nordic Transaction Market

77
                                 Market presentation   Pangea Property Partners
Bård Bjølgerud The Nordic real estate market - Pangea Property Partners - FIRST fondene
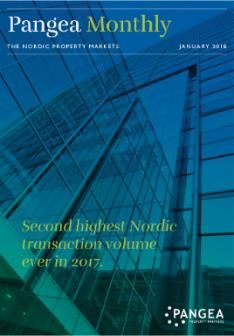
Transaction volumes               New Nordic record set in 2019 with a volume above EUR 45bn

    NORDIC TRANSACTION MARKET OVERVIEW (2019)                                NORDIC TRANSACTION VOLUMES (2007-2019)

                                                                     50

                                                                     45

    EUR 22.2bn                                                       40
    +46% from 2018
    400 deals
                                                                     35
    +5% from 2018

                                                                     30

                                                             EURbn
                                                                     25

    EUR 9.7bn
    +3% from 2018                             Finland                20
    258 deals
    -5% from 2018                                                    15
                      Norway

                                                                     10
                               Sweden

                                                                     5
    EUR 6.9bn        Denmark             EUR 6.6bn
    -24% from 2018                       -22% from 2018
                                                                     0
    174 deals                            215 deals
    +15% from 2018                       +19% from 2018                   2007 2008 2009 2010 2011 2012 2013 2014 2015 2016 2017 2018 2019

                                                                                   Sweden      Norway       Finland        Denmark
                                                                                                    Source: Pangea Research, based on deals above EUR 5m
8
                                                                                                     Market presentation      Pangea Property Partners
Bård Bjølgerud The Nordic real estate market - Pangea Property Partners - FIRST fondene
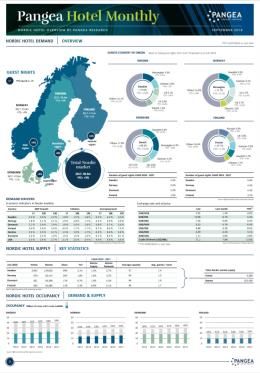
Foreign investors                    EUR 3.8bn of net foreign capital inflow to the Nordics

                    FOREIGN NET INVESTMENTS – SWEDEN                                                     FOREIGN NET INVESTMENTS – NORWAY

             30                                                                                    50
             20                                                                                    40
             10                                                                                    30

                                                                                          NOKbn
    SEKbn

              0                                                                                    20
             -10                                                                                   10
             -20                                                                                   0
             -30                                                                                  -10
                   2013   2014   2015     2016     2017     2018     2019                               2013   2014   2015     2016          2017       2018        2019

                    FOREIGN NET INVESTMENTS – FINLAND                                                   FOREIGN NET INVESTMENTS – DENMARK

              6                                                                                    25
              5                                                                                    20
              4                                                                                    15

                                                                                           DKKbn
     EURbn

              3                                                                                    10
              2                                                                                     5
              1                                                                                     0
              0                                                                                    -5
                   2013   2014   2015     2016     2017     2018     2019                               2013   2014   2015     2016          2017       2018        2019

                            Foreign acquisitions and divestments made up 34 % and 24 % respectively of the Nordic transaction volume in 2019

                                                                                                                      Source: Pangea Research, based on deals above EUR 5m
9
                                                                                                                       Market presentation          Pangea Property Partners
Bård Bjølgerud The Nordic real estate market - Pangea Property Partners - FIRST fondene
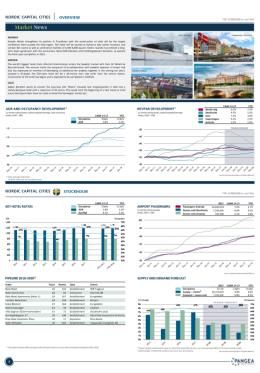
Top-10 deals 2019                     Cross-border deals made up 50% of the Nordic top-list last year

                                                       Buyer                                                                     Asset(s)              Est. value        Cross-
     #     Date       Buyer                                              Seller             Asset(s)
                                                      Country                                                                    Country                (LOCbn)          border

     1    Dec-19      SBB i Norden                                       Shareholders       Hemfosa                                                   SEK 39.8bn1

     2    Sep-19      Vonovia                                            Blackstone, etc.   Hembla                                                    SEK 33.5bn1           √
     3    Jun-19      Elo and Varma                                      Elo and Varma      Merger of Jumbo and Flamingo                               EUR 0.6bn

     4    Oct-19      Whitehelm Capital                                  Pioneer            Pioneer Public Properties                                 NOK 5.3bn             √
     5    Jan-19      Lilium                                             Castellum          Portfolio swap                                             SEK 5.2bn

     7    Apr-19      DNB Liv                                            SBB i Norden       DNB Bank’s HQ                                             NOK 4.5bn             √
     6    Sep-19      KPA                                                Areim              Trygg-Hansa HQ                                             SEK 4.3bn

     8    Dec-19      Nyfosa                                             Randviken          Mixed portfolio                                            SEK 4.2bn

     9    Jun-19      Blackstone                                         Corem              Logistics and warehouse portfolio                          SEK 4.2bn            √
     10   Feb-19      Allianz, CBRE                                      NRP                Logistics portfolio                                        SEK 4.0bn            √
                      Top 10 (23% of total transaction volume)                                                                                        EUR 10.6bn

 1) Underlying property value of entire company as per interim report Q3 2019                                                                                Source: Pangea Research
10
                                                                                                                                Market presentation       Pangea Property Partners
Norwegian Transaction Market

11
1
1
                               Market presentation   Pangea Property Partners
Norwegian transaction market                              Second highest volume ever of NOK 97bn

                    NORWEGIAN TRANSACTION VOLUME (2010-2019)                                           TRANSACTION VOLUME BY SECTOR (2019)
         140
                      Average: NOK 42bn                    Average: NOK 95bn

                                                                                                                               Other 9 %
         120                                                                                      Land/Development 13 %

         100
                                                                                                       Residential 5 %                 NOK                       Office 45 %

                                                                                                          Hotel 3 %                    97bn
                                                                                         10
         80
 NOKbn

                                                                                                  Logistics/Industry 8 %

         60                                         123                                                                  Retail 17 %

                                                                          94     97
                                                                   87
         40                                                                              80                                                    Volume             Foreign buyers
                                                                                                                      No. of deals
                                                            72                                                                                (NOKbn)                   (%)

                              51            54                                                  2019                        258                    97bn                 22 %
         20    43
                                     36
                                                                                                2018                        273                    94bn                 18 %
                       25
                                                                                                2017                        302                    87bn                 22 %
          0
               2010   2011   2012   2013   2014     2015    2016   2017   2018   2019   2020E
                                           Volume     Forecast
                                                                                                                            Source: Pangea Research, based on deals above EUR 5m
12
                                                                                                                             Market presentation          Pangea Property Partners
The Nordic Listed Sector

13
1
3
                                Market presentation   Pangea Property Partners
Long-term performance                                                      Annual average PREX property return (incl. dividend) of 17 % (2000-2020YTD)

                                                                                             LISTED PROPERTY SECTOR – NORDICS

                                  2400%
                                              Overview         PREX Property1)      OSEBX
                                              2000-2020 YTD       2,245 %           380 %                PREX Property 1)       OSEBX (Main index)

                                  2000%       CAGR (‘00-’20)        17 %                8%
 Total returns, incl. dividends

                                  1600%
                                                                                                                                                      +859%

                                  1200%

                                  800%

                                                                    +542%                                     -62%
                                  400%

                                    0%

                                                                       +171%                                     -64%                                 +389%
                                  -400%
                                       2000    2001    2002     2003    2004     2005    2006   2007   2008    2009   2010   2011   2012   2013      2014     2015      2016      2017      2018     2019      2020

                                                                                                                                                                                   Figures as of January 27th 2020
 1) Property index of Nordic property companies                                                                                                                        Source: Pangea Research, Thomson Reuters
14
                                                                                                                                                            Market presentation          Pangea Property Partners
Nordic real estate equity markets            PREX Sweden country winner and strong logistics rush

               NORDIC EQUITY MARKETS (LAST 3Y)                            NORDIC EQUITY SEGMENTS (LAST 3Y)

     130%                                                              300%
                                                     PREX Sweden                                                           PREX Logistics
                                         1Y         1Y return: 57 %                                           1Y           1Y return: 104 %
                                                    3Y return: 134 %                                                       3Y return: 278 %
     110%                                                              250%
                                                    PREX Property
                                                    1Y return: 54 %
                                                    3Y return: 118 %
      90%                                                              200%

      70%                                                              150%                                                  PREX Office
                                                     PREX Norway                                                           1Y return: 46 %
                                                     1Y return: 31 %                                                       3Y return: 118 %
                                                     3Y return: 56 %
      50%                                                              100%                                               PREX Residential
                                                      OMX Nordic                                                           1Y return: 56 %
                                                     1Y return: 29 %                                                      3Y return: 112 %
                                                     3Y return: 51 %
      30%                                                              50%                                                  PREX Retail
                                                                                                                           1Y return: 29 %
                                                                                                                           3Y return: 31 %
                                                                                                                                PREX
      10%                                                               0%                                                  Construction
                                                                                                                           1Y return: 38 %
                                                                                                                           3Y return: 14 %
     -10%                                                              -50%

 Figures as of January 27th 2020                                                                 Source: Pangea Research, Thomson Research
15
                                                                                        Market presentation     Pangea Property Partners
Nordic listed property market size   Total market cap of over NOK 780bn across the Nordics

                                               MARKET CAP BY COMPANY
                                                                                                                      M. Cap / 1Y change (%)
                  90                                                                                                     No. of companies
                                                               X = Recent listings (Last 12M)                 NOK ~643bn / +57 %
                  80
                                                                                                                         #26
                  70                                                                                          NOK ~63bn / +61 %
                                                                                                                         #3
                  60
                                                                                                              NOK ~54bn / +31 %
                  50                                                                                                     #3

                                                                                                              NOK ~22bn / +48 %
          NOKbn

                  40
                                                                                                                         #3
                  30
                                                                                                              NOK ~781bn / +54 %
                  20                                            X    X                                                   #35

                  10                                                                                         X    X                X

                  0

      Figures as of January 27th 2020                                                                    Source: Pangea Research, Thomson Research
16   16
                                                                                                Market presentation        Pangea Property Partners
Valuation                P / EPRA NAV increased by 34 % in the Nordics last year (P / EPRA NAV = 140 %)

          3.0x
                  X     X
                                        X = Recent listings (Last 12M)
          2.6x                                                           Weighted average
                                                                          P / EPRA NAV                                                            Norway
                                                                                                1.4x       0.8x           1.3x          1.6x            1.4x
          2.2x

          1.8x                                   X

                                                                                   X
          1.4x                                                                              X

          1.0x

          0.6x

          0.2x

      Figures as of January 27th 2020                                                                  Source: Pangea Research, Thomson Reuters, Company reports
17   17
                                                                                                             Market presentation      Pangea Property Partners
Forward ratios                   EBITDA yield around 3.9 % (sample of 20 Nordic real estate companies)

                                  EBITDA YIELD (2020F) 1                                OPERATING CF YIELD (2020F) 1                      DIVIDEND YIELD (2020F) 1

            Olav Thon
               Pandox
               Nyfosa
               Citycon
                   SBB
             Hemfosa
          Kungsleden
                 Entra
            Castellum
 Norwegian Property
               Catena
                Sagax
               Kojamo
                Balder
               Klövern
     Atrium Ljungberg
                Corem
               Fabege                         EBITDA yield (median)                                       CF yield (median)                      Dividend yield (median)
          Wallenstam                                 3.9 %                                                      3.7 %                                    2.2 %
        Hufvudstaden

                          0%          3%          6%          9%          12%        0%          3%           6%         9%   12%   0%          3%         6%          9%          12%
 1) Sample of selected Nordic real estate companies. Analysts consensus for 2020.
 EBITDA yield based on Enterprise value, Operating CF Yield and Dividend yield on market capitalization                                        Source: Pangea Research, Thomson Reuters
18
                                                                                                                                    Market presentation      Pangea Property Partners
Return on equity                     Conceptual calculations before tax (Sweden and Norway)

             SWEDEN (CONCEPTUAL ROE, BEFORE TAX)                                                  NORWAY (CONCEPTUAL ROE, BEFORE TAX)

 12.0 %                                                                                12.0 %

 10.0 %                                                                                10.0 %

                                  Assumptions                                                                  Assumptions
     8.0 %                           55 % LTV                                           8.0 %                     55 % LTV
                                                            4.4 %
                            All-in interest rate 2.0 %                                                   All-in interest rate 3.5 %         3.1 %

     6.0 %                                                                              6.0 %

                                                                         10.0 %                              2.1 %
                                1.7 %
                                                                                                                                                             9.1 %
     4.0 %                                                                              4.0 %

                                                                                                                              6.0 %
                                                 5.6 %
     2.0 %      3.9 %                                                                   2.0 %   3.9 %

     0.0 %                                                                              0.0 %
              EBITDA        CPI / Growth Unlev. returns,    Positive   Lev. returns,            EBITDA   CPI / Growth Unlev. returns,       Positive     Lev. returns,
               yield                      before tax       leverage     before tax               yield                 before tax          leverage       before tax

 *) CPI based on IMF’s 2020-2024 forecast
19
                                                                                                                     Market presentation     Pangea Property Partners
Why invest in listed real estate?   Attractive risk-adjusted returns despite surge in stock prices

                                                                     LISTED REAL ESTATE STILL ATTRACTIVE?

                                                                 Safe haven and good risk-adjusted returns

                                                                 Liquid and transparent market

                                                                 Both running cash-flow and predictable future cash-flow

                                                                 Inflation hedge

                                                                 Attractive financing and prospects of sustained low interest rates

                                                                 Rent increase upside

                                                                 Accretive acquisitions – the share premium is a valuable currency:

                                                                 – Single assets, portfolios and other companies

                                                                 Accretive development projects:

                                                                 – Often a significant portion of the portfolio

20
                                                                                         Market presentation      Pangea Property Partners
Property Segments

21
2
1
                         Market presentation   Pangea Property Partners
Oslo office market – Last 20 years                                                              Office market tends to follow the business cycles closely

                                                                                                 DEVELOPMENT IN OSLO PRIME OFFICE

                                    6 000                                                                                                                                                                                      130
                                                   Strong office                                          Strong office                                     Strong office                            Strong office
                                                      market                                                 market                                            market                                   market

                                    5 000                                                                                                                                                                                      110
                                                    Yield: 7.50%                  Yield: 6.50%                               Yield: 6.20%
                                                    Rent/sqm: NOK 2,500           Rent/sqm: NOK 2,025                        Rent/sqm: NOK 2,700
                                                    Value/sqm: NOK 31,000         Value/sqm: NOK 29,000                      Value/sqm: NOK 40,000
     Gross rent per sqm (NOK/sqm)

                                    4 000                                                                                                                                                                                      90

                                                                                                                                                                                                                                        Value per sqm (NOK ‘000)
                                    3 000                                                                                                                                                                                      70

                                    2 000                                                                                                                                                                                      50

                                    1 000                                                                                                                                                                                      30
                                                                                                            Yield: 5.50%                                               Yield: 4.25%              Yield: 3.75%
                                                                                                            Rent/sqm: NOK 3,600                                        Rent/sqm: NOK 3,800       Rent/sqm: NOK 4,900
                                                                                                            Value/sqm: NOK 60,000                                      Value/sqm: NOK 82,000     Value/sqm: NOK 120,000
                                       0                                                                                                                                                                                       10
                                            '97   '98   '99   '00   '01     '02     '03    '04    '05     '06      '07    '08       '09   '10    '11       '12   '13     '14    '15   '16      '17     '18   '19    '20

                                                                                                                Gross rent (l.a.)           Value (r.a.)

                                                                                                                                                                        Source: Pangea Research, Dagens Næringsliv – Eiendomspanelet
22
                                                                                                                                                                                 Market presentation         Pangea Property Partners
Oslo and Stockholm office markets                                       Values driven by rental growth the coming years

                                          OSLO                                                                                                 PRIME RENT AND YIELD DEVELOPMENT

                                                                                                                                  190                                                                              7.0 %
                                   2017           2018           2019          2020E

     Prime yield (%)              3.75 %         3.80 %         3.75 %         3.75 %                                             180                                                                              6.5 %
                                                                                                                                                                                               +7 %

     Prime rent (NOK/sqm)          4,250          4,500          4,900          5,250                                             170                                                                              6.0 %

     Total vacancy (%)            7.10 %         6.20 %         5.60 %         6.00 %                                                                                        +19 %
                                                                                                                                  160                                                                              5.5 %
                                                                                                                                                                                                  +12 %

                                                                                                  Prime rent (index 100 = 2010)
     Inner city vacancy (%)       4.40 %         4.20 %         3.50 %         3.80 %
                                                                                                                                  150                                                                              5.0 %
     Value/sqm (NOK)1)            98,000        109,000        120,000        129,000

                                                                                                                                                                                                                           Prime yield (%)
                                                                                                                                  140                                                                              4.5 %
                                   STOCKHOLM                                                                                                                                        +17 %
                                                                                                                                  130                                                                              4.0 %

                                   2017           2018           2019          2020E
                                                                                                                                  120                                                                              3.5 %
     Prime yield (%)              3.40 %         3.35 %         3.25 %         3.25 %
                                                                                                                                  110                                                                              3.0 %
     Prime rent (SEK/sqm)2)        6,300          6,800          7,100          7,300

     Total vacancy (%)            7.60 %         7.60 %         8.00 %         9.00 %                                             100                                                                              2.5 %

     Inner city vacancy (%)       2.25 %         2.25 %         2.75 %         3.00 %                                             90                                                                               2.0 %
                                                                                                                                        '10   '11   '12    '13   '14   '15    '16    '17    '18       19   '20E
     Value/sqm (SEK)1)           145,000        150,000        155,000        160,000
                                                                                                                                                    Oslo prime rent                  Stockholm prime rent
                                                                                                                                                    Oslo prime yield                 Stockholm prime yield
 1) Assumed owner’s cost of 8 % of GRI, 2) Rents per NLA converted to rents per GLA for comparability                                                            Source: Pangea Research, Dagens Næringsliv – Eiendomspanelet
23
                                                                                                                                                                         Market presentation          Pangea Property Partners
Prime yield breakdown                              Comparison of prime office in the Scandinavian capitals

                               PRIME OFFICE (JAN-19)                                                                        PRIME OFFICE (JAN-20)

                        4.0%                                                                                         4.0%

                                                  0.48%                                                                                      0.43%

                        3.0%                                                                                         3.0%
                                                                                  2.08%
      Yield gap                   1.40%           1.50%           1.93%                            Yield gap                                 1.50%                     2.25%
                                                                                                                               1.49%                    2.00%
      Bank margin                                                                                  Bank margin
      5Y swap           2.0%                                                                       5Y swap           2.0%

                                  1.50%
                        1.0%                                                      1.50%                              1.0%      1.50%
                                                  1.82%           1.50%                                                                      1.82%
                                                                                                                                                        1.50%          1.50%

                                  0.45%                                           0.32%
                                                                  0.17%                                                        0.26%
                        0.0%                                                                                         0.0%
                                Stockholm          Oslo          Helsinki     Copenhagen                                     Stockholm       Oslo      Helsinki    Copenhagen

     Prime yield                 3.35 %          3.80 %          3.60 %           3.90 %          Prime yield                 3.25 %        3.75 %     3.50 %          3.75 %
     LTV                          60 %            60 %            60 %             60 %           LTV                          60 %          60 %       60 %            60 %
     Cash-on-cash                 5.5 %           4.5 %           6.5 %            7.0 %          Cash-on-cash                 5.5 %         4.4 %      6.5 %           7.1 %
     Price, EUR / sqm            ~14,000         ~11,000         ~8,000           ~6,500          Price, EUR / sqm            ~15,000      ~12,500     ~10,000         ~7,000

                                     Smallest yield gap in Norway due to higher interest rate that needs to be compensated by rental growth

 Notes: (1) As of January 27th 2020, (2) Pre-amortization, (3) Sales prices in secondary market
24
                                                                                                                                 Market presentation   Pangea Property Partners
Summary
                   Nordic real estate very attractive in a global context

             Plenty of capital (“wall of equity”), no change around the corner

                   Lack of sizable investments; increasing M&A activity

          Interest rate drop making real estate cheap(er) – record large yield gap

                     Office: a safe haven next 2-3 years, then what…?

                      Retail: Higher risk, rents expected to decrease

                Logistics: Strong logistics rush – no signs of slowing down

     Large and liquid property market offering opportunities
25
2
5
                                                                            Market presentation   Pangea Property Partners
Appendix

26
2
6
                Market presentation   Pangea Property Partners
Nordic overview                Overall outlook arguing a strong real estate market in 2020 and onwards

                GDP GROWTH FORECAST (2019-2024F)                                     POPULATION FORECAST (2019-2024F)
     2.5 %                                                                 1.0%

     2.0 %                                                                 0.8%

     1.5 %                                                                 0.6%

     1.0 %                                                                 0.4%

     0.5 %                                                                 0.2%

     0.0 %                                                                 0.0%
             Norway   Sweden     Finland   Denmark    Nordics   Eurozone          Norway   Sweden     Finland     Denmark     Nordics     Eurozone

                               2019F    2020F-2024F                                                 2019F       2020F-2024F

              UNEMPLOYMENT FORECAST (2019-2024F)                                       INFLATION FORECAST (2019-2024F)
 10.0%                                                                     2.5%

     8.0%                                                                  2.0%

     6.0%                                                                  1.5%

     4.0%                                                                  1.0%

     2.0%                                                                  0.5%

     0.0%                                                                  0.0%
             Norway   Sweden     Finland   Denmark    Nordics   Eurozone          Norway   Sweden     Finland     Denmark     Nordics      Eurozone

                           2019        2020F-2024F                                                  2019    2020F-2024F

                                                                                                             Source: Pangea Research, IMF, Thomson Reuters
27
                                                                                                       Market presentation      Pangea Property Partners
Transaction activity                        Transaction volumes vs. deal count show different “market temperatures”

                  TRANSACTION VOLUME LAST 5Y (ROLLING 12M)                                                    NO. OF DEALS LAST 5Y (ROLLING 12M)

             25                                                                                      600

                             Norrporten /
                                                                   Hembla / Vonovia
                              Castellum
                                                                    Hemfosa / SBB
                                                                                                     500
             20

                                                                                                     400

             15

                                                                                      No. of deals
     EURbn

                  Sektor /                   Sponda /
                  Citycon                   Blackstone                                               300

             10

                                                                                                     200

             5
                                                                                                     100

                               Sweden       Norway       Finland       Denmark                                   Sweden        Norway             Finland          Denmark

             0                                                                                        0
              2015           2016           2017         2018            2019                          2015     2016          2017               2018             2019

                                                                                                                          Source: Pangea Research, based on deals above EUR 5m
28
                                                                                                                           Market presentation          Pangea Property Partners
Norwegian transactions 2019              Active transaction market in all deal sizes

                                                                  No. of transactions: 258

                                                              Transaction volume: NOK ~97bn                                         Norwegian part
                                                                                                                                     of Hemfosa
                                                            Average transaction size: NOK ~374m                                        portfolio

                                                                                                                  DNB-
                                                                                                                 building

          50             100             200          400                800                 1 600       3 200                6 400                12 800

                       Smaller                       Mid range                                              Large
               151 transactions (59 %)         85 transactions (33 %)                                22 transactions (9 %)
                    < NOK 200m                    NOK 200 – 800m                                         > NOK 800m                       Source: Pangea Research
29   29
                                                                                                              Market presentation      Pangea Property Partners
Listed property companies                          Historically high premium to NAV – almost 40% above EPRA NAV on average

                            PRICE / EPRA NAV BY COUNTRY                                                VALUATION VS LEVERAGE IN SWEDEN

          1.8x                                                                               3.0x

          1.6x                                                1.6x                                                                                           R² = 41%
                    1.4x
                                                                       1.4x                  2.5x
          1.4x
                                                1.3x

          1.2x

                                                                                             2.0x

                                                                                P/EPRA NAV
          1.0x

                                        0.8x
          0.8x
                                                                                             1.5x

          0.6x

          0.4x
                                                                                             1.0x

          0.2x

          0.0x                                                                               0.5x
                 Sweden            Norway      Finland      Denmark   Nordic                     10%        30%                50%                70%                  90%

      Figures as of January 27th 2020                                                                             Source: Pangea Research, Thomson Reuters, Company reports
30   30
                                                                                                                        Market presentation      Pangea Property Partners
M&A activity                               A wave of sizeable takeovers and IPOs in the current market

                                                                    SECTOR VALUATION AND M&A ACTIVITY (2014 -2019)

                        1.3x
                                                                                                                                                     Aedifica’s bid on Hoivatilat (FI)           SBB’s bid on Hemfosa (SE)
                                                                                                                                                      16% premium on closing price              23% premium on closing price
                                                                                                                                                               EUR ~0.6bn                                SEK ~40bn
                        1.2x

                               Oscar Properties (SE)                                            Solon Eiendom (NO)       Hoivatilat (FI)              Kojamo (FI)         Brinova (SE)      K2A (SE)
                                    SEK 0.5bn                                                       NOK 1.5bn             EUR 0.2bn                    SEK 4.9bn           SEK 3.4bn        SEK 3.3bn
                        1.1x
                                                                                                                                                     Magnolia (SE)                       John Mattson (SE)
     PRICE / EPRA NAV

                                             Entra (NO)                                                       SBB (SE)
                                             NOK 32bn                                                        SEK 7.5bn                                SEK 3.2bn*                             SEK 6.1bn

                        1.0x
                                                                                                                                           Stendörren (SE)           Nyfosa (SE)
                                                                                                                                              SEK 6.7bn              SEK 15.4bn

                        0.9x
                                                                                                                                                                                                Vonovia’s bid on Hembla (SE)
                                                                         Tribona 30% (SE)                                                                                                       12% premium on closing price
                                                                             SEK 3.0bn
                                                                                                                                                                                                         SEK ~34bn
                        0.8x
                                                                                                    Hembla 50% (SE)              Sponda 100% (FI)
                                                                                                                                                                                            Stendörren 41% (SE)
                                                                                                       SEK 9.4bn                    EUR 3.8bn
                                                                                                                                                                                                 SEK 3.3bn
                        0.7x
                                                                                                                            Victoria Park 81% (SE)                                   Technopolis 100% (FI)
                                      LISTINGS                TAKEOVERS                                                           SEK 12.5bn                                              EUR 1.6bn

                        0.6x
                               Q1     Q2     Q3        Q4    Q1    Q2     Q3     Q4     Q1    Q2     Q3    Q4     Q1       Q2       Q3      Q4      Q1       Q2     Q3        Q4     Q1        Q2       Q3    Q4
                               '14    '14    '14       '14   '15   '15    '15    '15    '16   '16    '16   '16    '17      '17      '17     '17     '18      '18    '18       '18    '19       '19      '19   '19

                                                                                                                                                                                           Source: Pangea Research
31
                                                                                                                                                          Market presentation        Pangea Property Partners
M&A activity                       Examples of recent / ongoing takeovers and listings

                            Pending                              Pending                                Pending                                   Jun 2019 (delisted)

             • CEO: Caroline Arehult              • CEO: Jussi Karjula                   • CEO: Svein Erik Lilleland                  • CEO: Per Ekelund
 TAKEOVERS

             • Geography: Nordic                  • Geography: Finland, Sweden           • Geography: Sweden                          • Geography: Sweden
             • Sector focus: Public properties    • Sector focus: Public properties      • Sector focus: Residentials                 • Sector focus: Residentials
             • Buyer: SBB                         • Buyer: Aedifica                      • Buyer: Vonovia                             • Buyer: Vonovia
             • Bid: Cash / shares (23% premium)
                                                  • Bid: Cash (16% premium)              • Bid: Cash (12% premium)                    • Bid: Cash (20%)

                         SEK ~40bn                            EUR ~0.6bn                              SEK ~34bn                                      SEK ~19bn
                      (property value)                      (property value)                       (property value)                               (property value)

                             2020                                 2020                                 Jun 2019                                        Jun 2019

             • CEO: Michael Moschewitz            • CEO: Jacob Karlsson                  • CEO: Johan Knaust                          • CEO: Siv Malmgren
             • Geography: Stockholm, Uppsala      • Geography: Southern Sweden           • Geography: Sweden                          • Geography: Lidingö
 LISTINGS

             • Sector focus: Resi, commercial     • Sector focus: Residentials           • Sector focus: Residentials                 • Sector focus: Residentials
             • Main owner: Mikael Bile (61%)      • Main owners: Jacob Karlsson (50%),   • Main owner: Johan Knaust (31%)             • Main owner: Kerstin Skarne (36%)
                                                    Erik Selin (50%)

                         SEK ~4bn                              SEK ~4bn                               SEK ~4bn                                       SEK ~6bn
                      (property value)                      (property value)                       (property value)                               (property value)

32
                                                                                                                            Market presentation        Pangea Property Partners
Ownership                A few key players controlling most Swedish property companies (% of votes, Q3/Q4-19)
                                     100%
               Skandrenting                                  ERIK SELIN                  K-Fastigheter          FAM PAULSSON                          Backahill
                                                                                                                                                                                        63%
                                     100%                                                             50%                                                                                                          FAM LJUNGBERG
              Kunskapsporten                                                                                            56%                 6%
                                                              Erik Selin           41%          Balder                                                                        Skistar
               Selin Fastig.         100%                    Fastigheter                        Skåne
                                                                                                                         Peab                   SBB           15%                                                    Tagehus
               i Göteborg                                    50%                                                                                                              Fabege
                                                                                          50%
                                     50%                                                                                                                                                                               92%
                 Trenum                                            Balder                 50%                                                                                                       Credentia
                                                                                                       Första                                                 10%
                                                15%                                                                                                                          Wihlborgs
                                                                                                      LG Gbg                                                                                                           30%
                                                                                                                                                                                                       Runö
     FAM SVENSSON                                               49%                       33%                           33%                                                                         Fastigheter
                                                 Sinoma                                               Tornet                                                  11%
                                                                                                                                                                                 Diös
                                                                                                                                                                                                                       13%
                                                                50%                                                                                                                                John Mattson
              Arvid Svensson Invest                  Tulia                                50%                           50%
                                                                                                      Centur                                                  30%
                                                                                                                                                                              Catena                                   16%
                                                                54%
                                                Sato (FI)                                 35%                                    43%                                                           K2A Fastigheter
        Hemfosa                                                                                             Brinova                                                                                                              30%
                                                                56%
                                               Serena (FI)                                                                           11%
       91%                                                                                               RUTGER ARNHULT                               Castellum                  FAM LUNDBERG                      Atrium Ljungberg
                                                  SHH           20%
                               11%               Bostad                                                                                                                                            93%
          SBB                                                                                                 M2 Asset                                                                                      100%       Fastighets AB
                                              17%                                                            Management                     14%                               L E Lundbergföretagen
                                                                                                                                                                                                                       L E Lundberg
                      100%                                     15%                                        45%
9%    Agora                                Klövern                                 Corem                                                Sagax                       Sveavalvet                        88%
                                                                                                                                                                                                                     Hufvudstaden
                                 93%                                                                                                                              100%
                                                 Tobin                                      M2            100%                             15%
       FastPartner                                                    SSM                                                       Hemsö                                                                 13%
                                               Properties                                 Gruppen
                                                                                                                                                                       NP3 Fastigheter                                 Skanska
                                                               30%                                        85%                              50%            20%
                72%
                                               Amasten                                   Wäst-Bygg                            Söderport
                                                                                                                                                                                 20%                                  24%
       Compactor                 11%                                                                                                                                                                        24%
                                                               49%                                                                                                    25%
       Fastigheter                              Sterner                                                                                                                           Emilshus                          Industrivärden
                                                                                          Kvalitena
                                                Stenhus                                                                                         27%
       SVEN-OLOF                                               63%          100%
                                              BoStad (DK)                                Heleonora             MIKAEL ANDERSSON                       DAVID MINDUS
      JOHANSSON

                                 Ultimate owner              Listed property company (Main list)                      Listed property company (First North)                 Unlisted property company

33
                                                                                                                                                                             Market presentation          Pangea Property Partners
Retail market (1/2)                  Sluggish development in retail equities in recent years

                                          TOTAL RETURN, RETAIL REAL ESTATE SECTOR (JAN-16 – JAN-20)

     160%

                                                                                                                                    PREX Property
     120%                                                                                                                                  133 %
                                                                                                                                  Atrium Ljungberg
                                                                                                                                             103 %
      80%
                                                                                                                                       PREX Retail
                                                                                                                                            43 %
      40%                                                                                                                                Olav Thon
                                                                                                                                              28 %
                                                                                                                                            Citycon
       0%                                                                                                                                      10 %
                                                                                                                                          Klépierre
                                                                                                                                              10 %
      -40%
                                                                                                                                               URW
                                                                                                                                              -27 %
                                                                                                                                       Hammerson
      -80%
                                                                                                                                           -45 %
                                                                                                                                    Intu Properties
                                                                                                                                             -92 %
     -120%
         Jan-16              Jul-16       Jan-17      Jul-17     Jan-18     Jul-18      Jan-19        Jul-19             Jan-20

 Figures as of January 27th 2020                                                                            Source: Pangea Research, Thomson Reuters
34
                                                                                                 Market presentation      Pangea Property Partners
Retail market (2/2)                    Stock market may be anticipating write-downs with pricing well below book values

                                                       PRICE / EPRA NAV DEVELOPMENT (Q1-16 – Q3/Q4-19)

     1.4x

     1.2x
                                                                                                                                        Atrium Ljungberg
                                                                                                                                                   1.12x
     1.0x
                                                                                                                                                  Klépierre
                                                                                                                                                     0.82x
     0.8x                                                                                                                                           Citycon
                                                                                                                                                      0.77x
                                                                                                                                                      URW
     0.6x                                                                                                                                             0.61x
                                                                                                                                                 Olav Thon
                                                                                                                                                     0.56x
     0.4x
                                                                                                                                               Hammerson
                                                                                                                                                   0.38x

     0.2x

                                                                                                                                           Intu Properties
                                                                                                                                                    0.08x
     0.0x
        Q1-16                Q3-16                Q1-17                 Q3-17   Q1-18   Q3-18        Q1-19                Q3-19

 Figures as of January 27th 2020, EPRA NAV from latest company report                              Source: Pangea Research, Thomson Reuters, Company Reports
35
                                                                                                          Market presentation     Pangea Property Partners
Disclaimer

 This presentation has been prepared by Pangea Property Partners KB and                information as of the date of this presentation. There is no guarantee that any of        representatives, or other agents may disclose to any and all persons, without
 Pangea Property Partners AS (”Pangea”) for the exclusive use of the party to          these estimates or projections will be achieved. Actual results will vary from the        limitation of any kind, the tax treatment and tax structure of the transaction and
 whom Pangea delivers this presentation (together with its subsidiaries and            projections and such variations may be material. Nothing contained herein is, or          all materials of any kind (including opinions or other tax analyses) that are
 affiliates, the ”Company”) using information provided by publicly available           shall be relied upon as, a promise or representation as to the past or future.            provided to the Company relating to such tax treatment and tax structure.
 information. The valuations, forecasts, estimates, opinions and projections           Pangea, its affiliates, directors, officers, employees and/or agents expressly            Distribution of this presentation to any person other than the Company and
 contained herein involve elements of subjective judgment and analysis. Pangea         disclaim any and all liability relating or resulting from the use of all or any part of   those persons retained to advise the Company, who agree to maintain the
 has not independently verified the information contained herein, nor does             this presentation. This presentation has been prepared solely for informational           confidentiality of this material and be bound by the limitations outlined herein, is
 Pangea make any representation or warranty, either express or implied, as to the      purposes and is not to be construed as a solicitation or an offer to buy or sell any      unauthorized. This material must not be copied, reproduced, distributed or
 accuracy, completeness or reliability of the information contained in this            securities or related financial instruments. The Company should not construe the          passed to others at any time, in whole or in part, without the prior written
 presentation. It should not be regarded by the recipients as a substitute for the     contents of this presentation as legal, tax, accounting or investment advice or a         consent of Pangea.
 exercise of their own judgment.                                                       recommendation. The Company should consult its own counsel, tax and financial
                                                                                       advisors as to legal and related matters concerning any transaction described             © 2020 Pangea Property Partners KB and Pangea Property Partners AS. All
 This presentation may contain forward-looking statements. Pangea undertakes no        herein. This presentation does not purport to be all-inclusive or to contain all of
                                                                                                                                                                                 rights reserved. Pangea specifically prohibits the redistribution of this material
 obligation   to   update   these   forward-looking   statements   for   events   or   the information that the Company may require. No investment, divestment or                and accepts no liability whatsoever for the actions of third parties in this respect.
 circumstances that occur subsequent to such dates. Any information or opinion         other financial decisions or actions should be based solely on the information in
 expressed herein is subject to change without notice.         Any estimates or        this presentation.
 projections as to events that may occur in the future (including projections of
 revenue, expense, net income and stock performance) are based upon the best           This presentation has been prepared on a confidential basis solely for the use and
 judgment of Pangea from the information provided by publicly available                benefit of the Company; provided that the Company and any of its employees,

36
                                                                                                                                                                                               Market presentation                 Pangea Property Partners
You can also read