The City of Columbus, Ohio Investor Presentation - September 20, 2019
←
→
Page content transcription
If your browser does not render page correctly, please read the page content below
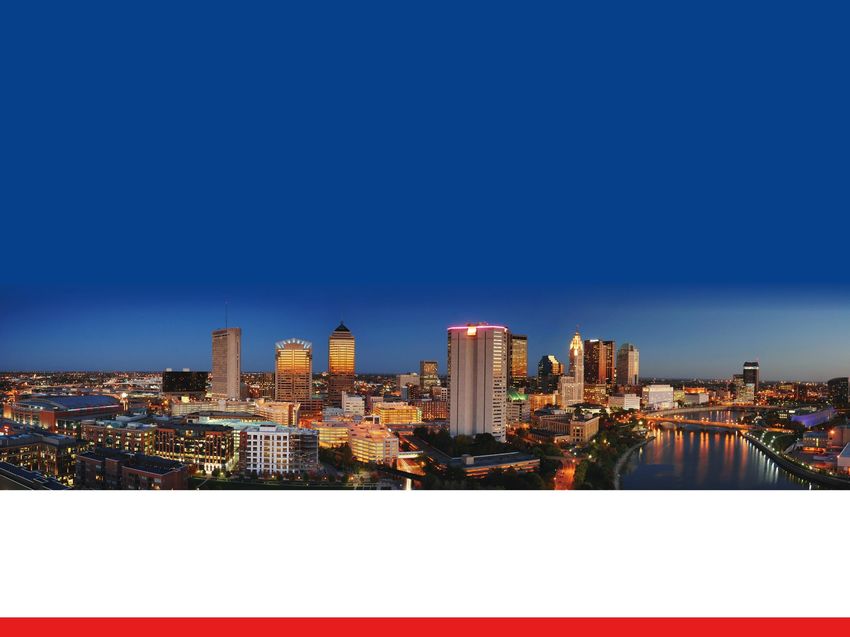
IBDROOT\PROJECTS\IBD-NY\COLUMBUSGO2019\641549_1\03 - Presentations\Investor Presentation\2019 City of
Columbus Investor Presentation v8.pptx

The City of Columbus, Ohio
Investor Presentation
September 20, 2019
IBDROOT\PROJECTS\IBD-NY\COLUMBUSGO2019\641549_1\03 - Presentations\Investor Presentation\2019 City of
    Columbus Investor Presentation v8.pptx
Disclaimer
   The presentation and the information contained herein shall NOT be deemed to be an undertaking to provide continuing disclosure with respect to
   such information on an annual basis.
   This electronic investor presentation that you are about to view is provided as of September 20, 2019 for a proposed offering of City of Columbus, OH General
   Obligation Bonds, Various Purpose Bonds Series 2019A-D, 2019-1 and 2019-2 (the “Bonds”). This presentation has been prepared for information purposes only
   and for your sole and exclusive use in connection with the proposed transaction. The information contained herein is subject to completion and amendment. Any
   offer or solicitation with respect to the Bonds will be made by means of a preliminary official statement or a final official statement. If you are viewing this investor
   presentation after the date stated above, events may have occurred that have a material adverse effect on the financial information presented and neither the
   issuer nor the underwriter have undertaken any obligation to update this electronic presentation.
   This investor presentation does not constitute a recommendation or an offer or solicitation for the purchase or sale of any security or other financial instrument,
   including the Bonds, or to adopt any investment strategy. You will be responsible for consulting your own advisors and making your own independent investigation
   and appraisal of the risks, benefits, appropriateness and suitability of the proposed transaction and any other transactions contemplated by this presentation and
   neither the issuer nor the underwriter is making any recommendation (personal or otherwise) or giving any investment advice and will have no liability with respect
   thereto.
   Neither the issuer nor the underwriter makes a representation or warranty as to the (i) accuracy, adequacy or completeness of any information in this investor
   presentation or (ii) legal, tax, credit or accounting treatment of any purchase of Bonds by you or any other effects such purchase may have on you and your
   affiliates or any other parties to such transactions and their respective affiliates. The information contained herein has been compiled from sources believed to be
   reliable, however neither the issuer nor the underwriter shall have any liability whatsoever (in negligence or otherwise) to any person for any loss arising from this
   investor presentation or any information supplied in connection therewith.
    This investor presentation contains “forward-looking” statements that involve risks, uncertainties and assumptions. If the risks or uncertainties ever materialize or
   the assumptions prove incorrect, the results may differ materially from those expressed or implied by such forward-looking statements. Accordingly, we caution
   you not to place undue reliance on these statements. All statements other than the statements of historical fact could be deemed forward-looking. All opinions,
   estimates, projections, forecasts and valuations are preliminary, indicative and are subject to change without notice.
   Transactions involving the Bonds may not be suitable for all investors. You should consult with your own advisors as to the suitability of the Bonds for your
   particular circumstances. No assurance can be given that any transaction mentioned herein could in fact be executed. Past performance is not indicative of future
   returns, which will vary. Prospective investors should contact their salesperson at, and execute the transactions through an entity of the underwriter qualified in
   their home jurisdiction unless governing law permits otherwise.
   THE PRINTING, DUPLICATING, DOWNLOADING, SCREEN CAPTURING, ELECTRONIC STORING, RECORDING, PUBLISHING OR DISTRIBUTING OF
   THIS INVESTOR PRESENTATION IN ANY MANNER IS STRICTLY PROHIBITED.
   By viewing this investor presentation you acknowledge that you understand and agree to the provisions of this page.

                                                                                     1
IBDROOT\PROJECTS\IBD-NY\COLUMBUSGO2019\641549_1\03 - Presentations\Investor Presentation\2019 City of
       Columbus Investor Presentation v8.pptx
City of Columbus, General Obligation Bonds, Series 2019
Transaction Summary*
                                    Series 2019A         Series 2019B          Series 2019C          Series 2019D       Series 2019-1        Series 2019-2
        Par Amount*                 $ 259,500,000        $ 17,715,000          $ 13,320,000          $18,875,000        $ 57,085,000        $ 34,290,000
          Tax Status                 Tax-Exempt           Tax-Exempt        Federally Taxable      Federally Taxable   Federally Taxable   Federally Taxable
          Debt Type                 Unlimited GO          Limited GO          Unlimited GO            Limited GO        Unlimited GO          Limited GO
     First Interest Date                                                                   April 1, 2020
     First Principal Date           April 1, 2021        April 1, 2021         April 1, 2021         April 1, 2021       April 1, 2022       April 1, 2021
        Final Maturity              April 1, 2040        April 1, 2035         April 1, 2036         April 1, 2040       April 1, 2033       April 1, 2032
        Call Feature*                                                                  To be Determined
       Denominations                   $5,000               $1,000                $5,000                   $5,000           $5,000              $5,000
            Ratings                                                                      Aaa/AAA/AAA
           Sale Date                                                                   October 2-3, 2019
         Closing Date                                                                   October 16, 2019
       Senior Manager                                                               Goldman Sachs & Co. LLC
    Co-Senior Manager                                                                  BofA Merrill Lynch
        Co-Managers                             Huntington Capital Markets ; PNC Capital Markets LLC; Stifel Nicolaus & Company, Incorporated
                                           280 Securities; Baird; Barclays; Boenning & Scattergood; Fidelity Capital Markets; Fifth Third Securities;
       Selling Group*                     Janney Montgomery Scott; J.P. Morgan; KeyBanc Capital Markets; Loop Capital Markets; Morgan Stanley;
                                                                   Piper Jaffray; Raymond James; UBS Financial Services, Inc.
  *Preliminary, subject to change

                                                                                2
IBDROOT\PROJECTS\IBD-NY\COLUMBUSGO2019\641549_1\03 - Presentations\Investor Presentation\2019 City of
       Columbus Investor Presentation v8.pptx
Credit Highlights
 •   Large, growing regional economy that includes the State Capital and The Ohio State University
        •   14th largest city in the nation (892,533 - 2018 US Census estimate)
        •   Population has grown 13.4% since 2010
 •   Top employers include large public and non-profit entities as well as corporations
        •   State of Ohio, The Ohio State University, Nationwide Children’s Hospital, OhioHealth and Columbus City Schools
        •   Kroger, JP Morgan Chase, Nationwide and L Brands
 •   History of strong financial results
        •   2.5% Income Tax Levy has 5 year Compounded Annual Growth Rate of 3.7%
                • 75% of income tax revenues designated for general operations
                • 25% of income tax revenues designated for debt service (primarily non-utility type projects)
        •   The General Fund (on a budgetary basis), Special Income Tax Fund and Rainy Day Fund reached the highest level in
            City history in 2018
        •   The City is on track to reach its 2020 goal of $80 million in the Rainy Day Fund
 •   Consistent financial and debt management policies
        •   Governance structure includes Mayor and City Council setting appropriations within revenue estimates provided by
            publicly elected City Auditor
        •   Strong history of voter approval for bonded debt
               • All bond referendums have passed since 1981
        •   G.O. debt secured by property tax levy, but paid from user fees of respective enterprise (e.g. water, sewer, etc) or
            dedicated income tax
        •   Policy requires dedicated income tax receipts provide 1.5x coverage of GO debt service (not paid by user fees)

                                                                                3
IBDROOT\PROJECTS\IBD-NY\COLUMBUSGO2019\641549_1\03 - Presentations\Investor Presentation\2019 City of
Columbus Investor Presentation v8.pptx
Population
Columbus has grown 58.0% since 1980
Columbus Franklin County M.S.A. Ohio
Year No. % Change No. % Change No. % Change No. % Change
1960 471,316 -- 682,923 -- 754,885 -- 9,730,000 --
1970 540,025 14.6 % 833,249 22.00 % 1,017,847 34.8 % 10,657,432 9.5 %
1980 564,871 4.6 869,109 4.3 1,088,973 7.0 10,797,419 1.3
1990 632,910 12.0 964,720 11.0 1,345,450 23.5 10,847,115 0.5
2000 711,470 12.4 1,068,978 10.8 1,540,157 14.5 11,353,140 4.7
2010 787,033 10.6 1,163,414 8.8 1,812,148 17.6 11,536,504 1.6
2018* 892,533 13.4 1,310,300 12.6 N/A N/A 11,689,442 1.3
*According to the U.S. Census Bureau’s July 1, 2018 population estimate.
Source: U.S. Department of Commerce, Bureau of the Census
4IBDROOT\PROJECTS\IBD-NY\COLUMBUSGO2019\641549_1\03 - Presentations\Investor Presentation\2019 City of
Columbus Investor Presentation v8.pptx
Unemployment and Per Capita Income
Since 2008, Columbus MSA and Franklin County unemployment has
remained below the state and national rates
Average Annual Unemployment Rates* (%) Estimated Per Capita Income1 ($)
2008-2019 2008-2017
$60,000
$50,000
$40,000
$30,000
$20,000
$10,000
$0
2008 2009 2010 2011 2012 2013 2014 2015 2016 2017
Franklin County State of Ohio United State Columbus MSA
Source: Ohio Department of Job and Family Services, Bureau of Labor Market Information, U.S. Department of Commerce, Division of
Regional Measurement and Bureau of Economic Analysis.
*Average through July 31, 2019
1 2009-2016 total personal income and per capita income figure were changed in the 2018 CAFR to reflect revised estimates issued by the
Bureau of Economic Analysis.
5IBDROOT\PROJECTS\IBD-NY\COLUMBUSGO2019\641549_1\03 - Presentations\Investor Presentation\2019 City of
Columbus Investor Presentation v8.pptx
Largest Employers
Mix of Public and Non-Profit Institutions as well as diversity of Industry
Sectors
Rank Firm Number of Employees Industry
1 Ohio State University 32,111 Education
2 Ohio Health 26,599 Health care system
3 Wal-Mart Stores Inc. 26,000 Retail grocery
4 State of Ohio 24,955 Government
5 JPMorgan Chase & Co. 18,701 Banking & financial services
6 Nationwide 13,455 Insurance and financial services
7 Nationwide Children’s Hospital 12,023 Health care system
8 Kroger Co. 11,206 Retail grocery
9 City of Columbus 8,873 Government
10 Mount Carmel Health System 8,708 Health care system
11 Honda North America, Inc. 8,300 Auto Manufacturing
12 Columbus City Schools 7,890 Education
13 L Brands Inc. 7,662 Retail Clothing
14 Franklin County 7,249 Government
15 Huntington Bancshares Inc. 5,983 Banking & financial services
Source: POS, A-13. Columbus Business First. Data as of July 2018.
6IBDROOT\PROJECTS\IBD-NY\COLUMBUSGO2019\641549_1\03 - Presentations\Investor Presentation\2019 City of
Columbus Investor Presentation v8.pptx
Downtown Development
Downtown has seen nearly $2.5 billion in public and
private investment over the last decade
• Includes the Arena District, a 75-acre mixed use
development of class A office space, retail, food
and entertainment
• Following the success of the Arena District, plans
are underway for a proposed $240 million multi-
purpose sports, entertainment, cultural and
recreational destination that includes a new
20,000 seat stadium serving as the new home of
the Columbus Crew of Major League Soccer
• Other major projects include the Scioto Mile and
RiverSouth District
In 2018, seven new residential buildings opened
downtown, bringing 594 additional units and a total
of 6,678 units since 2002
• The number of residents living downtown has
grown from 3,619 in 2002 to 9,000 at the close of
2018
Source: POS, A-9.
7IBDROOT\PROJECTS\IBD-NY\COLUMBUSGO2019\641549_1\03 - Presentations\Investor Presentation\2019 City of
Columbus Investor Presentation v8.pptx
General Fund Statement of Revenues – Budget Basis
Income tax revenues account for 76.9% of City’s total revenues, on
average, since 2014
Revenues ($000) 2014 2015 2016 2017 2018
Income Taxes $ 578,645 $ 602,241 $ 629,935 $ 656,889 $ 668,685
Property Taxes 44,214 43,204 44,415 45,429 51,599
Investment Income 3,996 6,160 7,701 9,516 13,275
Licenses and Permits 11,607 13,010 12,465 11,601 11,930
Shared Revenues 29,412 29,659 28,246 27,620 28,172
Charges for Services 60,595 63,388 61,858 65,170 65,690
Fines and Forfeits 18,984 18,906 18,930 18,650 18,479
Kilowatt Tax 1,579 3,200 3,132 2,916 3,320
Miscellaneous 7,315 1,725 2,082 14,975 16,182
Total $ 756,347 $ 781,493 $ 808,764 $ 852,766 $ 877,332
Source: POS, page A-32
8IBDROOT\PROJECTS\IBD-NY\COLUMBUSGO2019\641549_1\03 - Presentations\Investor Presentation\2019 City of
Columbus Investor Presentation v8.pptx
Increasing Fund Balance & Reserves
2018 continued a trend of increasing fund balances and reserves
The General Fund (on a budgetary basis) and Special Income Tax
Fund realized their highest balances in the City’s history
Balances ($000) GAAP Budgetary Basis POS Reference
General Fund $ 144,539 $ 130,427 A-34, A-32
Special Income Tax Fund 217,378 191,542 C-30/32, A-33
Total $ 361,917 $ 321,969
9IBDROOT\PROJECTS\IBD-NY\COLUMBUSGO2019\641549_1\03 - Presentations\Investor Presentation\2019 City of
Columbus Investor Presentation v8.pptx
Rainy Day Fund – “Economic Stabilization Subfund”
The City has already met its legislative goal of a $75 million balance in 2018
and is on track to meet its goal of $80 million by 2020
The 2018 year-end balance was the highest year-end balance in the City’s
history
Rainy Day Fund Balance (in millions)
$90.000
$79.042
$80.000 $73.946 $76.180
$69.522
$70.000 $66.741
$64.075
$60.000 $56.145
$50.000
$39.805
$40.000
$32.897
$30.000
$22.724
$20.000 $15.000
$10.000
$-
Source: 2018 CAFR, p. 38
10IBDROOT\PROJECTS\IBD-NY\COLUMBUSGO2019\641549_1\03 - Presentations\Investor Presentation\2019 City of
Columbus Investor Presentation v8.pptx
2019 Bond Issue
The City intends to go to market in October 2019 with $309,410,000 in
new money bonds to support projects within the City’s 2019 capital
improvement budget.
Projects to be financed include:
Purpose Amount Debt Type Debt Service source
Sanitary Sewer Enterprise $ 77,400,000 U User Fees
Water Enterprise 72,200,000 U User Fees
Transportation 54,220,000 U Income Tax
Recreation & Parks 24,370,000 U Income Tax
Public Safety & Health 23,150,000 U Income Tax
Construction Management 20,580,000 L Income Tax
Storm Sewer Enterprise 11,400,000 U User Fees
Development 4,875,000 L Income Tax
Information Services 6,135,000 L Internal Service Fees and Income Tax
Refuse Collection 5,080,000 U Income Tax
General Government 5,000,000 L Income Tax
Electricity Enterprise 5,000,000 U User Fees
$ 309,410,000
Note: None of the City’s bonds and notes are serviced by property tax.
11IBDROOT\PROJECTS\IBD-NY\COLUMBUSGO2019\641549_1\03 - Presentations\Investor Presentation\2019 City of
Columbus Investor Presentation v8.pptx
Security for the Bonds
Security:
– Series 2019A/C/1: voted general obligation debt of the City (the requirement that the City levy
ad valorem property taxes outside the limitations imposed by Ohio law, which taxes are
unlimited as to rate and amount)
– Series 2019B/D/2: unvoted general obligation debt of the City (the City’s ability to levy an ad
valorem tax on real and personal property in the City subject to ad valorem taxation within the
limitations imposed by Ohio law)
Source of Payment:
– For a portion of the Bonds being issued for purposes of the water system, sanitary sewer
system, and storm sewer system, debt service will be paid from net revenues produced by
operations of the specific enterprise system
– For a portion of the Bonds being issued for purposes of the electric system, debt service will
be paid from both enterprise revenues from the electric system and income tax revenues
– For the remainder of the Bonds, debt service will be paid from a portion of the City’s income
tax revenues
– The City has not levied an ad valorem tax for the purpose of paying debt service in over 60
years
12IBDROOT\PROJECTS\IBD-NY\COLUMBUSGO2019\641549_1\03 - Presentations\Investor Presentation\2019 City of
Columbus Investor Presentation v8.pptx
Series 2019 Amortization*
Aggregate Par Amount:
Maturity Series 2019A Series 2019B Series 2019C Series 2019D Series 2019-1 Series 2019-2
(4/1) (Federally (Federally (Federally (Federally
Taxable) Taxable) Taxable) Taxable)
$400,785,000*
2021 13,300,000 1,745,000 875,000 1,285,000 1,305,000
Sale Date: October 2-3, 2019 2022 13,295,000 1,740,000 875,000 1,285,000 220,000 3,175,000
2023 13,285,000 1,740,000 875,000 1,285,000 225,000 4,445,000
Delivery Date: October 16, 2019 2024 13,285,000 1,740,000 875,000 1,285,000 1,790,000 4,205,000
2025 13,285,000 1,740,000 870,000 1,280,000 1,860,000 5,740,000
Interest Payment Dates: 2026 12,265,000 1,735,000 870,000 1,275,000 3,710,000
Semiannually each April 1 and 2027 12,270,000 1,735,000 870,000 1,275,000 3,080,000
2028 46,495,000 1,005,000 870,000 1,135,000 2,775,000
October 1, commencing on April 1,
2029 12,270,000 1,005,000 865,000 1,135,000 1,615,000 3,710,000
2020 2030 12,265,000 1,005,000 865,000 1,135,000 12,975,000 735,000
Denominations: $5,000 except for 2031 12,260,000 505,000 860,000 650,000 12,905,000 715,000
2032 12,260,000 505,000 860,000 650,000 12,825,000 695,000
the Series 2019B which will be 2033 12,255,000 505,000 860,000 650,000 12,670,000
issued in $1,000 denominations 2034 12,260,000 505,000 860,000 650,000
2035 12,255,000 505,000 860,000 650,000
Bond Ratings: Aaa/AAA/AAA 2036 10,845,000 310,000 650,000
Optional Redemption: To be
2037 6,340,000 650,000
2038 6,340,000 650,000
determined* 2039 6,335,000 650,000
2040 6,335,000 650,000
*Preliminary, subject to change Total $ 259,500,000 $ 17,715,000 $ 13,320,000 $ 18,875,000 $ 57,085,000 $ 34,290,000
13IBDROOT\PROJECTS\IBD-NY\COLUMBUSGO2019\641549_1\03 - Presentations\Investor Presentation\2019 City of
Columbus Investor Presentation v8.pptx
Timeline*
September October
S M T W T F S S M T W T F S
1 2 3 4 5 6 7 29 30 1 2 3 4 5
8 9 10 11 12 13 14 6 7 8 9 10 11 12
15 16 17 18 19 20 21 13 14 15 16 17 18 19
22 23 24 25 26 27 28 20 21 22 23 24 25 26
29 30 1 2 3 4 5 27 28 29 30 31 1 2
Holiday Post POS & Launch Campaign Pricing Closing
Item Date Goldman Sachs Underwriting Contacts:
Bond Ordinance Approved by the
City Council
September 9 Bill Daley, Managing Director
Ratings Received September 16 William.daley@gs.com
Distribute POS September 18 312-655-5175
Distribute Roadshow September 20
Retail Order Period October 2 Mark Somers, Vice President
Institutional Pricing October 3 Mark.somers@gs.com
Closing October 16 212-357-7252
*Preliminary, subject to change
14IBDROOT\PROJECTS\IBD-NY\COLUMBUSGO2019\641549_1\03 - Presentations\Investor Presentation\2019 City of
Columbus Investor Presentation v8.pptx
15You can also read