Thames River Water Quality 2017 - City of London
←
→
Page content transcription
If your browser does not render page correctly, please read the page content below
Thames River Water Quality 2017
City Of London

Environment and Engineering Services

June 2018

Purpose: To present information on the water quality of the Thames River for 2017.
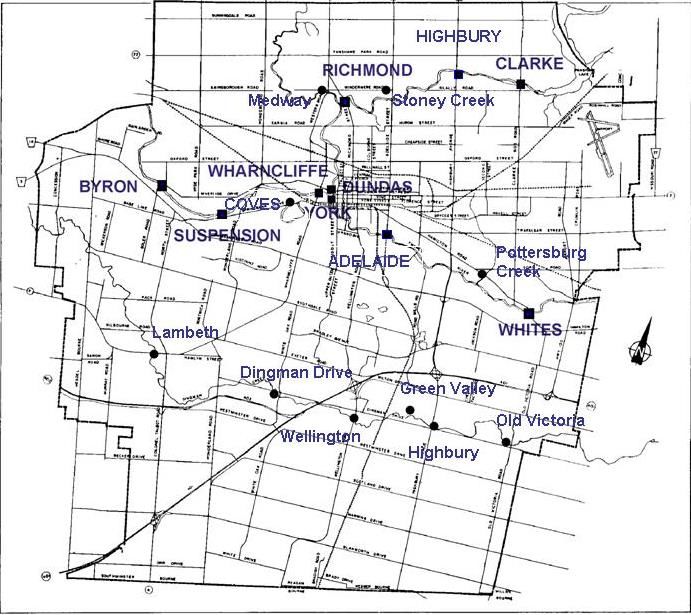
Executive Summary

Thames River surface water quality criteria were met or bettered in 11 of 16 Ministry of
Environment’s surface water quality objectives. Of the five that did not meet the
objectives, E. Coli concentrations were exceeded downstream at Byron during the
disinfection period but are not attributable to the wastewater treatment plant effluents.
The Total Coliform levels leaving the city are lower than those entering during the
disinfection period of April 1 to September 30. Overflows from sanitary sewers to storm
sewers (to prevent basement flooding) and bypasses of raw sewage at wastewater
treatment plants would contribute to the increased coliform counts. Phosphorous
increased in the Thames River as it passed through the City due to sources such as
fertilizers, residual phosphorus in the effluent from the City’s treatment plants and storm
water runoff. Wastewater treatment plants remove more than 95% of raw sewage
phosphorous. Individual practices do impact the Thames River and public education on
the impacts and what can be done by residents to help are beneficial. Nitrate increased
in the Thames River as it passed through the City. Sources are fertilizers and
wastewater treatment. The Wastewater treatment plants convert ammonia which is toxic
to fish to nitrates. Levels of aluminium were higher than the objective upstream of the
City in the three year average. The 2017 levels were below the objective.

Context

The City of London is responsible for the treatment of sewage and conveyance of storm
water to the Thames River. This report provides information of the effects on the
Thames River by the City.

Discussion

The Thames River is sampled on a regular monitoring programme at ten locations. The
parameters analysed include biochemical oxygen demand (BOD), pH, temperature,
dissolved oxygen, total phosphorous, ammonia, bacteriological quality, suspended
solids, chlorides, nitrates, nitrites, and conductivity. Heavy metals are sampled at
Clarke/Highbury, Whites, and Komoka bridges. The sampling locations are shown on
the attached map.

Water quality in the Thames River has improved significantly since river monitoring was
initiated in 1963. The dissolved oxygen levels have increased. Wastewater treatment
has improved from 90% efficiency in the 1960's to the present where 99% of the BOD is
removed. London's plants perform better than typical wastewater secondary treatment
processes that have a removal efficiency of between 85% and 95% for BOD.
Furthermore, in 2017, the City of London wastewater treatment plants removed 98% of
the suspended solids and 95% of the phosphorous.

There are pamphlets on Toilets are not garbage cans, Food waste grinders, Sinks are
not garbage cans, Grease management for your home and videos. There is a pamphlet
on Grease management for Restaurants and Best Management Practices for
Automotive Service facilities.

Benthic sampling of river bottom species in the Thames River in 2013 indicated that the
river quality was fairly poor to very good based on the Family Biotic Index. Results were
fairly poor on the Thames River at Clarke to very good on the Thames River at the
Springbank walking bridge. Benthic monitoring reports are on the City website.

Benthic sampling was also done on Dingman in 2013. Dingman was sampled at eight
sites and using the Family Biotic Index were fair at Old Victoria, very poor at Highbury,
poor at Green Lane and Wonderland, very poor at White Oak Road, Colonel Talbot and
Lambeth.

A listing of parameters (Appendix A) indicates annual average values and surface water
criteria. Comments on noteworthy parameters are as follows:

Suspended Solids

The weighted average concentration of suspended solids discharged from the WWTP’s
in 2017 was 6 mg/L. The average background level of suspended solids levels in the
river was 14 mg/L in 2017 upstream of the City. Suspended solids are a concern due to
potential for covering of spawning beds and bottom dwelling organisms.

Phosphorous

The MOECC objective has been based on preventing algae blooms. Phosphorous
levels in the Thames River are unfavourable in that they exceed the surface water
quality objective by a factor of 3.1 in 2017 entering London, and by a factor of 4.0
downstream of London. Phosphorous promotes algae and excessive plant growth; there
would be aesthetic benefits in reducing phosphorous levels in the Thames River. In
2015 ortho (dissolved) phosphorous measurement started. In 2017, the dissolved
phosphorous was 0.038 mg/L entering the city and 0.049 mg/L downstream of the City.

The City currently treats its sewage to reduce phosphorous levels to less than current
Ministry of Environment and Climate Change Environmental Compliance Approval
criteria which vary from 0.5 to 1.0 mg/L. The weighted average phosphorous effluent
level from London's PCP’s in 2017 was 0.44 mg/L.

Based on an average for the period 2013 to 2017 inclusive, 84% of phosphorous
loading in the Thames River originates upstream of London. The City of London PCP’s
contribute about 13.6% and other city sources contribute 3.4% of the phosphorous
loading on an annual basis. There are seasonal variations for phosphorous loading in
the Thames River. In the summer, the Wastewater treatment plant loading contribution
increases to 39% of the load due to decreased river flows. Other sources within London
contributed 11% of the load in the spring.
The sewage treatment plants have on average removed 93% of phosphorous in
sewage.

The Ministry of the Environment and Climate Change has targeted phosphorous for
further reduction and are taking actions to reduce discharges. As illustrated in the
graph above, London Wastewater Treatment Plants contribute up to 39% to the already
high background levels in the summer but other sources within London contribute about
11% of the load as well during the spring. The City has committed to gradually reduce
its phosphorus limits from its treatment plants over the next 20 years through the
Discharge Strategy. The Draft Action Plan for phosphorous reduction in Lake Erie goal
is to reduce loading by 40% and WWTP’s to reduce phosphorous concentrations to 0.5
mg/L.

Contributors of “other city sources” for phosphorous is fertilizers applied to lawns, birds
and pets faeces and organic sources. Reducing the practice of applying fertilizers prior
to rain storms and minimizing phosphorous based fertilizers would decrease
phosphorous contributions to the Thames River. Managing phosphorous in rural areas
is problematic. A high percentage of the loading from rural areas occurs during
significant snow melt/rain events. In February 2018, there were peak flows of 1,000 m3
per second in the Thames River near Byron. The flow for the 4 days of peak flows was
estimated to be about 10% of the annual flow (based on 2017 flow data) and sample
analysis for phosphorous was 0.35 mg/L. The phosphorous loading was estimated to
be about 21% of the annual phosphorous loading of 342 tonnes in the Thames River.
This shows the significant impact of peak flows to phosphorous loadings.

Bacteriological Quality

Bacteriological quality standards are set to prevent diseases and infections for activities
such as swimming and bathing. The Escherichia Coli (E. Coli) is the dominant organism
in human faeces but is also found in faeces of birds and mammals. E. Coli is used as an
indicator organism for pathogens. Total Coliforms are also an indicator of pathogens,
but Total Coliforms can also be derived from sources other than sewage and faecal
matter. To improve bacteriological quality the City is required to disinfect its wastewater
treatment plant effluent during the period of April 1 to September 30 each year (the
disinfection season). The following observations are related to the disinfection season:

Total Coliform quality in the Thames River, both entering and leaving the City, has
consistently failed to meet surface water quality objectives. The bacteriological quality of
effluent from the City of London PCP’s (629 organisms per 100 millilitres) was better
than the quality entering the city for Total Coliforms, and 63% of the surface water
quality objective (1,000 MPN per 100 millilitres) for the disinfection period (April 1 to
September 30) in 2017. The Ultra Violet light disinfection is installed at all of the City's
plants. Despite the superior quality of WWTP effluents, the Total Coliform levels leaving
the City are higher than those entering.

The geometric mean in 2017 during the disinfection period for E. Coli was greater than
the surface water criteria entering and leaving the City of London. The bacteriological
quality of effluent from London’s PCP's was about 63% of the surface water quality
objective for E. Coli in 2017 for the disinfection period. The E. Coli level in the Thames
River at the Byron Bridge were similar to upstream of the City during the disinfection
period.

Un-Ionized Ammonia

The surface water objective for un-ionized ammonia is set for the protection of aquatic
life. Excessive levels can be toxic.

Un-ionized ammonia levels in the Thames River met the surface water quality objective
at Whites, Clarke/Highbury, Byron, and Komoka bridges in 2017.

Sources of ammonia are domestic sewage and fertilizers. The City’s WWTP’s nitrify
sewage to reduce ammonia in order to meet Ministry of Environment criteria.

Nitrates

There is no Ontario surface water criterion for nitrates; however, there is a drinking
water criterion of 10 mg/L. The “Canadian Council of Minister of the Environment
(CCME) Water Quality Guidelines” for nitrate is 13 mg - NO3/L. There are a number of
ways to report nitrates in the literature and the City of London reports nitrates as mg
NO3 – N/L following Standard Methods. The CCME nitrate standard would have to be
divided by 4.43 to compare with City of London monitoring data (a CCME limit of 2.9 mg
NO3 – N/L). Nitrate levels averaged 5.9 mg/L entering and 6.2 mg NO3-N/L leaving the
City, with peaks as high as 10.0 mg NO3-N/L entering the city on the south branch, 9.5
mg NO3-N/L on the North Branch and 9.3 mg NO3-N/L leaving the City occurred in
2017. Nitrate levels are higher in the winter than in the summer due to uptake by
bacteria in the summer. The weighted average for nitrates discharged from London’s
sewage treatment plants is 15.1 mg NO3-N/L. Levels of Nitrates entering and leaving
the City of London in the Thames River are higher than the CCME surface water quality
guideline. The acute toxicity level for nitrates at the 5th percentile is 61 mg NO3 – N/L
indicating that acute toxicity is not an issue in the Thames River. The long term impact
data is based on the Maximum Acceptable Toxicant Concentration (MATC). The MATC
for lake trout is 3.1 mg NO3-N/L due to delay of sac fry to the swim-up stage. Lake trout
are found in cold deep lakes and rarely enter rivers. Levels of nitrate in Lake Huron and
Lake Erie range from 0.2 to 0.8 mg NO3-N/L based on City of London water supply
data. This indicates that nitrates would not be an issue in Lake Huron or Lake Erie for
lake trout. The MATC for Rainbow trout is 8.6 mg NO3-N/L due to delay of sac fry to the
swim-up stage. Rainbow trout are found in lakes, and move to rivers and streams in the
spring and fall. Steelhead trout (type of rainbow trout) are found in London streams and
on the North branch up to Fanshawe Dam and downstream of London. The average
concentration of nitrates in the spring and fall between 2013 and 2017 inclusive is less
than 5.4 mg NO3-N/L in the Thames River entering or leaving the City of London. The
next lowest MATC is 30 mg NO3-N/L for the water flea which would not be an issue in
the Thames River.

Bypasses and Combined Sewer Overflows to the Thames River
Bypasses at Wastewater Treatment Plants

Wastewater Treatment Plants effectively treat raw sewage, however; during rain events,
flows exceed capacity of the treatment plants. The City's long term strategy is to reduce
overflows; however, the challenge is the significant variability in the flows.

The City of London (City) initiated a Pollution Prevention and Control Plan (PPCP) in
2012 as part of its ongoing efforts to improve the performance of the City’s sanitary and
storm sewer infrastructure. SSOs and other bypasses from sanitary pumping stations
and wastewater treatment plants (WWTPs) that exist in the system were originally built
to protect homes from basement flooding caused by the inflow and infiltration of
excessive amounts of storm water. The discharge from these SSOs and bypasses was
directed to receiving water bodies including the Thames River, Dingman Creek,
Medway Creek, Pottersburg Creek, and the Coves. The primary objective of this PPCP
is to develop an implementation plan for a long-term solution that will limit the volume
and frequency of untreated wastewater discharges to the receiving streams from
various SSOs and bypasses throughout the City, while maintaining an acceptable level
of service and protection against basement flooding.
The PPCP is being implemented in three phases. Phase 1 was completed in 2014 and
included background review and an inventory of existing SSOs and water quality data.
Phase 2 was completed in 2017 and included benthic and water quality characterization
of the Thames River, as well as twelve hydrologic and hydraulic modelling assignments
to determine the frequency and annual overflow volume of each SSO. A prioritized list
of six pumping station bypasses and six groups of SSOs was identified as part of Phase
2 of the PPCP. Phase 3 of the PPCP is currently being finalized and involves a review
of alternative strategies to mitigate the prioritized pumping stations and SSOs. An
implementation plan will be developed as part of Phase 3, including costs and schedule
for the recommended projects and mitigation strategies. The Phase 3 of the PPCP was
completed in March 2018. The Notice of completion for submission of comments was
June 14, 2018. The PPCP will be updated every five to ten years in accordance with
the Municipal Engineers Association Municipal Class Environmental Assessment
document (as amended in 2015), for Master Plans.

Summary

   1. Public information on the impacts of daily activities on the quality of the Thames
      River can be seen on the City of London web site.
   2. Phosphorous, Aluminum and Bacteriological quality are the parameters that
      exceed surface water criteria in the Thames River.
   3. The CCME surface water criterion for nitrates is not being met in the Thames
      River.

Acknowledgements

This report was prepared by Anthony Van Rossum, Environmental Services Engineer,
Wastewater Treatment Operations, with data obtained by the City Monitoring Program,
the MOE/UTRCA monitoring and river flow data from UTRCA/Environment Canada.
Table 1 – Bypass and overflow summary for wastewater treatment plants and pumping stations
Year Treated Raw Number of raw Secondary Number of Percent of raw Annual
Wastewater in bypass bypass or bypass in secondary bypass or rainfall in
Million litres in million overflow million litres bypass or overflow to millimeters
litres occurrences overflow treated flow
occurrences
2002 75,150 225 32 567 11 0.30% 861
2003 74,385 285 99 365 40 0.38% 985
2004 77,304 375 106 679 47 0.48% 964
2005 75,150 225 74 566 26 0.30% 868
2006 83,075 201 99 862 33 0.24% 1,202
2007 71,874 24 36 227 19 0.03% 771
2008 78,979 219 70 1,033 38 0.28% 1,094
2009 74,557 158 60 901 22 0.21% 931
2010 70,426 47 38 123 17 0.07% 931
2011 84,793 375 94 1,630 31 0.44% 1,165
2012 67,865 4 6 41 6 0.01% 660
2013 76,160 249 55 765 20 0.33% 1,075
2014 72,351 72 39 142 13 0.10% 956
2015 65,709 56 40 208 11 0.08% 687
2016 70,786 67 40 148 15 0.10% 929
2017 72,427 50 27 248 16 0.07% 914
Average No Data 165 57 532 23 No Data No DataAppendix A
Annual averages of water quality in milligrams per litre (mg/L) in the Thames River for
Upstream (average of Clarke & Whites) and Komoka bridges are as follow in the table
below:
Parameter Moe Upstream Upstream Downstream Downstream Average
Surface 2017 3 Year (Komoka (Komoka Met
Water average Bridge) 2017 Bridge) 3 Year Objective
Criterion average
Suspended No Data 14 11 17 15 No Data
Solids
BOD 4.0 1.8 1.7 2.6 2.2 Y
Dissolved 4.0 11.9 10.6 11.8 10.3 Y
Oxygen
Total 0.03 0.09 0.10 0.12 0.13 N
Phosphorous
Ortho 0.038 0.043 0.049 0.050 No Data
Phosphorous
Un-ionized 0.019 0.004 0.003 0.003 0.003 Y
Ammonia
Nitrates** 2.9 5.9 4.2 6.2 5.0 N
Total 1,000 6,900 8,500 13,200 10,500 N
Coliforms *xx
E. Coli *xx 100 104 81 110 85 N
Iron 0.30 0.044 0.0561 0.049 0.052 Y
Manganese 0.050 0.011 0.012 0.005 0.005 Y
Aluminum 0.075 0.060 0.078 0.053 0.064 N
Cadmium 0.0002 L0.0002 L0.0002 L0.0002 L0.0002 Y
Chromium 0.100 L0.001 L0.001 L0.001 L0.001 Y
Copper 0.005 0.001 0.001 0.002 0.002 Y
Nickel 0.025 0.004 0.004 0.004 0.004 Y
Lead 0.025 L0.002 L0.002 L0.002 L0.002 Y
Zinc 0.030 0.002 0.002 0.004 0.005 Y
* Results during Disinfection Season (April 1 to September 30) - units are defined as
most probable number (MPN) per 100 mls.
** There is no MOE surface water criterion but the Canadian Council of Ministers of the
Environment (CCME) has a criterion of 2.9 mg/L Nitrate as N.
L in the table means less than
xx The 2017 weighted geometric mean for the wastewater treatment plants effluent for
the disinfection period was 629 most probable number (MPN) per 100 mls. for Total
Coliforms and 63 most probable number (MPN) per 100 mls. for E. Coli.Denotes monitoring site on the Thames River Denotes monitoring site on a creek
You can also read