2018 SUMMARY OF AMBIENT AIR QUALITY MONITORING - CHEAKAMUS CROSSING AMBIENT AIR QUALITY MONITORING STATION - Resort ...
←
→
Page content transcription
If your browser does not render page correctly, please read the page content below
RESORT MUNICIPALITY OF WHISTLER

2018 SUMMARY OF AMBIENT AIR
QUALITY MONITORING
CHEAKAMUS CROSSING AMBIENT AIR
QUALITY MONITORING STATION

APRIL 11, 2019
2018 SUMMARY OF
AMBIENT AIR QUALITY
MONITORING
CHEAKAMUS CROSSING
AMBIENT AIR QUALITY
MONITORING STATION
RESORT MUNICIPALITY OF WHISTLER

PROJECT NO.: 171-03296-01
DATE: APRIL 11, 2019

WSP CANADA INC.
SUITE 1000
840 HOWE STREET
VANCOUVER, BC, CANADA V6Z 2M1

T: +1 604 736-5421
F: +1 604 736-1519
WSP.COM
File Number: 171-03296-01

                                RESORT MUNICIPALITY OF WHISTLER
                                4325 Blackcomb Way
                                Whistler, BC V0N 1B4

                                Attention: Mrs. Chelsey Roberts
                                Dear Mrs. Roberts:
                                Subject:    Summary of 2018 Ambient Air Quality Monitoring, Cheakamus Crossing
                                            Neighborhood
                                WSP Canada Inc. (WSP) is pleased to provide the Annual Ambient Air Monitoring Report for the
                                Resort Municipality of Whistler for 2018. The report outlines the monitoring program conducted
                                during 2018 and compares the data to current objectives.

                                Yours sincerely,

                                Braden Bartnik, B.Sc., CPESC
                                Air Quality Specialist, Environment

SUITE 1000
840 HOWE STREET
VANCOUVER, BC, CANADA V6Z 2M1

T: +1 604 736-5421
F: +1 604 736-1519
wsp.com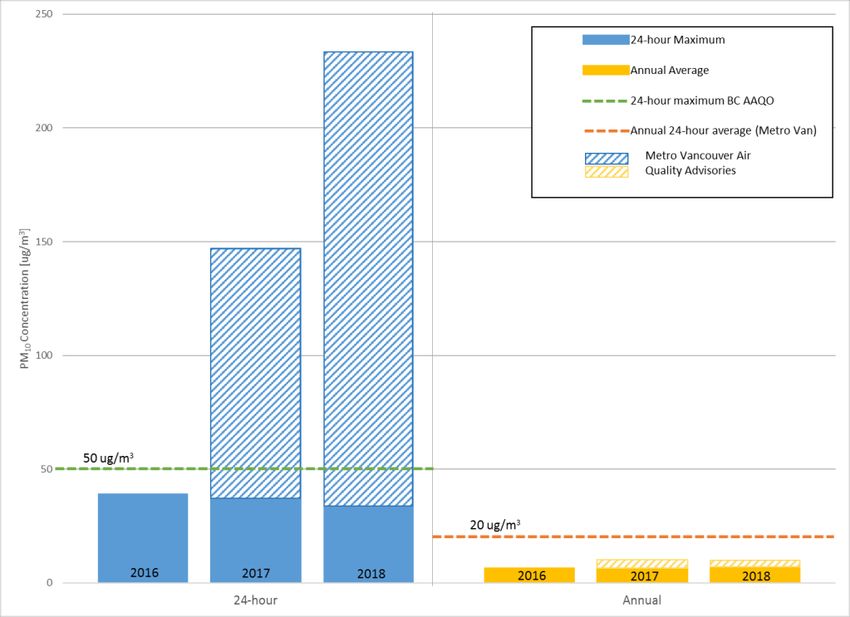
TABLE OF                               1         INTRODUCTION ............................................. 1

CONTENTS                               2         STATION DETAILS ......................................... 1
                                       2.1       2018 Station Maintenance and Audits ......................... 4

                                       3         DATA SUMMARY ........................................... 5

                                       3.2
                                       3.1       Wind Direction and Wind Speed .................................. 5
                                                 PM10 Concentrations ..................................................... 6

                                       4         CONCLUSION ................................................ 9

                                       BIBLIOGRAPHY ...................................................... 10

2018 SUMMARY OF AMBIENT AIR QUALITY MONITORING                                                                                 WSP
Project No. 171-03296-01
RESORT MUNICIPALITY OF WHISTLER                                                                                            Page ii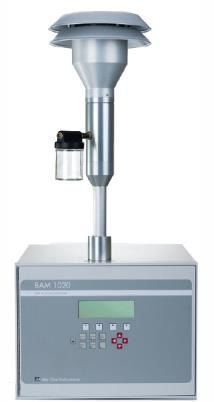
TABLES
TABLE 1     MAXIMUM AND ANNUAL PM10 DATA
            .............................................................8

FIGURES
FIGURE 1     HIGH PERFORMANCE CENTRE
            (HPC) IN CHEAKAMUS CROSSING
            NEIGHBOURHOOD ............................1
FIGURE 2     LOCATION OF THE MONITORING
            STATION IN THE CHEAKAMUS
            CROSSING NEIGHBOURHOOD
            (SHOWN AS A RED STAR) ................2
FIGURE 3    BAM MONITOR WITH PM10 INLET
            SYSTEM ..............................................3
FIGURE 4    TRIPOD MOUNTED ANEMOMETER
            AND BAM INLET LOCATED ON THE
            ROOF OF THE HPC BUILDING .........3
FIGURE 5    HISTORICAL WINDROSE OF THE
            CHEAKAMUS CROSSING
            ANEMOMETER DATA, JANUARY
            1ST, 2011 TO DECEMBER 31ST,
            2016 .....................................................5
FIGURE 6    WINDROSE OF THE CHEAKAMUS
            CROSSING ANEMOMETER DATA,
            JANUARY 1ST, 2017 TO DECEMBER
            31ST, 2017 ..........................................6
FIGURE 7    PM10 MONTHLY AVERAGE, 24-HOUR
            MAXIMUM, AND 1-HOUR MAXIMUM
            CONCENTRATIONS ...........................7
FIGURE 8    PM10 24-HOUR MAXIMUM DATA
            COMPARED TO BC AAQOS AND
            ANNUAL AVERAGE DATA
            COMPARED TO METRO
            VANCOUVER OBJECTIVES. .............8

APPENDICES
A     MOE AUDIT REPORTS

                                                                             Page iii
1 INTRODUCTION
WSP has operated and maintained the Cheakamus Crossing Ambient Air Monitoring Station on behalf of the Resort
Municipality of Whistler (RMOW) since September, 2010. The station was installed to assist in addressing local
citizen’s concerns of potential ambient air quality issues associated with an asphalt plant located near the
neighbourhood. The station originally monitored ambient particulate matter less than 2.5 microns (PM 2.5). As of
January 8th 2016, the station was upgraded from a TEOM unit (Tapered Element Oscillating Microbalance) to a BAM
unit (Beta Attenuation Mass Monitor) and switched to continuously monitor ambient particulate matter less than 10
microns (PM10). WSP provides public access to the monitoring data via a dedicated website. This report summarizes
the data from the monitoring station for the calendar year of 2018 (January 1st 2018, to December, 31st 2018).
2 STATION DETAILS
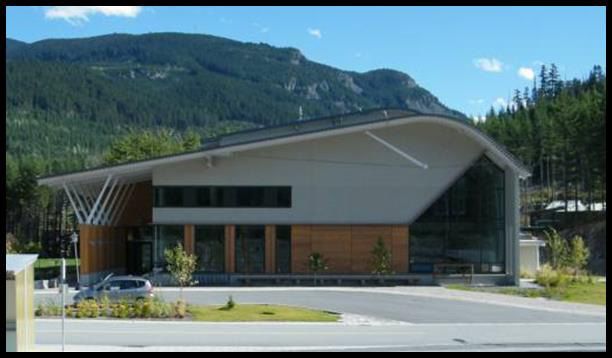
The Cheakamus Crossing Ambient Air Monitoring Station is located on the High Performance Centre (HPC) building
(Figure 1). The HPC building was selected for the monitoring site because:
the HPC building is one of the closest structures to the property currently occupied by the asphalt plant;
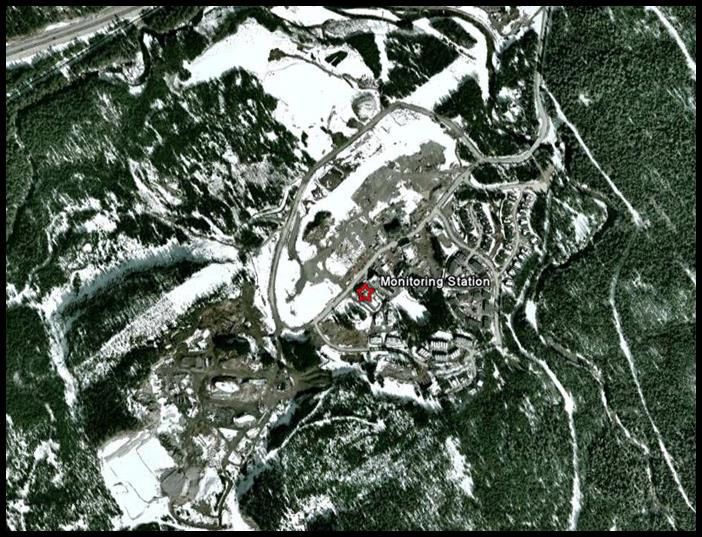
the HPC building is located in the Cheakamus Crossing neighbourhood (Figure 2) and provides a suitable location
to record representative measurements of particulate matter concentrations in the neighbourhood;
the location minimizes interference from surrounding buildings or vegetation;
the monitoring station’s indoor sensors/controllers as well as the rooftop equipment are safely accessible for
routine maintenance and cleaning; and,
the HPC building is a secure location to house the monitoring station, as it contains sensitive/expensive scientific
equipment.
Figure 1 High Performance Centre (HPC) in Cheakamus Crossing Neighbourhood
Page 1Figure 2 Location of the Monitoring Station in the Cheakamus Crossing Neighbourhood (shown as a
red star)
The monitoring equipment at the station includes:
BAM-1020 Beta Attenuation Mass Monitor (BAM) (Figure 3)
R.M. Young 05305 Air Quality Wind Anemometer
The BAM-1020 Beta Attenuation Mass Monitor automatically measures and records airborne particulate
concentration levels using the principle of beta ray attenuation. This method provides a simple determination of
concentration in units of micrograms of particulate per cubic meter of air. The BAM has been recognized by the US
EPA as an acceptable continuous monitor of particulate matter concentrations (August, 1998). This unit is outfitted
with a PM10 inlet directly connected onto the inlet tube. Ambient air is pumped through the inlet, which only allows
airborne particulate matter with an aerodynamic diameter of 10 micrometers (10 µm = 0.00001 meters) or less into
the BAM’s sensor unit. The BAM collects the ambient dust on a filter tape from a measured amount of ambient air
which causes an attenuation of the beta particle signal. The degree of attenuation of this beta particle signal is used to
determine the mass concentration of particulate matter on the filter tape, and hence the volumetric concentration of
particulate matter in ambient air (µg/m³).
PM10, also known as inhalable particulate, is so small it can only be detected with an electron microscope. Sources of
this fraction of particles include motor vehicles, wood burning stoves and fireplaces, dust from construction and
industrial sources and windblown dust from erosion. PM 2.5, the fraction of particulate that was previously monitored
at the station, is a smaller subset of PM10, and is included in the particulate measured as PM 10. The sources of this
smaller subset would include all types of combustion, including motor vehicles, power plants, residential wood
burning, forest fires, agricultural burning, and some industrial processes
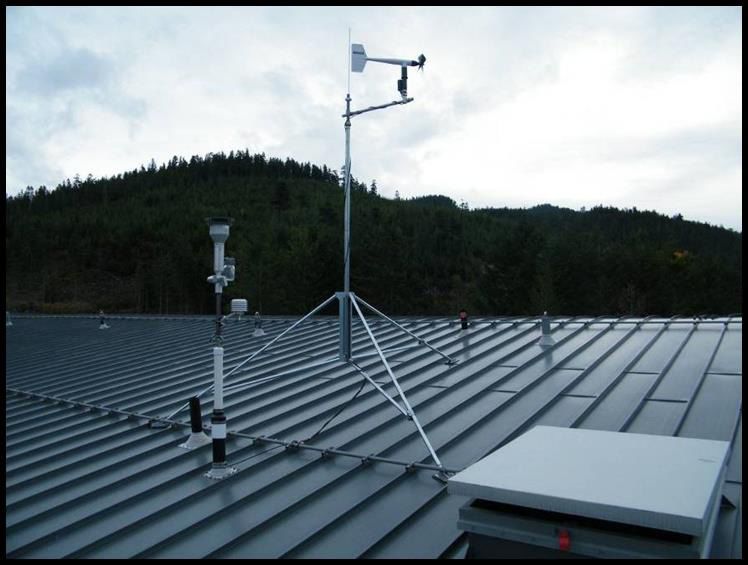
The R.M. Young anemometer was installed to determine hourly wind direction and speed, which is useful in
interpreting the particulate matter concentrations recorded at the monitoring station. The anemometer is mounted on
a 10-foot tripod installed on the roof of the HPC building in the Cheakamus Crossing Neighbourhood adjacent to the
BAM inlet (Figure 4).
The datalogger records 1-hour averages for both the BAM and anemometer data to an onsite computer system. Along
with storing the data on the onsite computer system, data is also transferred to WSP’s Air Quality website
(www.airquality.ca/clients/Whistler) where it is displayed in ‘real-time’. A link to this site is provided on the RMOW
website (www.whistler.ca)
Page 2Figure 3 BAM Monitor with PM10 Inlet System
Figure 4 Tripod Mounted Anemometer and BAM Inlet located on the Roof of the HPC building
Page 32.1 2018 STATION MAINTENANCE AND AUDITS
WSP has consulted with the British Columbia Ministry of Environment (BC MOE) and follows the same maintenance
and calibration standards by which the BC MOE operates their provincial system of ambient air monitoring stations.
WSP and the RMOW coordinated with the BC MOE to have the Cheakamus Crossing Ambient Air Monitoring Station
audited by the BC MOE’s provincial auditing team. This team conducts semi-annual audits on all of the BC MOE
stations to validate the proper operation of the equipment. During 2018, the MOE conducted an audit on February 1st
and August 16th. All the audited parameters passed and a copy of the audit report can be found in Appendix A.
WSP completed twelve (12) site visits (monthly) during 2018 to complete necessary audits, calibrations and
maintenance on the monitoring equipment. The maintenance/calibration and verification schedule for the monitoring
station are the recommended standards.
Page 43 DATA SUMMARY
Data collection began at the station on September 3rd, 2010 for PM2.5 data and on September 15th, 2010 for the wind
data. As of January 2016, the TEOM was replaced by the BAM which now records PM10. The BAM and anemometer
continuously collect data. The monthly equipment maintenance results in the system being offline for short periods of
time. A report was presented in December 2010 summarizing the first 3 months of monitoring data (September 15 th,
2010 to November 30th, 2010) and details on the station installation. Annual reports have been presented following
each year of data collection. A summary report was also published in 2015 which consolidated the four years of data
collected until that point.
This report summarizes the data collected for the calendar year of 2018 (January 1st, 2018 to December 31st, 2018).
This is the third full year of collecting PM10 data with the BAM unit so the annual data is compared to the 2016 and
2017 data. A summary of PM2.5 data collected from 2011-2015 is available in previous annual reports.
3.1 WIND DIRECTION AND WIND SPEED
A wind rose was created using the wind data collected onsite for 2018 (Figure 6). Wind roses are used to display the
frequency of wind speed at wind direction. The annual windrose is similar in wind direction and speed when compared
to the historical wind data (Figure 5). Winds typically show a dominant wind path dictated by the topography of the
site. The dominant direction of wind at the station continues to be from the west. This was also the direction that
recorded the highest wind speeds. Winds from the southwest and south-southwest have the greatest potential to
transport emissions directly from the asphalt plant towards the monitoring station. These winds occurred
approximately 3.2% of the time over the 2018 monitoring period (slightly less then 2017).
Figure 5 Historical Windrose of the Cheakamus Crossing Anemometer Data, January 1st, 2011 to
December 31st, 2017
Page 5Figure 6 Windrose of the Cheakamus Crossing Anemometer Data, January 1 st, 2018 to December 31st,
2018
3.2 PM10 CONCENTRATIONS
The continuous monitoring data from the BAM unit was used to calculate 1-hour average PM10 concentrations. From
these hourly averages a rolling 24-hour average is calculated using the last 24 hourly averages at each hour of the data
set. The rolling 24-hour average displayed on the WSP and RMOW website provides a ‘real-time’ representation of
current conditions but is not compared to the provincial objectives. When comparing the results to the British
Columbia Ambient Air Quality Objectives (BC AAQO, 50µg/m3), a daily 24-hour average (midnight to midnight),
also referred to as block average is used.
Figure 7 displays the monthly breakdown of the 24-hour block averages and maximums, along with the hourly
maximum. The BC AAQO is shown in Figure 7 by the green line. This is compared to the 24-hour maximum recorded
during each month (blue squares). The other data displayed in the figure is the monthly average (yellow column) and
the 1 hour maximum (red circles).
Although a direct comparison can only be made between the BC AAQO (green line) and the 24-hour maximum (blue
square), the other data can also show trends. There is no objective for hourly data but you can see in Figure 7 that
during the drier months of the year there is higher hourly particulate matter levels.
The yellow columns, which displays the monthly average, peak during the summer months (July, August, September)
which would be expected as that is the driest time of the year. However, during 2018, the PM10 levels in the airshed
were heavily influenced by smoke from forest fires burning across the region and province. The effects of the smoke
from the forest fires acutely affects the 24-hour maximum values (blue squares) and 1-hour maximums (red circles)
reported in Figure 7, but also impacts the monthly average (yellow column). Air quality advisories were issued
throughout the summer months due to the forest fire smoke.
Page 6Figure 7 PM10 Monthly Average, 24-hour Maximum, and 1-hour Maximum Concentrations
During August and September there were multiple Air Quality Advisory’s (AQA) issued by Metro Vancouver due to
elevated ambient air quality levels as the result of regional forest fires. (August 10 th to 11th, 13th to 27th, and Sept 7th).
These elevated particulate matter levels are dissociated from local activities, such as impacts from the asphalt plant,
and therefore an analysis where these periods are removed from the data set is also provided so that an evaluation of
the data without the impacts of forest fires can also be provided. For the 18 days removed from the data set due to
AQAs from regional forest fires, 8 of them were above the Air Quality Objective (AQO = 50µg/m3) and the 24-hour
average ranged from 14 to 234 µg/m.3 When the data from these periods is excluded the 24-hour maximum is
significantly reduced in the months impacted. Excluding the impacts of the forest fire periods, the 24-hour maximum
recorded in 2018 is below the BC AAQO and comparable to previous years 24-hour maximum (Table 1).
There is no provincial or federal annual objective for PM 10, but the Metro Vancouver region does currently have an
objective level of 20 µg/m³ for annual average PM10. This objective was included in Table 1 to provide a comparison.
The annual average of PM10 at the Cheakamus Crossing monitoring location was 9.9 µg/m³ for 2018 which is well
below the Metro Vancouver objective. When the data collected during the air quality advisory periods is removed
from the dataset this annual average is even lower (7.2 µg/m³) and is similar to previous annual averages.
Figure 8 shows the 24-hour maximums as well as the annual average for 2016-2018. The hashed portion of the
columns indicates the impact of the forest fire smoke on the annual statistics.
Page 7Table 1 24-hour Maximum and Annual PM10 Data Summary
PM10 (µG/M3)
MAXIMUM BC AAQO ANNUAL METRO
YEAR
(24-HOUR) (24-HOUR) AVERAGE (24H) VANCOUVER
AAQO (24-
HOUR ANNUAL
AVERAGE)
2016 39.3 6.8
147.1 10.2
2017
37.2* 50 6.8* 20
233.6 9.9
2018
32.8* 7.2*
*Dates listed as Air Quality Advisories by Metro Vancouver were removed from the data sets.
Figure 8 PM10 24-hour Maximum Data Compared to BC AAQOs and Annual Average Data compared to
Metro Vancouver Objectives
Page 84 CONCLUSION
WSP has operated and maintained the Cheakamus Crossing Ambient Air Monitoring Station on behalf of the Resort
Municipality of Whistler (RMOW) since September, 2010. The station was installed to address the concerns of
potential ambient air quality issues associated with an asphalt plant located near the neighbourhood. After over five
years of monitoring PM2.5, in 2016 the RMOW decided to investigate another particulate matter fraction (PM 10)
typically associated with fugitive dust emissions by installing a new particulate matter monitor. Data from the historic
PM2.5 monitoring at the Station can be found in previous annual reports. The PM 10 data from the monitoring station
for the calendar year of 2018 was summarized in this report.
The dominant wind direction recorded at the monitoring station continues to be from the west. Winds from the
southwest and south-southwest have the greatest potential to transport emissions from the asphalt plant directly
towards the monitoring station.
In 2018, the 24-hour maximum PM10 concentration was 233.6 µg/m³ which exceeded the BC air quality objective of
50 µg/m³. However, this maximum was recorded in August during an air quality advisory issued due to regional forest
fire smoke. When the elevated particulate matter data during air quality advisories related to the forest fires is excluded
from the annual data the 24-hour maximum PM10 concentration was 32.8 µg/m³ which is below the BC air quality
objective. The annual average PM10 concentration was 9.9 µg/m³ which is below the Metro Vancouver regional annual
air quality objective of 20 µg/m³. When the elevated particulate matter data during air quality advisories related to
the forest fires is excluded from the data the annual average PM 10 concentrations drops to 7.2 µg/m³. Outside of the
impacts of the forest fire smoke, the 2018 data is comparable to the data collected from the previous two years.
Given the proximity of the monitoring station to the Cheakamus Crossing neighbourhood, it is likely that the values
recorded at the station are representative of the PM10 concentrations in the neighbourhood.
Page 9BIBLIOGRAPHY
British Columbia Ministry of Environment, 2016, British Columbia Ambient Air Quality Objectives, updated
December 16, 2016, https://www2.gov.bc.ca/assets/gov/environment/air-land-water/air/reports-
pub/aqotable.pdf , accessed [Feb, 2017]
Campbell Scientific, Inc., 2000, Operator’s Manual: CR510 Basic Datalogger.
Met One Instruments, Inc., 2008, BAM-1020 Continuous Particulate Monitor Operation Manual, Rev K
Metro Vancouver, 2016, Ambient Air Quality Objectives, updated June 30, 2016,
http://www.metrovancouver.org/services/air-
quality/AirQualityPublications/CurrentAmbientAirQualityObjectives.pdf, accessed [Feb, 2017]
Rupprecht & Patashnick Co., Inc., 2002, Operating Manual: TEOM® Series 1400a Ambient Particulate (PM-
10) Monitor (AB Serial Numbers), Revision B, March.
Page 10APPENDIX
A MOE AUDIT
REPORTSContinuous Ambient Monitor Audit Certificate
February 1, 2018
Station Name: Whistler Cheakamus Crossing Barometric Pressure: mmHg
Date:
Permit #: N/A AmbientTemperature: °C
710
M-Code: MA638
1.1
Auditors:
Method: K-Factor:
Chudak/Kubotani
Parameter: BAM PM10
Beta-Attentuation 1.016
Make/Model: MET ONE 1020 Flowmeter: Streamline
Serial #: T21162
Streamline Data
Parameter: PM10
Start Time: PST m: 0.4087
Total
Finish Time: PST b: -0.6171
1400
1409
Target ( 1 ) ( 2 ) ( 3 ) (Avg) Actual %Error
L/Min. In. H2O In. H2O In. H2O In. H2O L/Min.
Sample Flow: 16.700 5.81 5.81 5.82 5.81 16.24 -2.8%
Target flow is read from calibration screen
Pressure: mmHg
Ambient Temperature (Audit) Ambient Pressure (Audit)
Temperature: °C
Ambient Temperature (BAM) Ambient Pressure (BAM)
1.1 710
1.7 708
Leak Check: mmHg
Leak Flow:
Relative Humidity: %
Leak Offset:
Relative Humidity (Audit) NA 0.2
Relative Humidity (BAM) NA 0
Operational Parameters:
Cv: 0.966 Qo:
Audit Criteria:
ABS: 0.796 msw:
Sample Flow Error: -2.8% Pass 0
Temperature Error: BKGD:
0.312
0.6 Pass K: 0.986 -0.0024
Pressure Error: 2.00 Pass Flow Mode: Actual
0.35
RH Control ON: Yes
RH Set Point:
Leak Test: 0.2 Pass
Self-test: Pass Pass
Head Condition: Clean Pass
Report:
Air Audit Programme
Audit Results: Pass Knowledge Management BranchContinuous Ambient Monitor Audit Certificate
August 16, 2018
Station Name: Whistler Cheakamus Crossing Barometric Pressure: mmHg
Date:
Permit #: N/A AmbientTemperature: °C
712
M-Code: MA638
26.4
Auditors: Kubotani/Chudak
Method: Beta-Attentuation K-Factor:
Parameter: BAM PM10
0.932
Make/Model: MET ONE 1020 Flowmeter: Streamline
Serial #: T21162
Streamline Data
Parameter: PM10
Start Time: 1411 PST m: 0.4267
Total
Finish Time: 1430 PST b: -0.4932
Target ( 1 ) ( 2 ) ( 3 ) (Avg) Actual %Error
L/Min. In. H2O In. H2O In. H2O In. H2O L/Min.
Sample Flow: 16.700 4.98 5.00 5.10 5.03 16.59 -0.7%
Target flow is read from calibration screen
°C Pressure: mmHg
Ambient Temperature (Audit) Ambient Pressure (Audit)
Temperature:
Ambient Temperature (BAM) Ambient Pressure (BAM)
26.4 712
25.2 707
% Leak Check: L/min
N/A Leak Flow: 0.4
Relative Humidity:
N/A
Relative Humidity (Audit)
Relative Humidity (BAM)
Operational Parameters:
Sample Flow Error: -0.7% Pass Cv: 0.966 Qo:
Audit Criteria:
ABS: 0.796
0
µsw:
Temperature Error: 1.2 Pass BKGD: -0.0024
0.312
K: 0.986
Pressure Error: 5.00 Pass Flow Mode: Actual
Humidity Error: 0 Pass 0.35
RH Control ON: Yes
RH Set Point:
Leak Test: 0.4 Pass
Self-test: Pass Pass
Head Condition: Clean Pass
Report:
Air Audit Programme
Audit Results: Pass Regional Operations Branch,ComplianceYou can also read