ARCTIC BASEMAPS IN GOOGLE MAPS
←
→
Page content transcription
If your browser does not render page correctly, please read the page content below
ARCTIC BASEMAPS IN GOOGLE MAPS
J. Muggah1, D. Mioc2*
1
Department of Geodesy and Geomatics Engineering, University of New Brunswick, Fredericton, NB, Canada,
X3625unb.ca
2
Technical University of Denmark, DTU Space, Denmark, dmioc@space.dtu.dk
Commission VI, WG VI/4
KEY WORDS: Google Maps, Bathymetric data, Multi resolution images, Multibeam data processing
ABSTRACT:
The Ocean Mapping Group has been collecting data in the Arctic since 2003 and there are approximately 2,000 basemaps. In the
current online storage format used by the OMG, it is difficult to view the data and users cannot easily pan and zoom.
The purpose of this research is to investigate the advantages of the use of Google Maps, to display the OMG's Arctic data. The map
should should load the large Artic dataset in a reasonable time.
The bathymetric images were created using software in Linux written by the OMG, and a step-by-step process was used to create
images from the multibeam data collected by the OMG in the Arctic. The website was also created using Linux operating system.
The projection needed to be changed from Lambert Conformal Conic (useful at higher Latitudes) to Mercator (used by Google
Maps) and the data needed to have a common colour scheme.
After creating and testing a prototype website using Google Ground overlay and Tile overlay, it was determined that the high
resolution images (10m) were loading very slowly and the ground overlay method would not be useful for displaying the entire
dataset.
Therefore the Tile overlays were selected to be used within Google Maps. Tile overlays used for this project proved to be useful for
large datasets because they cut the image into many different tiles and load only the part of the image (tile) within the map window
bounds.
1. INTRODUCTION In the past few years, with the introduction of simple, and
mostly free or inexpensive web-based geographic information
The Ocean Mapping Group (OMG) at the University of New systems (e.g. Google Maps, Yahoo Maps, Microsoft’s Virtual
Brunswick is working in the Canadian Arctic as a part of Earth), there have been thousands of maps published online
ArcticNet. ArcticNet is a funded program that brings together (Elias et al., 2008). These web-based systems have a small set
scientists and managers from a number of different backgrounds of GIS tools, however many third-party “mash-ups” have been
to study the impacts of climate change in the coastal Canadian related to these GIS tools, allowing users to add more
Arctic. The OMG “will map the bottom topography and functionality to their maps (Elias et al., 2008). These simple
geological structure of the Northwest Passage and other regions online GIS programs allowed users and companies to display
of the Canadian Archipelago...” (Beaudoin, 2008). The data their data to anyone with access to the Internet. In order for the
collected by the OMG will aid the first step towards the OMG to stay up-to-date with the evolving online GIS industry,
management of increased intercontinental ship traffic and it was important for the OMG to be able to display their data on
resource exploration as ice conditions change. the Internet and allow users to download their high resolution
data in the current 15’ x 30’ map format.
1.1 Arctic basemaps
1.2 Overview of the Current Arctic Basemap
The OMG has been collecting data in the Arctic since 2003, on
Currently, the OMG have created their own methodology for
board Canadian Coast Guard vessels and their survey launch,
displaying their data online, although it can be seen from its
the C.S.L. Heron, which is on loan from the Canadian
functionality that is not very user friendly. Its functionality is
Hydrographic Service (Brucker, 2008). This has resulted in the
described in the next section.
OMG having a very large dataset with approximately 2,000 15’
x 30’ Arctic basemaps. The OMG will continue to build up
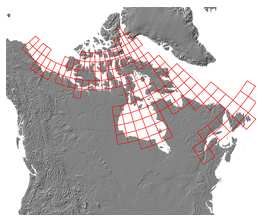
The online data storage and viewing of the OMGs data begins
their coverage of the Arctic with each transit through the North
with a simple map of Canada in the background and squares
West Passage.
outlining the different areas where they have data (see Figure
1). After clicking on an area, a new page opens with the large
Geographic information systems (GIS) have been around for
overview map, a smaller scale overview map which contains the
decades, although they were expensive which limited their use.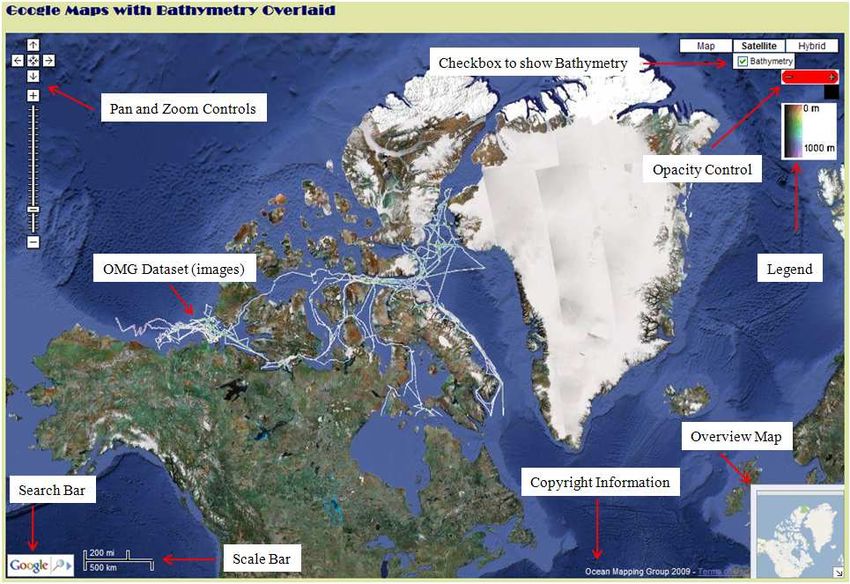
15’ x 30’ basemaps (shown in red squares), the actual data (sun
illuminated and colour shaded bathymetry) and links to                Figure 2. Showing the overview map (a smaller scale overview
download the data (see Figure 2). If users click on the box with      map and links to download the data is shown on the left and the
the data, a new page opens with the users having the ability to       data is visible on the right).
see the 15’ x 30’ basemap in high resolution (approx. 10m
resolution, see Figure 3).

Users must then click the back button and click a new area in
either the small scale overview map or the large overview map
and repeat the process. It is difficult for users to know where
the data is spatially as there is no background for the actual data
and the only reference to its location in Canada is on the
overview maps. It is also difficult for users to pan to different
areas of the dataset because they have to click on the area in the
overview maps.

The last difficulty is with the user’s ability to zoom in and out
on the data. There are only 2 zoom levels that alow to the users
to see the data, the entire 15’ x 30’ basemap and a high
resolution image of the basemap.

                                                                      Figure 3. Showing a high resolution image of the bathymetry.

                                                                      1.3 The user requirements for new Arctic Basemaps

                                                                      The purpose of this research project is to investigate the use of
                                                                      an open-source GIS program to display the OMG’s Arctic
                                                                      dataset on the web. The objectives for this research are to have
                                                                      a background map with the OMG’s data overlaid, allowing
                                                                      users to have some sense of where the data is located spatially.
                                                                      Users should also be able to pan and zoom to any area they
                                                                      choose. For the creation of images from the OMG’s data, the
                                                                      projection needed to be changed from Lambert Conformal
                                                                      Conic, to Mercator which is used by Google Maps.

                                                                      The images needed to have a common colour scheme for depth,
Figure 1. The overview map of the OMG’s Arctic Dataset.               have a transparent background, and the latitude and longitude
                                                                      for the corners of the images to properly georeference them. A
                                                                      legend for the depth colour scale and an opacity slider bar were
                                                                      added to the map. The last objective is to display the large
                                                                      dataset without long delays from loading the dataset.

                                                                          2. ARCTIC BASEMAPS WITH GOOGLE MAPS

                                                                      The program we decided to use in this research project was
                                                                      Google Maps, which is freely available to the public after
                                                                      registering with Google for a Google Maps API key. Google
                                                                      Maps is a program created by Google that allows users to
                                                                      embed a map directly into their website. Google provides the
                                                                      source code to users as well as an API reference that allows
                                                                      developers to add functionality to their maps. With Google
                                                                      maps, developers can perform simple GIS tasks, for example,
                                                                      adding points, lines and polygons, geocoding, and image
                                                                      overlays.

                                                                      The methods used to fulfil the research project’s objectives are
                                                                      discussed below.      The first step was to research the
                                                                      documentation about Google Maps from the Google Maps
                                                                      developer website (Google, 2008).         The documentation
                                                                      provided steps for embedding Google Maps into a website.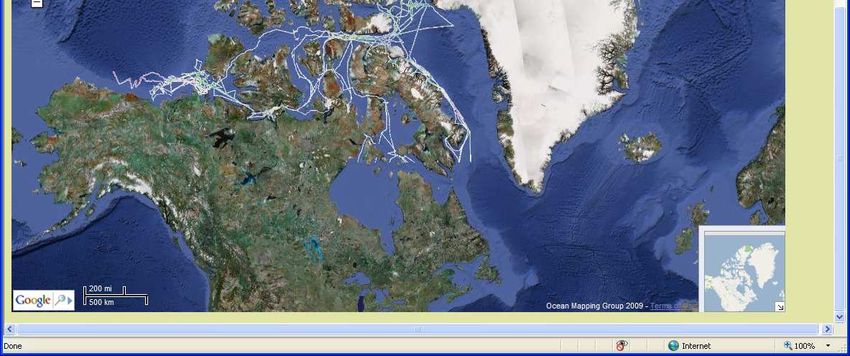
type of overlay was used, the image was properly georeferenced
Users must register and open an account with Google and and displayed the data, however when the image was zoomed it
obtain a Google Maps API key. The API key registers the user became pixelated.
website with Google and allows Google Maps to be embedded
in that website. The next step is learning the syntax for HTML The main reason this type of overlay was not used, was because
and Javascript which is used for the creation of a website. A of the loading time for the overlay. The overlay was extremely
useful website for learning HTML and Javascript is from slow and sometimes did not load at all. This was because the
w3schools (Refsnes, 2008). Javascript is used to embed Google ground overlay was designed to display an image in a small area
Maps into the website and perform the simple GIS tasks. After at one or two zoom levels.
creating the website with Google Maps displayed (see Muggah,
2008), the map controls, map type, map center and zoom level 3.2 Tile Overlay
can be set.
The second type of image overlay that was used in this research
project was the Tile Overlay. The tile overlay was useful for
2.2 Data preparation large datasets because the large images, unsuitable for other
methods of online publishing, were pre-cut into tiles (many
smaller images that were 256 pixels by 256 pixels) and only the
For this research project, the satellite map type was chosen
images which were present within the map bounds would be
because within Google the new low resolution bathymetry was
loaded (Pridal and Zabicka, 2008). This type of overlay is more
added to the existing satellite map. In areas where the OMG did
difficult to implement, however it is extremely efficient and will
not have data, users would be able to see the only low
be used to display the large dataset.
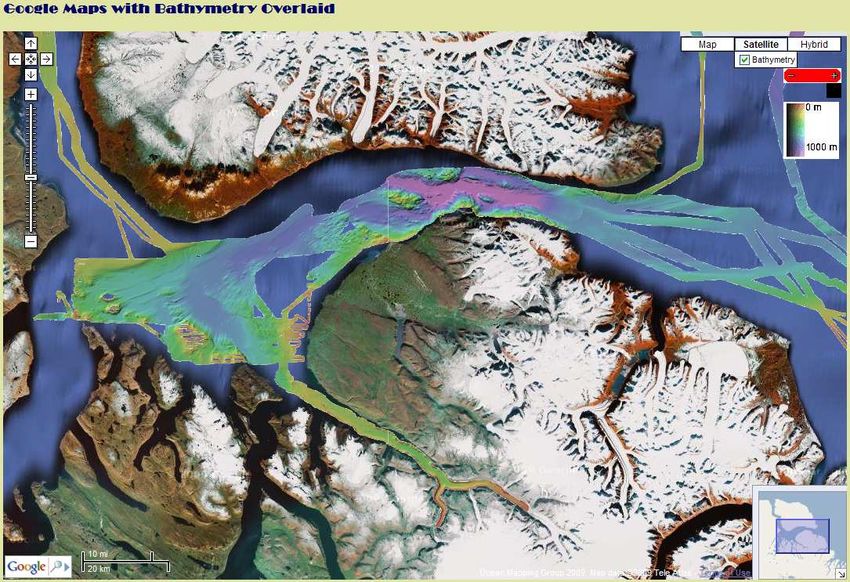
resolution bathymetry. The map was centered near Pond Inlet,
on Baffin Island and a low zoom level was set so users would
Microsoft’s Map Cruncher for Virtual Earth was used to create
see the entire OMG dataset. An overview map was added to
the pre-cut tiles (Elson, 2007). Google requires a pyramid
allow users to see the location of the map bounds on a larger
format for cutting the image into tiles. This means that at zoom
scale (see Figure 5).
level zero (showing the whole world) one tile is used. At each
subsequent zoom level, each tile is divided by four (zoom level
0 = 40, zoom level 1 = 41, ... , zoom level n = 4n). Microsoft’s
2.3 Data conversion Map Cruncher required the latitude and longitude of each
corner of the thirty images so they could be properly
The next step was to determine how to get the OMG’s data onto georeferenced. The new tiles (~600,000 images) for 12 zoom
Google Maps. Google requires image files for their image levels were overlaid in Google Maps using the tile overlay
overlays. In order to set and change the opacity for the image method.
overlay, a PNG file was chosen for the image file. The PNG
images were created from the OMGs multibeam data using open
source software and software written by the OMG. The
4. TESTING
following data processing workflow, created by Ian Church
from the OMG, outlines the procedure used. After testing the website for loading time and the ability for
users to pan and zoom to any area of the world, it was
The multibeam data was converted to the OMG’s r4 file format. determined that Google Maps, and its tile overlay method, was a
The r4 file was sun illuminated and then converted to an 8-bit suitable program to display the OMGs dataset. The images
file with different colours for depths. A PNG image was then were georeferenced properly and the objectives of the project
created of the sun illuminated colour coated image. Thirty were met (see Figures 5, 6 and 7).
blank map sheets in the Mercator projection were made to cover
the extent of the OMG’s dataset in the Arctic. The PNG files The use of PNG files in this project allowed that the opacity of
were patched into these blank map sheets, creating thirty map the image could be set. Using some Javascript programming, a
sheets containing the OMGs data from the Arctic. slider bar was added to Google Maps to allow users to change
Transparency was added to these map sheets where there was the opacity of the image (see figure 5). The opacity of the
no data so when they were added to Google Maps, users would images could be changed from 0% to 100%, from no opacity to
see the background image from Google where there was no full opacity (transparent image).
OMG data.
5. CONCLUSIONS
3. PROTOTYPING
There are many benefits for creating a website that displays
After creating the PNG images, the right type of image overlay Google Maps and the Arctic data on the OMG’s website. The
needed to be determined. first benefit is that it was an easy way of displaying their data
with a background image for areas where they do not have data.
It allows users to pan and zoom continuously which replaced
3.1 Ground Overlay the OMG’s old method of displaying their data and made it
more user friendly. Another benefit of using Google Maps is
In this research project, two types of image overlays were used. that it is a free, open source service, where other proprietary
The first type of image overlay was the Ground Overlay. This software can be expensive to display the same data. The open
overlay was easy to implement, only requiring the PNG image source software allowed for customization of the website and
and its Southwest and Northeast corner coordinates. When this the map.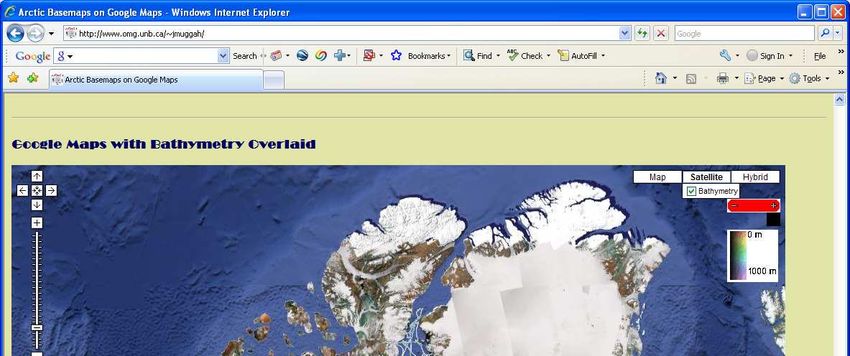
Google Maps support data retreival and display in many
different formats. It has proven that it can display large datasets
with minimal load time and it has the ability to handle the
future objectives for this project. Google Maps is fairly easy to
use and their API documentation is very useful (Lewis et al.,
2007). We have showh that this research project helped the
OMG to fulfill their end users needs.

                     6. FUTURE WORK

There are many possibilities to future work on this project. The
first objective for future work is to have a link to download the
high resolution imagery in the OMG’s 15’ x 30’ basemap
format. This is useful for the OMG because they want to be
able to distribute their data to interested parties or clients. The
next objective is to get the multibeam backscatter images onto        Figure 5. The website showing bathymetric data zoomed in near
Google Maps.                                                          Pond Inlet, in Northern Baffin Island.

This is another feature that is useful for the OMG because it is
important aid for interpreting the bathymetry and seaflor
geology type. The backscatter images should also have a link to
download the imagery.

A final possibility is to show the location of MVP or CTD casts.
These casts are important for oceanography and hydrographic
surveys because they show the temperature, salinity, density,
and sound speed profiles at each location. More objectives will
surely follow these objectives because of the evolving ocean
mapping industry.

Using Google Maps to display data will be useful for future
work because it is an easy way to visually display data to
clients. It allows clients to see the progress of a hydrographic
or oceanographic survey by simply providing them a link to a
website where the data is overlaid on Google Maps.

With the evolving web GIS industry, it will become more
important to display data online, using similar methods to the
ones used in this project.

                                                                      Figure   6.     An    overview           of     the     website
                                                                      (www.omg.unb.ca/~jmuggah).

                                                                      7. REFERENCES

                                                                      Beaudoin, J., 2008. OMG in ArcticNet. Department of Geodesy
                                                                      and Geomatics Engineering. University of New Brunswick [on-
                                                                      line] 01 February 2009.
                                                                      http://www.omg.unb.ca/Projects/Arctic/index.html

                                                                      Brucker, S., 2008. C.S.L. Heron. Department of Geodesy and
                                                                      Geomatics Engineering. University of New Brunswick [on-line]
                                                                      01 February 2009.
                                                                      http://www.omg.unb.ca/Heron/CSL_Heron.html

                                                                      Elias, M., J. Elson, D. Fisher, J. Howell, 2008. “Do I Live in a
                                                                      Flood Basin?” Synthesizing Ten Thousand Maps. CHI 2008
Figure 4. The website created for the Ocean Mapping Group             Proceedings, April 5-10, 2008, Florence Italy. Pp. 255-264
with labels showing what was added to Google Maps.
                                                                      Elson, J., J. Howell, D. Fisher, J. Douceur, 2007. MSR
                                                                      MapCruncher for Virtual Earth. [on-line] 23 January 2009.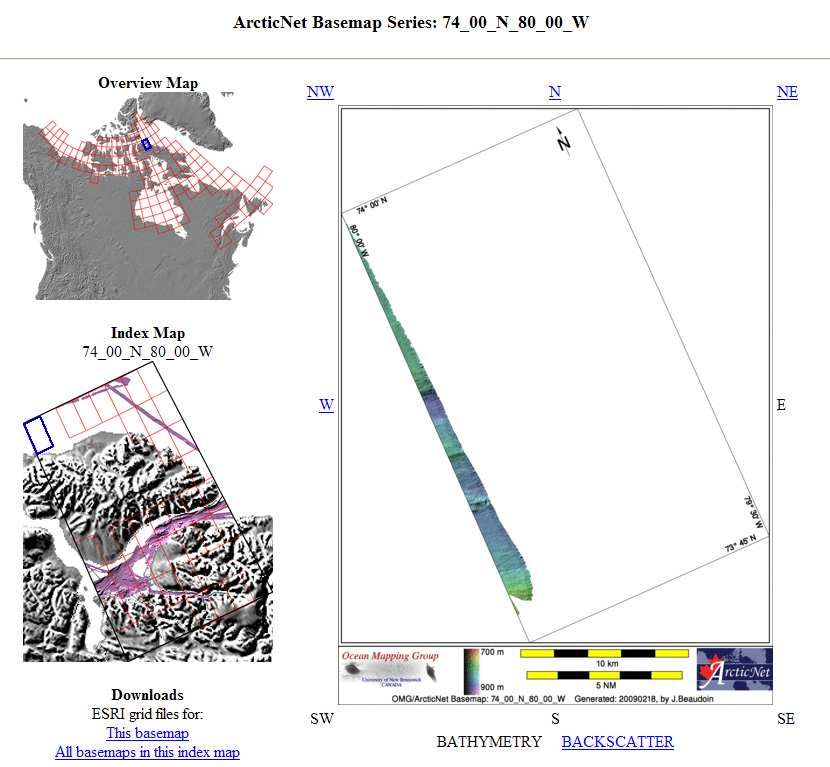
http://research.microsoft.com/en-
us/um/redmond/projects/mapcruncher/

Google. 2008. Google Maps API. Google Code [on-line] 15
October 2008.
http://code.google.com/apis/maps/documentation/introduction.h
tml

Lewis, A., M. Purvis, J. Sambells, and C. Turner, 2007.
Beginning Google Maps Applications with Rails and Ajax:
from Novice to Professional. Apress, Berkeley, CA.

Muggah, J. 2008. How to add Google Maps to a Website. [on-
line] 17 October 2008 to 13 February 2009.
http://www.omg.unb.ca/~jmuggah/

Pridal, P., and P. Zabicka. 2008. Tiles as an approach to on-
line publishing of scanned old maps, vedute and other
historical documents. e-Perimetron, Vol. 3, No. 1. Pp. 10-21.

Refsnes, H., S. Refsnes, and J.E. Refsnes. 2008. W3Schools:
HTML and JavaScript. [on-line] 15 October 2008.
www.w3schools.com

8. ACKNOWLEDGMENT

The authors acknowledge the help, support and guidance from
the Ocean Mapping Group (J. Beaudoin, J.H. Clarke and J.
Church) during the work on this research project.
You can also read