GOES-R PLT Lightning Mapping Array - (LMA) - NASA
←
→
Page content transcription
If your browser does not render page correctly, please read the page content below
Data User Guide

GOES-R PLT Lightning Mapping Array
(LMA)
Introduction
The GOES-R PLT Lightning Mapping Array (LMA) datasets consist of total lightning data
measured from multiple LMA systems, including Colorado (COLMA), Washington DC
(DCLMA), NASA's Kennedy Space Center (KSCLMA), North Alabama (NALMA), Oklahoma
(OKLMA), Southern Ontario (SOLMA), and West Texas (WTXLMA), during the GOES-R Post
Launch Test (PLT) airborne science field campaign. The GOES-R PLT airborne science field
campaign took place in support of the post-launch product validation of the Advanced
Baseline Imager (ABI) and the Geostationary Lightning Mapper (GLM). The LMA measures
the arrival time of radiation from a lightning discharge at multiple stations and locates the
sources of radiation to produce a three-dimensional map of total lightning activity. These
data files are available in compressed ASCII files and are available from March 1, 2017
through June 1, 2017.

Citations
There are seven citations, each for one of the Lightning Mapping Array systems, including
Colorado, Washington DC, NASA's Kennedy Space Center, North Alabama, Oklahoma,
Southern Ontario, and West Texas, respectively. Please select the appropriate citation for
the data you are using:

GOES-R PLT Colorado Lightning Mapping Array (LMA)
Rutledge, Steven. 2019. GOES-R PLT Colorado Lightning Mapping Array (LMA) [indicate
subset used]. Dataset available online from the NASA EOSDIS Global Hydrology Resource
Center Distributed Active Archive Center, Huntsville, Alabama, U.S.A. doi:
http://dx.doi.org/10.5067/GOESRPLT/LMA/DATA101
GOES-R PLT Washington D.C. Lightning Mapping Array (LMA)
Blakeslee, Richard. 2019. GOES-R PLT Washington D.C. Lightning Mapping Array (LMA)
[indicate subset used]. Dataset available online from the NASA EOSDIS Global Hydrology
Resource Center Distributed Active Archive Center, Huntsville, Alabama, U.S.A. doi:
http://dx.doi.org/10.5067/GOESRPLT/LMA/DATA201

GOES-R PLT Kennedy Space Center Lightning Mapping Array (LMA)
Wilson, Jennifer G. and Robert G. Brown. 2019. GOES-R PLT Kennedy Space Center
Lightning Mapping Array (LMA) [indicate subset used]. Dataset available online from the
NASA EOSDIS Global Hydrology Resource Center Distributed Active Archive Center,
Huntsville, Alabama, U.S.A. doi: http://dx.doi.org/10.5067/GOESRPLT/LMA/DATA301

GOES-R PLT North Alabama Lightning Mapping Array (LMA)
Blakeslee, Richard. 2019. GOES-R PLT North Alabama Lightning Mapping Array (LMA)
[indicate subset used]. Dataset available online from the NASA EOSDIS Global Hydrology
Resource Center Distributed Active Archive Center, Huntsville, Alabama, U.S.A. doi:
http://dx.doi.org/10.5067/GOESRPLT/LMA/DATA401

GOES-R PLT Oklahoma Lightning Mapping Array (LMA)
MacGorman, Don and Alex Fierro. 2019. GOES-R PLT Oklahoma Lightning Mapping Array
(LMA) [indicate subset used]. Dataset available online from the NASA EOSDIS Global
Hydrology Resource Center Distributed Active Archive Center, Huntsville, Alabama, U.S.A.
doi: http://dx.doi.org/10.5067/GOESRPLT/LMA/DATA501

GOES-R PLT Southern Ontario Lightning Mapping Array (LMA)
Sills, David. 2019. GOES-R PLT Southern Ontario Lightning Mapping Array (LMA) [indicate
subset used]. Dataset available online from the NASA EOSDIS Global Hydrology Resource
Center Distributed Active Archive Center, Huntsville, Alabama, U.S.A. doi:
http://dx.doi.org/10.5067/GOESRPLT/LMA/DATA601

GOES-R PLT West Texas Lightning Mapping Array (LMA)
Bruning, Eric. 2019. GOES-R PLT West Texas Lightning Mapping Array (LMA) [indicate
subset used]. Dataset available online from the NASA EOSDIS Global Hydrology Resource
Center Distributed Active Archive Center, Huntsville, Alabama, U.S.A. doi:
http://dx.doi.org/10.5067/GOESRPLT/LMA/DATA701
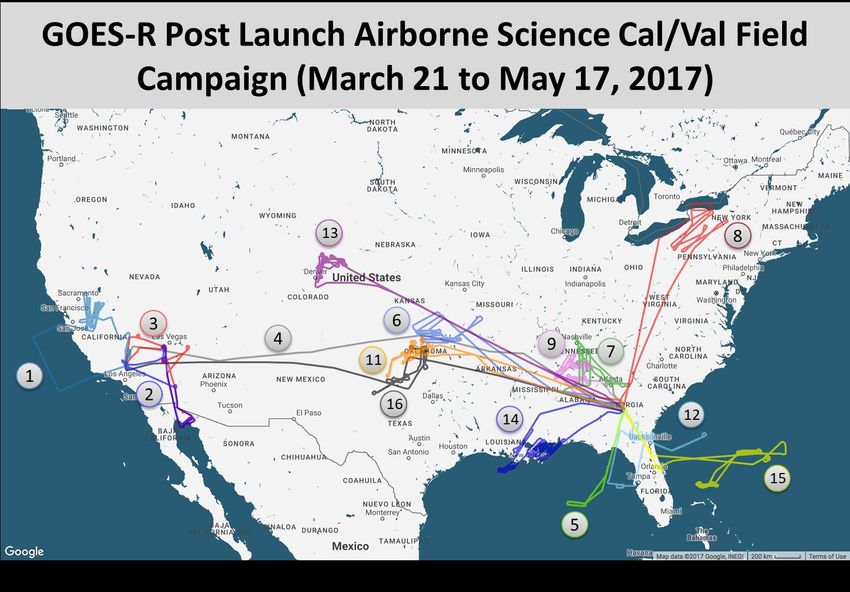
Keywords:
NASA, GHRC, Colorado, Washington D.C., KSC, North Alabama, Oklahoma, Southern Ontario,
West Texas, GOES-R, PLT, GLM, lightning, LMA, COLMA, DCLMA, KSCLMA, NALMA, OKLMA,
SOLMA, WTXLMA

Campaign
The Geostationary Operational Environmental Satellite-R (GOES-R) series is a four-satellite
program including GOES-R, GOES-S, GOES-T, and GOES-U. The GOES-R Series Program is a
collaborative development and acquisition effort between the National Oceanic and
Atmospheric Administration (NOAA) and the National Aeronautics and Space
Administration (NASA) to develop, launch and operate the satellites. The first satellite in
the GOES-R series, GOES-R, launched on November 19, 2016 and became GOES-16 when it
reached geostationary orbit. GOES-16 replaced GOES-13 as NOAA's operational GOES East
satellite at 75.2 degrees west longitude on December 18, 2017. GOES-16 observes North
and South America, as well as the Atlantic Ocean all the way to the west coast of Africa.
GOES-16 provides high spatial and temporal resolution imagery of the Earth using its
Advanced Baseline Imager (ABI). GOES-16’s Geostationary Lightning Mapper (GLM) is the
first operational lightning mapper flown in geostationary orbit. GOES-16 also includes four
other scientific instruments for monitoring space weather and the Sun.

The GOES-R PLT airborne science field campaign took place between March 21 and May 17,
2017 in support of the post-launch validation of NOAA’s new generation of geostationary
Earth observing instruments: ABI and GLM (Figure 1). The validation effort included
targeted data collections from a NASA ER-2 high-altitude aircraft integrated with nine
payloads (both passive and active instruments) coordinated with ground based and low
earth-orbit referenced data from several operational and research satellite missions.
Sixteen ER-2 aircraft validation missions, totaling 105.1 mission flight hours, were
conducted over ideal Earth validation targets, such as deserts and oceans, thunderstorms,
active wildfires, and an expansive set of cloud and moisture phenomenology. Dedicated ABI
30-second mesoscale (MESO) imagery collections were conducted concurrent with the ER-
2 high-altitude aircraft based sensors during each GLM mission. The GOES-R PLT field
campaign provided critical reference data and new insights into the performance NOAA’s
new generation of geostationary Earth observing instrument products. More information
about the GOES-R PLT field campaign is available at https://www.goes-
r.gov/mission/fieldCampaignBegins.html and
https://www.goes-r.gov/multimedia/events/goes16FieldCampaign.html.
Figure 1: GOES-R PLT airborne science field campaign
                              (Image Source: Frank Padula)

Instrument Description
The Lightning Mapping Array (LMA) is a three-dimensional total lightning location system.
The system measures the arrival time of impulsive Very High Frequency (VHF) radiation
from lightning discharges at multiple stations, and uses the arrival times to locate the
sources of the radiation to produce a three-dimensional map of total lightning activity.
LMAs generally consist of 6 to 20 antennas with baselines, or the distances between
individual sensors, of kilometers. Each antenna has a computer that records the time and
power of the strongest pulse in 10 microsecond bins. After a lightning flash, the times of
radio frequency pulses measured by each antenna can be analyzed with a time of arrival
(TOA) technique (Proctor, 1971), and the lightning flash can be mapped out in three spatial
dimensions and time (Rison et al., 1999).

Investigators
Steven Rutledge
Colorado State University
Fort Collins, CO
Richard Blakeslee
NASA MSFC
Huntsville, AL
Jennifer G. Wilson
NASA Kennedy Space Center
Kennedy Space Center, FL
Robert G. Brown
NASA Kennedy Space Center
Kennedy Space Center, FL
Don Macgorman
NOAA National Severe Storms Laboratory
Norman, OK
Alex Fierro
NOAA National Severe Storms Laboratory
Norman, OK
David Sills
Environment and Climate Change Canada
King City, ON
Canada
Eric Bruning
Texas Tech University
Lubbock, TX
Data Characteristics
The GOES-R PLT Lightning Mapping Array (LMA) datasets consist of total lightning
estimates measured from multiple LMA systems, including Colorado, Washington DC,
NASA's Kennedy Space Center, North Alabama, Oklahoma, Southern Ontario, and West
Texas, during the GOES-R PLT airborne science field campaign. Data files are in ASCII
format at a Level 1B processing level. More information about the NASA data processing
levels are available on the EOSDIS Data Processing Levels webpage. Table 1 shows the
characteristics of this dataset.
Table 1: Data Characteristics
Characteristic Description
Platform Ground station network
Instrument Lightning Mapping Array (LMA)
Spatial Coverage COLMA: N: 40.456, S: 40.436, E: -104.627, W: -104.647DCLMA: N: 38.899, S: 38.879, E: -77.159, W: -77.179
KSCLMA: N: 28.596, S: 28.576, E: -80.641, W: -80.661
NALMA: N: 34.735, S: 34.715, E: -86.635, W: -86.655
OKLMA: N: 35.289 , S: 35.269, E: -97.908, W: -97.928
SOLMA: N: 43.676, S: 43.656, E: -79.596, W: -79.616
WTXLMA: N: 33.617, S: 33.597, E: -101.813, W: -101.833
Spatial Resolution Point
March 1, 2017 to June 1, 2017
COLMA: March 1, 2017 to May 31, 2017*
DCLMA: April 6, 2017 to June 1, 2017*
Temporal Coverage KSCLMA: March 1, 2017 to June 1, 2017
NALMA: March 1, 2017 to June 1, 2017
OKLMA: March 1, 2017 to June 1, 2017
SOLMA: April 1, 2017 to June 1, 2017
WTXLMA: March 1, 2017 to June 1, 2017
COLMA, KSCLMA, OKLMA, SOLMA, WTXLMA: every 10
minutes a file
Temporal Resolution
DCLMA, NALMA: every 1 hour a file
Sampling Frequency 10 microseconds
Parameter Lightning
Version 1
Processing Level 1B
*Have missing data files shown in the ‘Missing Data’ section below
File Naming Convention
The GOES-R PLT Lightning Mapping Array (LMA) data files are available in compressed
ASCII files and are available at a Level 1B processing level. These data and browse files
have the following file naming convention:
Data files: goesr_plt__YYYYMMDD__[0600|3600].[dat|qua|aux].gz
Table 2: File naming convention variables
Variable Description
LMA network: COLMA, DCLMA, KSCLMA, NALMA, OKLMA, SOLMA,
network
WTXLMA
YYYY Four-digit year
MM Two-digit month
DD Two-digit day
hh Two-digit hour in UTC
mm Two-digit minute in UTC
ss Two-digit second in UTC
dat|qua|aux qua - qualityaux - auxiliary
dat - analyzed data
0600|3600 Number of seconds analyzed
.gz Compressed file
Data Format and Parameters
The GOES-R PLT Lightning Mapping Array (LMA) datasets contain three types of data files
(*.dat, *.qua, *.aux) in compressed ASCII format. All seven datasets have *.dat files. Each
*.dat file contains a multiple-line file header describing product-specific attributes
(summarized in Table 3). A ‘***data***’ line marks the end of the file header. Following the
header are 7 columns of data fields (Table 4). Each row of data represents one lightning
source event (i.e., an individual piece of a larger lightning flash). In addition to *.dat files,
both the NALMA and WTXLMA datasets provide *.qua files, and the WTXLMA dataset
includes *.aux files. The *.qua file header section ends with a line of ‘*** data ***’. Each data
records contains a single line data header (formatted as ‘yy/mm/dd, hh:mm:ss, second-of-
day, sources’) and 8 rows of data fields (Table 4). The *.aux file contains auxiliary data
corresponds to one of the lightning source events recorded in the *.dat file. Each set of
auxiliary data includes 12 times, 12 raw powers, 12 above thresholds and 10 covariance
elements (upper triangle, 0=[0][0], 1=[0][1] … 9=[3][3]), where 12 is the total number of
stations of WTXLMA.
Table 3: Product-specific attributes in LMA data file header.
COLMA DCLMA KSCLMA NALMA OKLMA SOLMA WTXLMA
number of
600 3600 600 3600 600 600 600
seconds analyzed
38.889,
40.446, - 28.586, - 34.725, 35.279, - 43.666, - 33.607, -
Coordinate center -
104.637, 80.651, - -86.645, 97.918, 79.606, - 101.823,
(lat, lon, alt) 1000.00
77.169,
2000 0.00 417.90 200.00 984.00
30.00
number of
21 10 13 20 18 15 12
stations
number of active
8 5 9 13 17 12 10
stations
Minimum number
of stations per 6 5 6 6 6 6 5
solution
maximum
reduced chi- 5 5 5 2 5 5 5
squared
maximum number
of chi-squared 20 20 20 20 20 20 20
iterations
Table 4: Data fields in LMA *.dat files.
Column Data field Unit
1 Time Second of day in UTC2 Latitude Degree North
3 Longitude Degree East
4 Altitude Meter
5 Reduced Chi-squared -
6 VHF source power radiated by lightning dBW
7 mask -
Table 4: Data fields in LMA *.qua files.
row Data field Unit
1 Station id -
2 Triggers -
3 Solutions -
4 Contribution %
5 Average P/P_med -
6 Satellites -
7 Threshold -
8 Data loss flag -
Algorithm
The use of time of arrival (TOA) technique for locating a lightning flash was pioneered by D.
E. Proctor in South Africa (Proctor, 1971, 1981; Proctor et al., 1988).
The time of arrival (ti) of the VHF signal at station i is
(1)
Where t is the time the radiation is emitted from source location (x, y, z), (xi, yi, zi) is the
location of station i, and c is the speed of light. With the time of arrival of the radiation from
a breakdown event measured at six or more stations, the four unknowns x, y, z and t can be
found with the least-squares fit to Equation (1).
Figure 2: Basic TOA technique. Measurements of the arrival times ti at N>=4 locations are
used to determine the location and time of the source event (x, y, z, t).(Image source: Thomas et al., 2004) Quality Assessment The accuracy of the lightning source locations depends on the uncertainty of the arrival time measurements and on the number and positions of the stations used to obtain each solution. The arrival times are measured independently at each station using an accurate time base provided by a GPS receiver. Sources over the LMA network are located with an uncertainty of 6-12 m root-mean-square (rms) in the horizontal and 20–30 m rms in the vertical. This corresponds well with the uncertainties of the arrival time measurements, determined from the distribution of chi-square values to be 40–50 ns rms. Outside the network the location uncertainties increase with distance. The range (r) and altitude errors increase as the range squared, r2, while the azimuthal error increases linearly with the range (Thomas et al., 2004). Software No software is required to view these ASCII data files. Known Issues or Missing Data COLMA does not have data files for March 3, 16, 18 and 27, 2017; DCLMA does not have data files for April 8, 9 and 10, 2017. References Proctor, D. E. (1971). A Hyperbolic System for Obtaining VHF Radio Pictures of Lightning. J. Geophys. Res., 76, 1478-1489. doi: https://doi.org/10.1029/JC076i006p01478 Proctor, E. E. (1981). VHF radio pictures of cloud flashes. J. Geophys. Res., 86, 4041-4071. doi: https://doi.org/10.1029/JC086iC05p04041 Proctor, D. E., R. Uytenbogaardt, and B. M. Meredith (1988). VHF radio pictures of lightning flashes to ground. J. Geophys. Res., 93, 12,683-12,727. Doi: https://doi.org/10.1029/JD093iD10p12683 Rison, W., R. J. Thomas, P. R. Krehbiel, T. Hamlin, and J. Harlin (1999). A GPS-based Three- Dimensional Lightning Mapping System: Initial Observations in Central New Mexico. Geophys. Res. Lett., 26, 3573–3576. doi: https://doi.org/10.1029/1999GL010856 Thomas, R. J., P. R. Krehbiel, W. Rison, S. J. Hunyady, W. P. Winn, T. Hamlin, and J. Harlin (2004). Accuracy of the Lightning Mapping Array. J. Geophys. Res., 109, D14207. doi: https://doi.org/10.1029/2004JD004549
Related Data
All datasets from GOES-R PLT field campaign can be considered related to this dataset.
Other GOES-R PLT campaign data can be located using the GHRC HyDRO 2.0 search tool, by
entering the term ‘GOES-R PLT’.

Contact Information
To order these data or for further information, please contact:
       NASA Global Hydrology Resource Center DAAC
       User Services
       320 Sparkman Drive
       Huntsville, AL 35805
       Phone: 256-961-7932
       E-mail: support-ghrc@earthdata.nasa.gov
       Web: https://ghrc.nsstc.nasa.gov/

Created: March 5, 2019
You can also read