Development of a DCU monitoring web application for CMS ECAL - Assignee: Olov Günther-Hanssen Supervisor: Giacomo Cucciati CMS Department 18th ...
←
→
Page content transcription
If your browser does not render page correctly, please read the page content below
Development of a DCU monitoring web
application for CMS ECAL
Assignee: Olov Günther-Hanssen
Supervisor: Giacomo Cucciati
CMS Department
18th September 2019
Introduction
This report summarizes the project done by summer student Olov Günther-Hanssen, who
stayed at CERN during the months of July and August 2019. The project was supervised by
Giacomo Cucciati. What follows describes the background and motivation of the project, the
process and lastly the result of the project.

Beside Giacomo Cucciati, I would like to acknowledge Davide Valsecchi and Roberta
Arcidiacono for the help they provided me during the project.

Definitions and acronyms
APD          Avalanche Photo Diode
CCU          Communication and Control Unit
CMS          Compact Muon Solenoid
CSS          Cascade Style Sheets
DCU          Detector Control Unit
ECAL         Electromagnetic calorimeter
ECAL-View Web application built on Node.js (serverside) and Vue.js (frontend) for
monitoring ECAL
Git          Version control software
HTTP         Hypertext Transfer Protocol
LHC          Large Hadron Collider
LVR          Low Voltage Regulator
MEM          Monitoring Electronic Module
Node.js      Javascript run-time environment running on the serverside
REST API     Representational state transfer application interface
TT           Trigger Tower
SM           Super Module
XDAQ         Software platform for distributed data acquisition systems at the CMS
Vue.js       Javascript-based framework for creating user-interfaces in the browser

Background
In 2008, the construction of the Large Hadron Collider (LHC) at CERN was completed. LHC
is the world’s largest and most powerful particle accelerator and is used in general physics
research to study the matter and laws that form our universe. Experiments are generally
performed by making particles collide at certain points (called interaction points) along the
LHC. When particles collide at high energy (mainly proton-proton in LHC), they generate
other particles, which can be detected. One of the detectors of LHC is the Compact Muon
Solenoid (CMS), which is a hermetic general purpose detector which surrounds the
interaction point and detects among others: muons, hadrons, electrons and photons. The
CMS weights over 14’000 tonnes and is divided into several subsystems. One of these
subsystems is the electromagnetic calorimeter (ECAL), which detects electrons and photons
from the collision in the LHC. ECAL is shaped like a cylinder: with two so called end caps on

                                                                                            1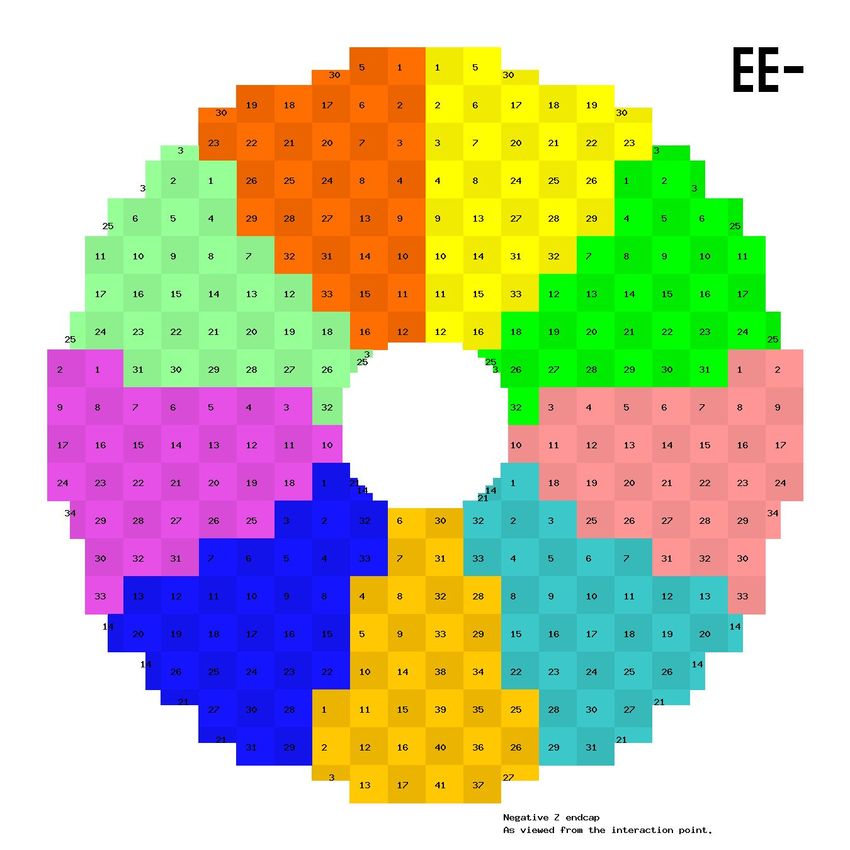
either side of the interaction point, and a barrel, connecting the end caps, see figure 1. The
barrel is divided, by a plane normal to the axial direction, into two sections, named EB+ and
EB-. Similarly, the two end caps are named EE+ and EE-.
Figure 1: Cross-section of the ECAL
The smallest detection entity in ECAL are the lead tungstate (PbWO4) scintillating crystals, in
the shape of rectangular 20x5x5 cm bars. These are grouped into 5x5 matrices, forming
trigger towers (TT). The trigger towers are in turn grouped into supermodules. The barrel is
made up of 36 supermodules and the end caps are made up of 9 supermodules each.
To be able to detect any particles, avalanche diode photodetectors (APD) are attached to
the end of the crystals. The photodetectors measures the light intensity in the crystals, which
is a product of the passage of a particle in the matter and is proportional to the energy of the
particle. For every TT, the APDs are connected to 5 electronic board, called very front-end
board (VFE). Connecting to all 5 VFE of a TT is another electronic board, called front-end
board (FE), see figure 2.
2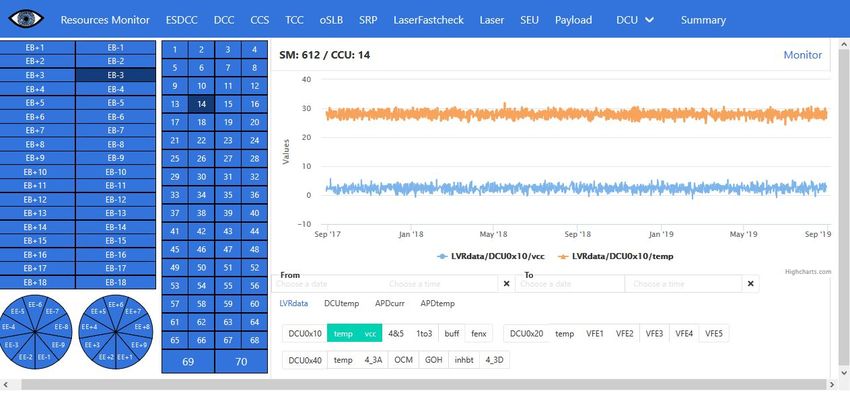
Figure 2: Schematic view of the TT electronics
The electronics receives and handles the data which is later used for analysis of the LHC
collisions. Control chips (DCUs) have been installed on these boards to measure
environmental data, such as temperature of the APD and the chips, leak current of the APDs
and low voltage provided to the boards. The purpose of these data is to be used by ECAL
experts to study the stability of the detector during runs of the LHC and investigate sources
of problems and dead channels.
These readouts are controlled by a chip called the Communication and Control Unit (CCU).
The CCUs are distributed all over the ECAL, and coincides with the TT in the barrel (thus
making up 68 CCUs in every supermodule), while in the end caps, there are between 32 and
34 CCUs in each supermodule. This seemingly unstructured layout of the CCUs in the end
caps can be seen in figure 3.
Figure 3: The layout of the CCUs (marked by the numbering) in the negative end caps. The
different colors represent the supermodules. The layout is mirrored in the positive end cap.
The readouts collected (referred to in this report as DCU data) in the CCUs are currently
read twice per CMS run, once in the beginning of the run, and once in the end. This data is
sent to a XDAQ C++ program called DCUConverter, which converts the voltage readouts to
celsius, microampere and volts, for the temperatures, currents and voltages respectively.
The data is saved in 5 files per supermodule, one for each data type, which are listed in
Table 1.
Data type Description Number of readouts per CCU
DCUtemp Internal temperatures of the DCU chips 8
APDtemp Temperatures of the thermistors in the 1-3
APD capsules
APDcurr Leak current of the APD (pedestal not 25
3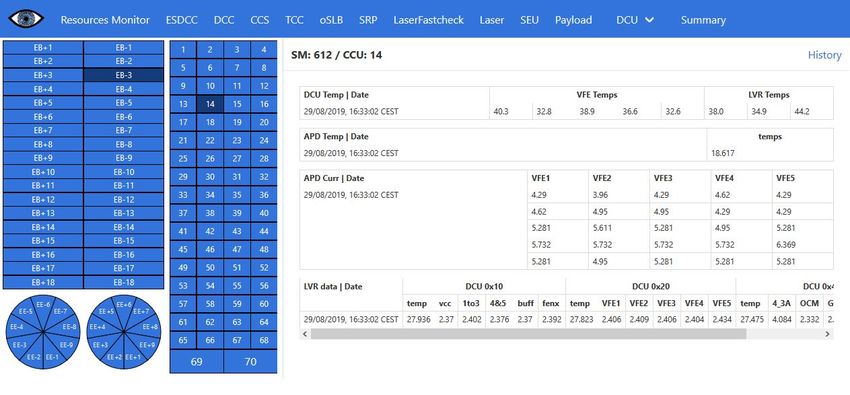
subtracted)

 LVRdata      Low voltage regulator voltage levels and       18
              board temperatures

 MEMdata      Voltages and temperatures from the MEM         5
              box
                          Table 1: Description of the DCU data files.

The DCUConverter saves the readouts in a database, and saves the files on a machine on
the CMS network.

Goal of the project
The current problem for the ECAL experts is that there is no streamlined way to read the
DCU system data, since there are currently no software available for displaying them. The
fallback is then to access the CMS network machines and read the converted files directly
through a terminal window, a workflow which is clumsy and non-efficient.
The goal of the project was therefore set to develop a web application, with an interface for
monitoring the DCU data, built on a stack of Node.js and Vue.js. The monitoring application
should be able to collect the latest data from the DCU files and also display a history of the
previous data. An additional feature would be for the application to send out notifications to a
ECAL expert whenever there is a problem detected from the DCU data. An idea was also to
integrate this DCU monitoring application with the already existing all-purpose monitoring
application for ECAL, called ECAL-View.

Working on the project
The development of the application began at the start of July 2019. As a first step of the
project I tried to get familiar with the data to visualize and the developer environment. As I
was adding new features with not too much focus on stability, the initial development was
made in a separate Git repository. In the beginning I also spent time getting familiar with
Vue.js and the different data visualisation libraries used in the project.
To be able to have some data to work with, I copied some DCU files from the CMS network
into the repository, then parsed them and inserted them into a MongoDB database. The data
was then exposed through a REST API running on a simple Node.js Express server.
During the project, solutions for collecting data from the DCUConverter files have also been
explored. Some ideas for reading the files and streaming the data with already existing
solutions were considered (e.g. Logstash + ElasticSearch database). However, after meeting
with the sysadmins, who preferred as few instances of software on the CMS machines as
possible, this idea was modified to instead involve data collection through a XDAQ
framework called Flashlist, already available in CMS. The DCUConverter would save the
correct data onto a Flashlist, which in turns should be read by another service, ultimately
saving the data in a centralized ElasticSearch database. This planned flow of the data is
visualised in figure 5. As I knew very little about the XDAQ framework, this part of the project
was however not prioritised. Instead focus was put into having a fully working user interface.

                                                                                              4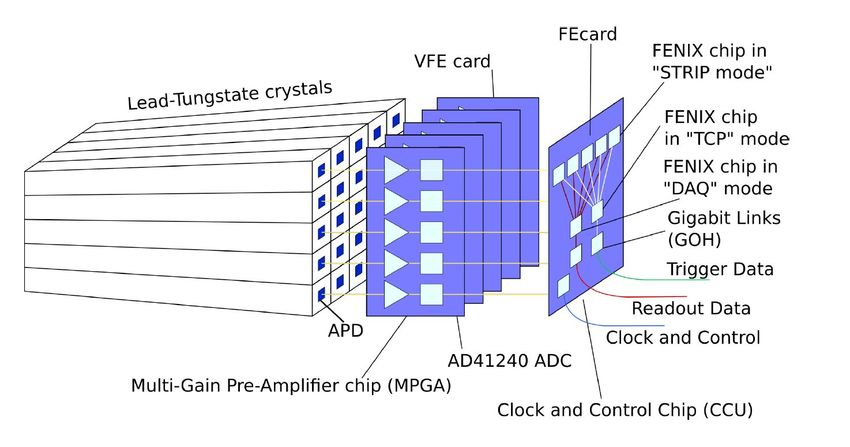
Figure 5: Schematic of the flow of the DCU data from the DCU Converter to the ECAL
expert. The blue boxes are results of the project, and the light grey boxes are yet to be
implemented. The circular arrows show that the data is polled with a certain time interval.
At the end of the project, the application developed separately was integrated with
ECAL-View, by creating 2 new monitoring tabs in the already existing Vue application (the
features are described below) and 1 new server-side monitor, which is serving the data
through a common REST API. Currently the data is randomly generated, but the idea is to
connect this monitor with the database in a later stage, since the database integration with
the Flashlist system is yet to be finished.
Technologies used
Figure 6: Logos of the frontend libraries used.
The frontend part of the application was forked of a boilerplate project called
vue-webpack-boilerplate, which is a boilerplate Vue.js application with an already set up
developer environment with code linting, file serving and more. From here the monitoring
interface was developed. To be in line with the styling of ECAL-View, the CSS framework
Bulma was chosen, along with Vue components from Buefy. The Javascript data
5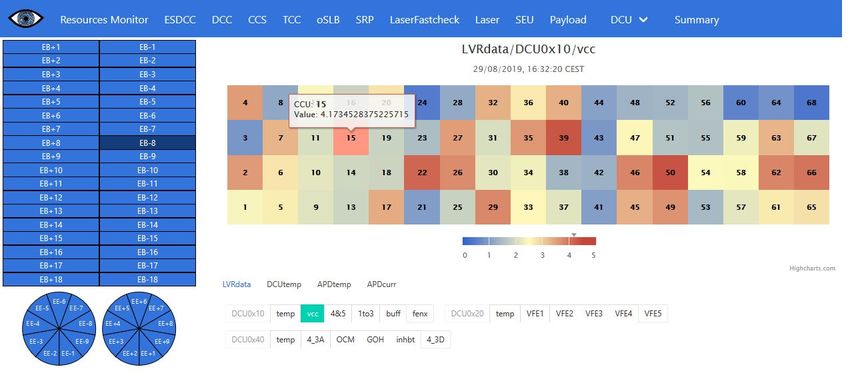
visualization libraries D3.js and Highcharts was used for creating rich visual components and
displaying the data in charts.
Outcome
Frontend web application
The final frontend interface of the DCU Monitoring system is two integrated tabs in
ECAL-View, seen in figures 7-9. These pictures corresponds to the three main features of
the frontend result:
● DCU real-time monitoring, allowing to see all of the latest collected DCU data of any
chosen CCU
● DCU history, allowing to see the history of a readout of a specific CCU, with the
opportunity to limit the time frame.
● DCU heatmap, allowing to view the latest collected DCU data of a specific readout,
over a whole SM
Figure 7: A screenshot of the monitoring of the latest DCU data
Figure 8: Screenshot of the DCU history, allowing to view the readout from a sensor over a
period of time.
6
Figure 9: Screenshot of the DCU heatmap, monitoring a whole SM.

Backend REST API
The backend REST API which provides the DCU data to the frontend is an integrated
monitor on the serverside of ECAL-View. Is it currently composed by an 'interface
component', which handles the HTTP REST API calls, and a 'logic component', which
collects and handles the data to be served. As the DCU data is still not available in a
database, the DCU data is mocked by random generation. By mocking the data, a working
prototype of the interface component and the frontend can be used live, and It allows the
developing of the monitor using the data structure already defined in the mock-up.

Other outcomes
Besides the code which is now integrated into ECAL-View, the project produced also some
scripts for data handling from the converted DCU data files, whose structure and logic may
be used if parsing needs to be done on the converted DCU data files.

Final remarks
Looking at figure 5, it gives a good overview of what the outcome of the project have been
so far, with the currently implemented parts marked in blue. The goal was to pipe the DCU
data from the DCU Converter, all the way to a web application which could display the data
to the ECAL expert. What I have completed is the HTTP server, which has an interface for
serving the DCU data through a REST API. In addition to this, I have also built a new user
interface in the browser with Vue.js, for fetching and displaying the DCU data in the browser.
However, the boxes in light grey in figure 5 represent the parts that are still to be
implemented. The DCU Converter does not send the information to a Flashlist yet, and the
HTTP server does not fetch the data from a database, it is instead randomly generated.
These features, as well as the database serving and the piping from the Flashlist to the
database, is still to be finished. This will require looking more into the XDAQ framework and
database serving (where inspiration can be taken from the initial repository). Additional work
could also be put into the frontend part to enhance the user experience and add more
features useful for the ECAL experts.

                                                                                             7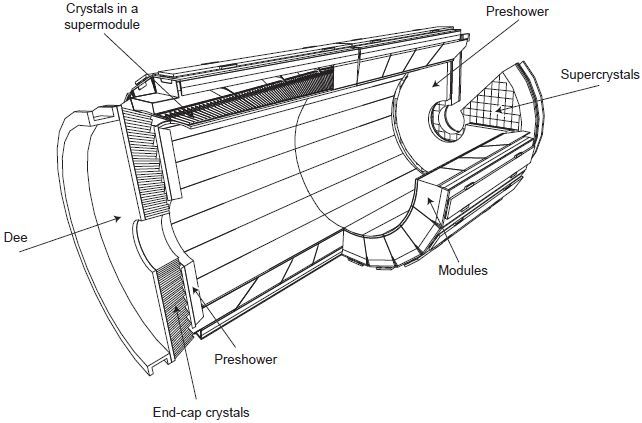
Useful links
Information about the meaning of the readouts
http://ecal-od-software.web.cern.ch/ecal-od-software/documents/DCU/dcuManual.htm
Report about the DCU data monitoring system as a whole and mentioning of older,
now deprecated, DCU monitoring applications
http://inspirehep.net/record/859486/files/jpconf10_219_022013.pdf
Comprehensive presentation slides about the DCU data monitoring system
https://indico.cern.ch/event/35523/contributions/839747/attachments/705095/967962/CHEP
09_marone.pdf
Information about the MEM system
http://cms-ecal-monitoring.web.cern.ch/cms-ecal-monitoring/MEM_electronics/MEM_electro
nics.html

                                                                                     8
You can also read