Use of Unmanned Aerial Systems for Hydrological Monitoring
←
→
Page content transcription
If your browser does not render page correctly, please read the page content below
Use of Unmanned Aerial
                     Systems for Hydrological Monitoring
                                        Prof. Salvatore Manfreda and HARMONIOUS TEAM
                                              Dipartimento di Ingegneria Civile, Edile e Ambientale (DICEA)
                                      Professor of Hydrology and Advanced Monitoring - www.salvatoremanfreda.it
                                            Chair of the COST Action Harmonious - www.costharmonious.eu
                                                          e-mail: salvatore.manfreda@unina.it
                                                                Twitter: @Sal_Manfreda

HARMONIOUS TEAM: Salvatore Manfreda, Brigitta Toth, David Helman, Giorgos Mallinis, Richard Lucas, Pauline Miller, Antonino Maltese, Petr
Dvořák, Sander Mücher, Giuseppe Ciraolo, Yijian Zeng, Zhongbo Su, Jana Müllerová, Nunzio Romano, Xurxo Gago, Ruodan Zhuang, Goran Tmusic,
Helge Aasen, Mike James, Gil Concalves, Eyal Ben-Dor, Anna Brook, Maria Polinova, Jose Juan Arranz, Janos Meszaros, Ruodan Zhuang, Kasper
Johansen, Yoann Malbeteau, Matthew McCabe, Isabel Pedroso de Lima, Corine Davis, Sorin Herban, Sophie Pearce, Robert Ljubicic, Salvador
Peña-Haro, Matthew Perks, Flavia Tauro, Alonso Pizarro, Silvano Fortunato Dal Sasso, Dariia Strelnikova, Salvatore Grimaldi, Ian Maddock, Gernot
Paulus, Jasna Plavšic, Dušan Prodanovic, Rafi Kent, Josef Brůna, Martynas Bučas, Joan Estrany, Adrien Michez, Martin Mokroš, Maria Tsiafouli,
João L. M. P. de Lima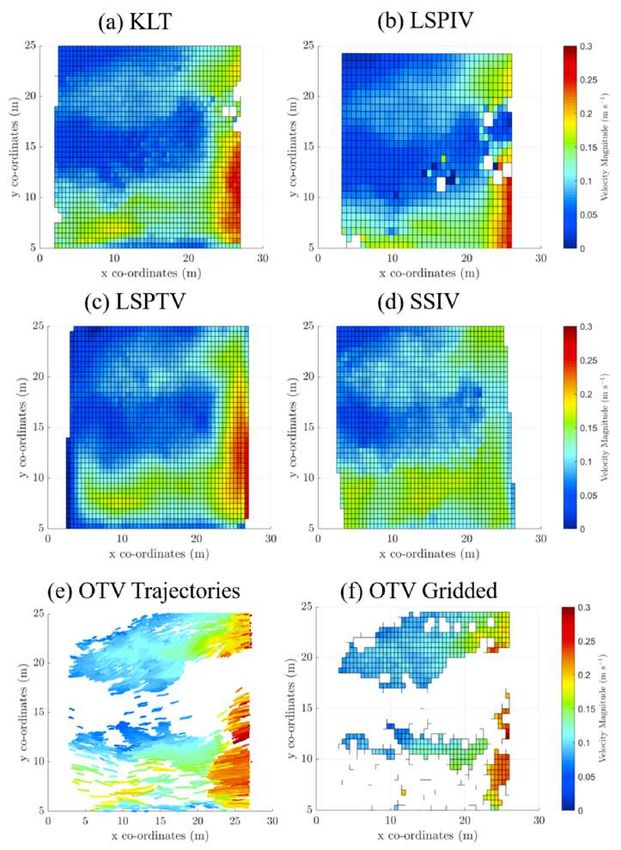
2        Unmanned Arial Systems (UAS) for Environmental Monitoring
    Scope: improve ability to monitor river basin processes

    Variable of interests: state of the vegetation, soil water content, streamflow (flow
    velocity and water level), flooded areas and river morphology.

    Objective: To define integrated procedures to improve hydrological/hydraulic
    monitoring capacity using UAS.

    Scale: from plot-scale to the river basin scale providing operational monitoring tools.

    Prof. Salvatore Manfreda – Università degli Studi di Napoli Federico II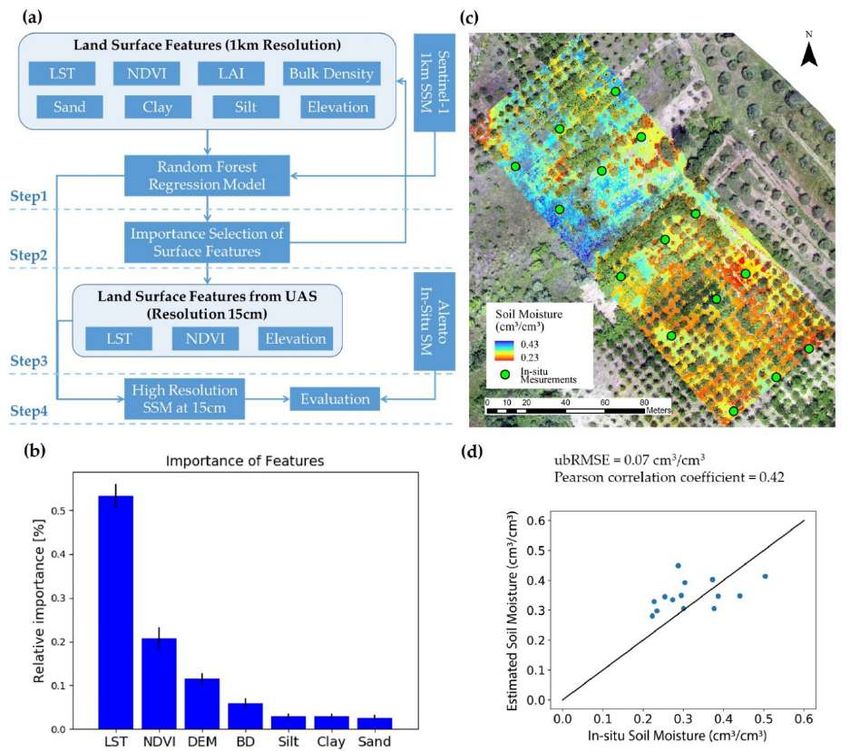
3
                                                      Environmental Monitoring

                            Global                                            Few hectars                        Few m2

                      Up to 30cm                                              Up to 1cm                         Up to 1cm

                                                                                            Comparable Scales

    Prof. Salvatore Manfreda – Università degli Studi di Napoli Federico II
4                                                                   UAS vs Satellite

                                                                                       (Manfreda et al., Remote Sensing 2018)

    Prof. Salvatore Manfreda – Università degli Studi di Napoli Federico II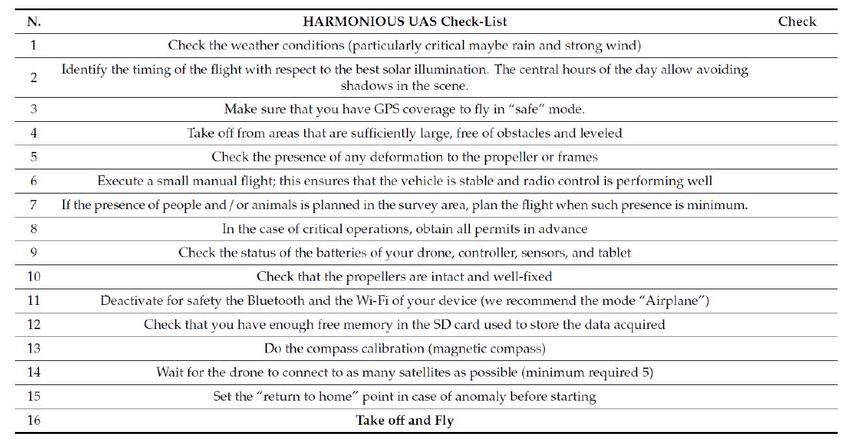
5       Number of articles extracted from the database ISI web of knowledge
                                                  3000                                                                               100%
                                                                                      automation of a single or multiple vehicles,
                                                                                      tracking and flight control systems,           90%
                                                  2500                                hardware and software innovations,
                                                                                                                                     80%

                                                                                                                                            Percentage of Environmental Studies (%)
                                                                                      tracking of moving targets,
                                                                                      image correction and mapping performance       70%
                                                  2000                                assessment
                               Number of Papers

                                                                                                                                     60%

                                                  1500                                                                               50%
                                                         UAS applications
                                                                                                                                     40%
                                                  1000   Environmental Applications
                                                                                                                                     30%
                                                         Percentage of Environmental Studies
                                                                                                                                     20%
                                                   500
                                                                                                                                     10%

                                                     0                                                                               0%
                                                         1990
                                                         1991
                                                         1992
                                                         1993
                                                         1994
                                                         1995
                                                         1996
                                                         1997
                                                         1998
                                                         1999
                                                         2000
                                                         2001
                                                         2002
                                                         2003
                                                         2004
                                                         2005
                                                         2006
                                                         2007
                                                         2008
                                                         2009
                                                         2010
                                                         2011
                                                         2012
                                                         2013
                                                         2014
                                                         2015
                                                         2016
                                                         2017
                                                                                        Year

                                                         from 1990 up to 2017 (last access 15/01/2018)
                                                                                                                      (Manfreda et al., Remote Sensing 2018)

    Prof. Salvatore Manfreda – Università degli Studi di Napoli Federico II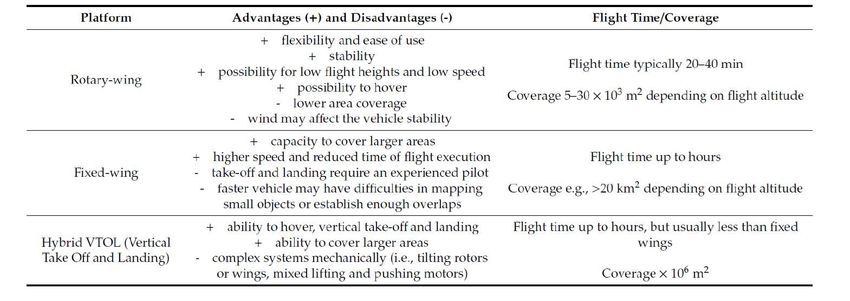
6           CA16219 - COST Action HARMONIOUS

    • A network of scientists is currently cooperating within the
      framework of a COST (European Cooperation in Science and
      Technology) Action named “Harmonious”.
    • The aim of “Harmonious” is to promote monitoring strategies,
      establish harmonized monitoring practices, and transfer most
      recent advances on UAS methodologies to others within a global
      network.
    • HARMONIOUS involves 36 Countries

    Prof. Salvatore Manfreda – Università degli Studi di Napoli Federico II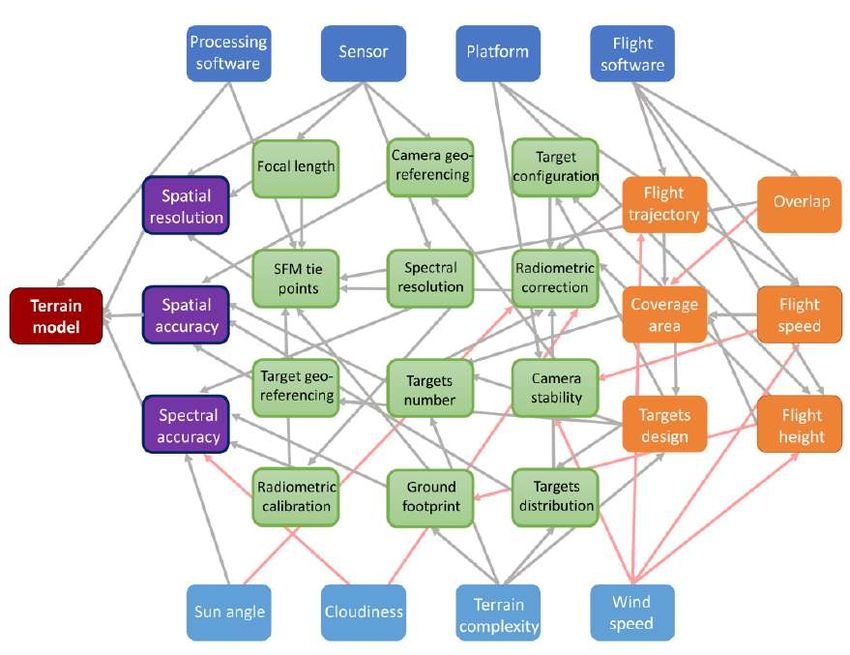
Action Chair Salvatore Manfreda
                                     Vice Chair Brigitta Toth
                      Science Communications Manager: László Bertalan
                                STSM coordinator: Isabel De Lima                       WG2:
7
                         Training School Coordinator: Giuseppe Ciraolo            Vegetation Status            WG5: Harmonization of
                             ITC Grant Coordinator: Martin Mokros                Leader Antonino Maltese        methods and results
                                                                                 Vice leader Felix Frances         Leader Eyal Ben Dor
                                                                                Vice leader Jana Mullerova       Vice leader Flavia Tauro
                                              WG1: UAS data
                                               processing
                                              Leader Sorin Herban                       WG3
                                            Vice leader Corine Davis             Soil Water Content
                                                                                    Leader Yijian Zeng                Harmonization
                                                                                 Vice leader Anna Brook                 of different
                                                                                                                        procedures
                                          Geometric Correction                           WG4                          and algorithms
                                          and image calibration                   Leader Matthew Perks                  in different
                                                                              Vice leader Dariia Strelnikova          environments

                                                                                River morphology
                                                 Contrast
                                               Enhancement
                                                                                    Stream flow

    Prof. Salvatore Manfreda – Università degli Studi di Napoli Federico II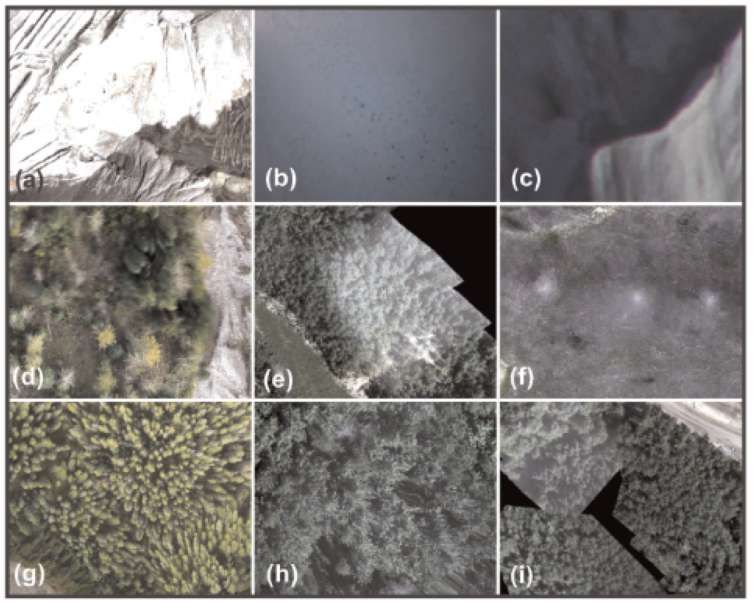
8                                                        Stay Connected with Us

                                Link                                                 Link

                                      Link                                           Link

                                                                              Link

    Prof. Salvatore Manfreda – Università degli Studi di Napoli Federico II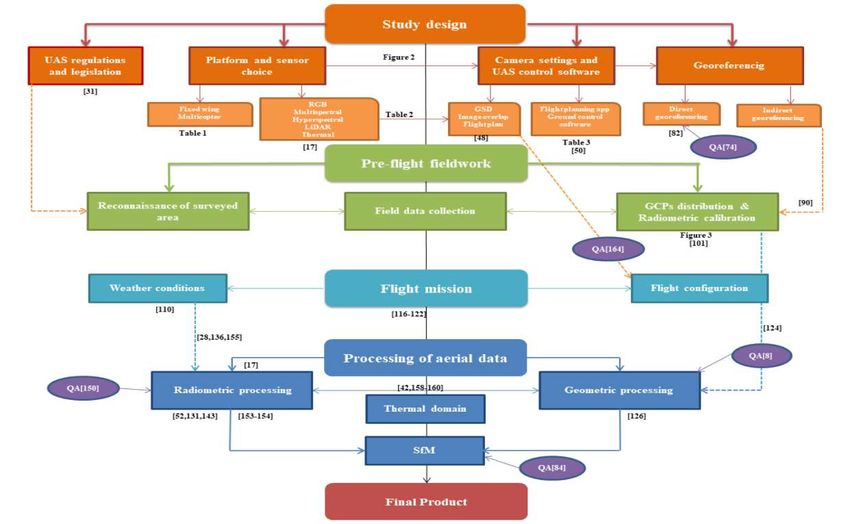
WG1
                                                                                                    UAS data processing
9         Examples of Common Image Artifacts

                                                                              a) saturated image;
                                                                              b) vignetting;
                                                                              c) chromatic aberration;
                                                                              d) mosaic blurring in overlap area;
                                                                              e) incorrect colour balancing;
                                                                              f) hotspots on mosaic due to
                                                                                 bidirectional reflectance effects;
                                                                              g) relief displacement (tree lean)
                                                                                 effects in final image mosaic;
                                                                              h) Image distortion due to DSM
                                                                                 errors;
                                                                              i) mosaic gaps caused by
                                                                                 incorrect orthorectification or
                                                                                 missing images.
(Whitehead and Hugenholtz, 2014)

    Prof. Salvatore Manfreda – Università degli Studi di Napoli Federico II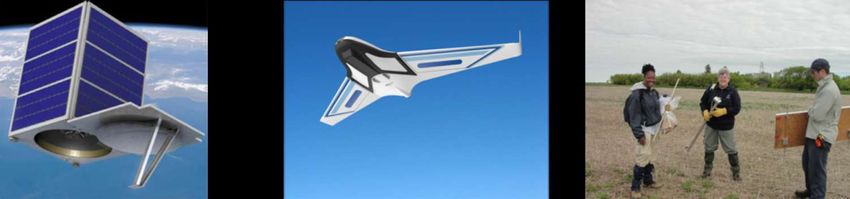
WG2
Vegetation Status
10
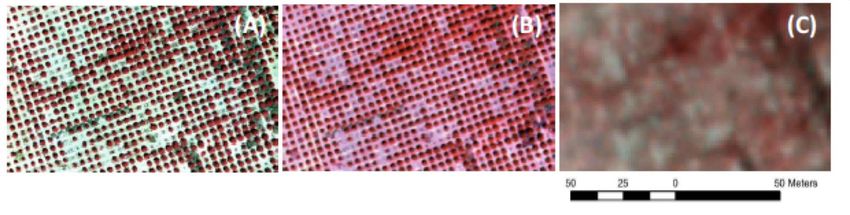
Comparison between a Satellite, CubeSat and UAS NDVI map
Multi-spectral false colour (near infrared, red, green) imagery collected over the RoBo Alsahba date palm farm
near Al Kharj, Saudi Arabia. Imagery (from L-R) shows the resolution differences between: (A) UAV mounted
Parrot Sequoia sensor at 50 m height (0.05 m); (B) a WorldView-3 image (1.24 m); and (C) Planet CubeSat data
(approx. 3 m), collected on the 13th, 29° and 27th March 2018, respectively.
Prof. Salvatore Manfreda – Università degli Studi di Napoli Federico IIWG3
Soil Water Content Monitoring
11
a) Soil moisture downscaling
workflow based on random
forest regression (RF);
b) The importance of land
surface features for the RF
model;
c) RF-based soil moisture
products at 15cm;
d) Comparison of the
downscaled soil moisture
with in-situ measurements.
(Su et al., Water 2020)
Prof. Salvatore Manfreda – Università degli Studi di Napoli Federico IIWG4
River Monitoring
12
Image Velocimetry
2-D flow velocity field derived using
an optical camera mounted on a
quadcopter hovering over a portion
of the Bradano river system in
southern Italy. One of the images
used for the analysis is shown as a
background, where surface
features used by flow tracking
algorithms are highlighted in the
insets (a, b).
(Manfreda and McCabe, Hydrolink 2019)
Prof. Salvatore Manfreda – Università degli Studi di Napoli Federico II13
Stream Flow Monitoring – Data Collection for
Benchmarking Optical Techniques
Image velocimetry data available for 13 case studies Article: (Perks et al., ESSD 2019)
Data: (Perks et al., ESSD 2019)
Prof. Salvatore Manfreda – Università degli Studi di Napoli Federico IIWG4
River Monitoring
14
Comparison among the most recent Image Velocimetry Techniques
(Pearce et al., Remote Sensing 2020)
Prof. Salvatore Manfreda – Università degli Studi di Napoli Federico IIWG4
River Monitoring
15 UAS data Collection: How to improve DSM accuracy
10 0 10 1
Fig. 1: Comparison of results obtained changing
(A) (B)
(A) (B) (C)
Single Flight Single Flight
the number of GCPs and adopting a single flight
Combined Flights Combined Flights
10 -1
10 0
RMSEX,Y (m)
RMSEZ (m)
10 -2
RMSE X,Y= 0.2cm RMSE Z= 10cm
or a two flights dataset on the plane (A) and z-
(D) (E) (F) 10 -3
10 -1
axes (B).
RMSE Z= 3.5cm
10 -4 10 -2
3 4 5 6 7 8 9 3 4 5 6 7 8 9
N. GCPs N. GCPs
Fig. 1 Fig. 2: RMSE of the 3D model as a function of the
mean distance between GCPs obtained for the
Relative change of RMSEX,Y (%)
500 300
Relative change of RMSEZ (%)
(B)
flight N.2 (A, B) and for the combination of
(A) 3 GCP 3 GCP
400 4 GCP 4 GCP
5 GCP 200 5 GCP
Fligth Fligth plan Level Camera Avg GSD Images 300 6 GCP 6 GCP
flights N.1 and N.4 (C, D).
7 GCP 7 GCP
Above the Tilt (cm/px ) 8 GCP 100 8 GCP
200 9 GCP 9 GCP
Ground (degree) R2=0.15
(m) 100 0
N.1 60 0° 1.9 276 0
-100 R2=0.08
-100
N.2 60 0° 1.9 268 -200 -200
0 50 100 150 0 5 10 15
Mean Planar Distance (m) Mean Vertical Distance (m)
N.3 60 70° - 271
Relative change of RMSEX,Y (%)
600 500
Relative change of RMSEZ (%)
(C) 3 GCP (D) 3 GCP
500 4 GCP 400 4 GCP
N.4 60 20° 2.0 273 400
5 GCP 5 GCP
6 GCP 300 6 GCP
7 GCP 7 GCP
300 8 GCP 8 GCP
2 9 GCP 200 9 GCP
N.5 60 0° 1.9 257 200 R =0.16
100 R2=0.00
3.3 85
100
0
0 UAS-based tiled Model
N.6 120 0° -100
-100
-200 -200
0 50 100 150 0 5 10 15
Mean Planar Distance (m) Mean Vertical Distance (m)
Fig. 2 (Manfreda et al., Drones 2019)
Prof. Salvatore Manfreda – Università degli Studi di Napoli Federico II16 Guidelines for UAS-based monitoring Action Deliverables
(Tmušić et al., Remote Sensing 2020)
Prof. Salvatore Manfreda – Università degli Studi di Napoli Federico IIThe influence of various study conditions on the output quality
17
of a UAS observation
• output product
• quality parameters
• software and hardware
• experiment design
• environmental conditions
• internal (affected) parameters
NB: The arrow color indicates the type of relationship: gray -
direct dependence, orange - inverse dependence.
(Tmušić et al., Remote Sensing 2020)
Prof. Salvatore Manfreda – Università degli Studi di Napoli Federico II18 Activities involved in UAS-based Mapping
(Tmušić et al., Remote Sensing 2020)
Prof. Salvatore Manfreda – Università degli Studi di Napoli Federico II19 (Dis)advantages of Different Platforms
(Tmušić et al., Remote Sensing 2020)
Prof. Salvatore Manfreda – Università degli Studi di Napoli Federico II20
Preliminary Checklist before Flying
(Tmušić et al., Remote Sensing 2020)
Prof. Salvatore Manfreda – Università degli Studi di Napoli Federico II21
Metadata Associated with
each UAS-survey
A detailed description of the flight characteristics and
preprocessing activities carried out on the published
data is extremely useful, not only for scientific
reproducibility, but also to guarantee a certain quality,
while also advancing and educating the broader field.
All potential variables and details about a survey are
listed in the UAS survey form reported herein.
(Tmušić et al., Remote Sensing 2020)
Prof. Salvatore Manfreda – Università degli Studi di Napoli Federico II22 Proposed UAS Environmental Mapping Workflow
(Tmušić et al., Remote Sensing 2020)
Prof. Salvatore Manfreda – Università degli Studi di Napoli Federico II23 Final Remarks
• UAS-based remote sensing provides new advanced procedures to monitor key variables,
including vegetation status, soil moisture content, and stream flow.
• The detailed description of such variables will increase our capacity to describe water
resource availability and assist agricultural and ecosystem management.
• HARMONIOUS COST Action is supporting the definition of standardized protocols for
UAS-based applications to improve reliability of such technology.
• Aim of the next activities is to specialize these guidelines on specific aspects and build
new tools to support the use of UAS for environmental monitoring.
Prof. Salvatore Manfreda – Università degli Studi di Napoli Federico II24 Publications produced by the COST Action HARMOIOUS
Tmušić, G.; Manfreda, S.; Aasen, H.; James, M.R.; Gonçalves, G.; Ben-Dor, E.; Brook, A.; Polinova, M.; Arranz, J.J.; Mészáros, J.; Zhuang, R.;
Johansen, K.; Malbeteau, Y.; de Lima, I.P.; Davids, C.; Herban, S.; McCabe, M.F. Current Practices in UAS-based Environmental
Monitoring, Remote Sensing, 12, 1001, 2020. [pdf]
Pearce, S.;R.; R. Ljubičić; S. Peña-Haro; M. Perks; F. Tauro; A. Pizarro; S.F. Dal Sasso; D. Strelnikova; S. Grimaldi; I. Maddock; G. Paulus; J.
Plavšić; D. Prodanović; S. Manfreda, An Evaluation of Image Velocimetry Techniques under Low Flow Conditions and High Seeding
Densities Using Unmanned Aerial Systems, Remote Sensing, 12, 232, 2020. [pdf]
Perks, M. T., S. Fortunato Dal Sasso, A. Hauet, S. Pearce, S. Peña-Haro, F. Tauro, S. Grimaldi, B. Hortobágyi, M. Jodeau, J. Le Coz, I.
Maddock, L. Pénard, and S. Manfreda, Towards harmonization of image velocimetry techniques for river surface velocity
observations, Earth System Science Data Discussion, 2019. [pdf]
Manfreda, S., S. F. Dal Sasso, A. Pizarro, F. Tauro, Chapter 10: New Insights Offered by UAS for River Monitoring, Applications of Small
Unmanned Aircraft Systems: Best Practices and Case Studies, CRC Press, Taylor & Francis Groups, 211, 2019.
Manfreda, S., M.F. McCabe. Emerging earth observing platforms offer new insights into hydrological processes, Hydrolink, 1, 8-9,
2019. [pdf]
Manfreda, S., P. Dvorak, J. Mullerova, S. Herban, P. Vuono, J.J. Arranz Justel, M. Perks, Assessing the Accuracy of Digital Surface Models
Derived from Optical Imagery Acquired with Unmanned Aerial Systems, Drones, 3(1), 15, 2019. [pdf]
Manfreda, S., M. F. McCabe, P. E. Miller, R. Lucas, V. Pajuelo Madrigal, G. Mallinis, E. Ben-Dor, D. Helman, L. Estes, G. Ciraolo, J. Müllerová,
F. Tauro, M. I. de Lima, J. L. M. P. de Lima, A. Maltese, F. Frances, K. Caylor, M. Kohv, M. Perks, G. Ruiz-Pérez, Z. Su, G. Vico, and B. Toth, On
the Use of Unmanned Aerial Systems for Environmental Monitoring, Remote Sensing, 10(4), 641; 2018. [pdf]
Prof. Salvatore Manfreda – Università degli Studi di Napoli Federico IIYou can also read