WHO WINS AT THE CHESS OLYMPICS? THE ROLE OF RESOURCES AND EDUCATION CAPITAL - Working Paper in Economics - David Forrest J.D Tena Carlos ...
←
→
Page content transcription
If your browser does not render page correctly, please read the page content below
Working Paper in Economics

                                   # 202013

                                   April 2020

     WHO WINS AT THE CHESS
      OLYMPICS? THE ROLE OF
    RESOURCES AND EDUCATION
             CAPITAL

                            David Forrest
                              J.D Tena
                       Carlos Varela-Quintana

https://www.liverpool.ac.uk/management/people/economics/
© authors
WHO WINS AT THE CHESS OLYMPICS? THE ROLE OF
RESOURCES AND EDUCATION CAPITAL
by
David Forresta
J.D Tenaa,b
and
Carlos Varela-Quintanac
Università degli Stud
a
University of Liverpool Management School, Chatham Street, Liverpool, L69 7ZH, UK
b
Department of Economics, University of Sassari and CRENoS, Via Muroni 25, Sassari, 07100, Italy.
c
Department of Economics, University of Oviedo, Avda. del Cristo s/n, Oviedo, 33006, Spain
Abstract: The paper investigates national team success at the principal tournament of a prominent
mind sport, chess. As in prior literature on physical sports, panel data estimation reveals population
and per capita gdp as strong predictors. But when we add a measure of education capital, per capita
income loses significance, suggesting that effects from income levels are mediated through schooling
in the case of a cerebral game. However, when we estimated a similar model to account for medal
wins at the Olympics, results were similar, implying that schooling levels are also relevant to success
in physical sports.
key words: education capital, economic resources, sports economics, chess, Olympics
JEL codes: Z20, I26, C52.
11. Introduction
In sports, nations seek to outdo each other to win prestige (or even soft power). Most sports
are physical and involve competition to ascertain, to borrow from the Olympics motto, who is fastest,
highest or strongest. But here we investigate a different sort of game, chess, where players need
cognitive ability rather than physical prowess. Its principal team tournament, the Chess Olympiad,
takes place every two years and attracted 185 national teams at its last edition. We ask what drives
national success at this Olympiad. We test for the influence of variables found in prior literature to
predict country success in physical sports. But, because chess is a mind sport, we assess also the
importance of education capital, based on the supposition that schooling develops cognitive skills.
Bernard and Busse (2004) analysed national success in physical sports, specifically at the
Olympics. They regressed country medal share on log (population) and log (per capita gdp), adding
dummy variables to capture hosting effects and over-performance by communist states, and found
each highly significant. Papers in a successor literature, whether or not employing additional
covariates, retained the essential features of the original model whether testing it on later editions of
the Games (Scelles et al., 2020) or on individual sports within the Olympics (Forrest et al., 2017) or in
international football (Gásquez and Royuela, 2016). All such papers confirm that countries with larger
populations and higher incomes tend to enjoy greater success.
We found that the standard variables from the Olympics literature also explained country
performance in chess. But in a cerebral game, a given population may be more likely to produce
strong players in a country with greater educational capital. We employed a covariate representing
average years of schooling, exploiting time-series maintained by the Institute for Health Metrics and
Evaluation (IHME) (healthdata.org), University of Washington. It proved to be significant and
rendered per capita income non-significant, suggesting that any effect from income was mediated
through investment in education. Further, when we applied the same modelling to the Olympic
Games, a similar result was obtained, implying that our findings are also relevant to physical sports.
2. The Chess Olympiad
We analyse results from the ‘Open Section’. Each country is permitted to enter one team but
the host is allowed additional teams (2-4 during our period). Teams of four each play the same
number of matches, currently eleven, the schedule following the ‘Swiss Tournament’ format. This
pairs first-round opponents based on pre-event rankings and, in subsequent rounds, teams play
opponents with similar cumulative points. Each match consists of four one-on-one games; two points
are earned for winning and one if the score is 2-2. Final tournament rankings are determined by total
tournament points.
Our dependent variable was a country’s percentage share of all points awarded in the
tournament. We employed a panel random-effects model with year dummies, estimated over thirteen
Olympiads. Bernard and Busse (2004) used tobit because most countries win zero medals at the
Olympics; but here there were only two cases where a country scored zero points.
23. Covariates
Country population and per_capita_gdp were obtained from annual World Bank data, the
latter measured at purchasing power parity in constant (2011) international dollars. A host dummy is
conventionally included to capture home advantage but here we also include ‘number of
additional_teams’ because hosts may accumulate more points simply because they are allowed to
field extra teams.
We modify political regime dummies from Bernard and Busse (2004) because our data
postdate the Cold War. We have separate dummies for ex_Soviet_Bloc countries according to whether
they have joined the EU. Generally communist countries may have performed well in sport because
the state could direct resources to delivering success. Countries which joined the EU may be less
likely to continue such arrangements though they may still over-perform because of legacy
institutional infrastructure. Another dummy signifies other socialist countries; China has its own
category.
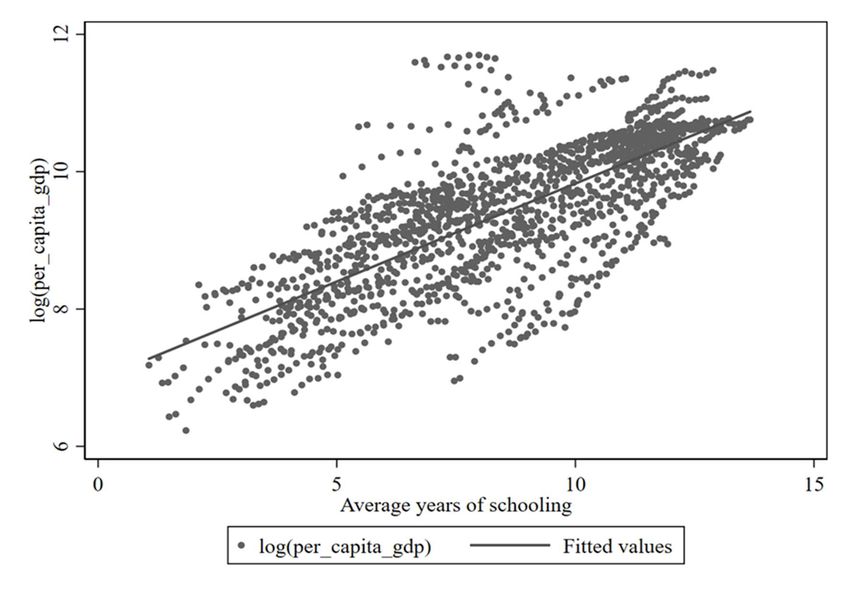
IHME provides country estimates of average number of years of schooling completed, for
each five-year age/ gender band in the population, with the value capped at 18. From these data, we
calculated a single figure for the whole population, deriving weights from population figures by age
and gender provided by IHME.1 The correlation between this statistic and log(per_capita_gdp) was
+.745 (Figure 1 provides a scatter-plot).
Figure 1. Schooling and log(per_capita_gdp)
1
For discussion of methods and data sources employed by IHME, see Lim et al. (2018).
3In the final version of our model, following Bernard and Busse (2004), we add a lagged
dependent variable. Sometimes this took the value zero because the country had not participated
before since it had been part of another (e.g. Czechoslovakia split). To avoid any resulting distortion,
we employ dummies to distinguish between countries which had not participated because they are a
new_country and those which had another_reason. Similarly, we include additional teams(t-1) since
the preceding host will have had an inflated points share from fielding those extra teams.
We estimate on a data set from which observations were excluded if information was not
available on all covariates (e.g. gdp estimates are unavailable for Andorra and Cuba).
4. Results
Table 1, column (1) reports a model where points share is regressed only on log(population)
and log(per_capita_ gdp). As in Bernard and Busse (2004), the coefficient estimates are highly
significant and similar in magnitude to each other, implying that it is the multiple of the two variables,
GDP, which drives success.
In column (2), we add host, which is positive and significant. However, its effect disappears
once it is taken into account that it fields more than one team (column (3)). There appears to be no
home advantage in chess.
In column (4), we add political variables. All four country groups with past or present
communist regimes tend to over-perform relative to their population and income levels. Post-Soviet
countries, even if now westward facing in the EU, are particularly strong.
In column (5), we add schooling. The coefficient estimate is highly significant (pWe find, then, that, in chess, any effect from per capita gdp is mediated mostly or entirely
through investment in schooling. The effect size is non-trivial, e.g. four extra years of schooling (the
difference between Taiwan and India in 2016) would increase expected points share by 0.128 pcp
(where mean points share across all countries is only 0.763%). Such a role for education capital is
perhaps to be expected if schooling aids cognitive development, given that chess is a cerebral sport.
That there is little residual role for income perhaps reflects that chess is a game with negligible costs
for equipment and facilities. Forrest et al. (2017) find that Olympic sports with lower resource inputs
exhibit only a shallow relationship between country income and performance.
(1) (2) (3) (4) (5) (6)
log(population) 0.0573*** 0.0531*** 0.0539*** 0.0558*** 0.0554*** 0.0390***
(0.0090) (0.0067) (0.0067) (0.0055) (0.0049) (0.0050)
log(per_capita_gdp) 0.0695*** 0.0601*** 0.0576*** 0.0674*** 0.0096 0.0137
(0.0114) (0.0099) (0.0101) (0.0078) (0.0111) (0.0088)
host 1.7282*** -0.0245 -0.0226 -0.0209 -0.0595
(0.2262) (0.1031) (0.1033) (0.1030) (0.1116)
additional_teams 0.8486*** 0.8471*** 0.8461*** 0.8774***
(0.0458) (0.0454) (0.0469) (0.0534)
ex_Soviet_bloc/non-EU 0.2734*** 0.1788*** 0.1316***
(0.0246) (0.0251) (0.0193)
ex_Soviet_bloc/EU 0.2137*** 0.1104*** 0.0798***
(0.0223) (0.0301) (0.0220)
socialist 0.1268*** 0.0805*** 0.0530***
(0.0140) (0.0166) (0.0121)
China 0.1182*** 0.0718*** 0.0483***
(0.0265) (0.0269) (0.0189)
schooling 0.0321*** 0.0190***
(0.0050) (0.0042)
points_share(t-1) 0.2846***
(0.0419)
additional_teams(t-1) -0.2168***
(0.0488)
new_country 0.3828***
(0.0740)
another_reason 0.1703***
(0.0287)
constant -0.5830*** -0.4514*** -0.4422*** -0.6061*** -0.2819** -0.2162**
(0.2186) (0.1674) (0.1678) (0.1327) (0.1305) (0.1069)
between-R2 0.545 0.652 0.663 0.833 0.856 0.910
within-R2 0.186 0.701 0.772 0.771 0.775 0.753
overall-R2 0.285 0.625 0.671 0.786 0.804 0.830
rho 0.300 0.495 0.558 0.383 0.349 0.0183
observations=1,515, estimated with year dummies, data period 1992-2016, 158 countries
standard errors, clustered by country, in parentheses. *** p5. The Olympics
Might education capital also play some role in determining success in physical sports? We
applied our model to medal shares at the Olympics over the period for which schooling was available.
The steps in Table 2 are as before except that the additional_teams variable is no longer relevant,
medal share is measured as a proportion rather than a percentage, to facilitate presentation and
comparison with Bernard and Busse (2004), and the model is a tobit because many observations of the
dependent variable are zero.
(1) (2) (3) (4) (5)
log(population) 0.0081*** 0.0080** 0.0075*** 0.00072*** 0.0043***
(0.0008) (0.0008) (0.0008) (0.0007) (0.0004)
log(per_capita_gdp) 0.0070*** 0.0066*** 0.0066*** 0.0018 0.0008
(0.0010) (0.0009) (0.0009) (0.0012) (0.0008)
host 0.0165*** 0.0165*** 0.0161*** -0.0142
(0.0024) (0.0024) (0.0024) (0.0021)
ex_Soviet_bloc/non-EU 0.0167*** 0.0061 0.0026
(0.0039) (0.0040) (0.0023)
ex_Soviet_bloc/EU 0.0109** -0.0023 -0.0017
(0.0051) (0.0051) (0.0021)
socialist 0.0118 -0.0135 -0.0082
(0.0126) (0.0151) (0.0075)
China 0.0437*** 0.0399*** 0.0253***
(0.0165) (0.0153) (0.0083)
schooling 0.0036*** 0.0023***
(0.0006) (0.0004)
medal_share (t-1) 0.4137***
(0.0276)
new_country 0.0037**
(0.0016)
another_reason 0.0022
(0.0024)
constant -0.1934*** -0.1870*** -0.1824** -0.1561*** -0.0923***
(0.2186) (0.0156) (0.0154) (0.0154) (0.0098)
log-likelihood 1535 1556 1570 1589 1710
observations=1,203, estimated with year dummies, data period 1992-2016, 158 countries
standard errors, clustered by country, in parentheses. *** pUntil schooling is introduced, results are strikingly similar to those reported in Bernard and
Busse (2004). Once schooling is added (column (4)), political variables lose significance except that
China remains a strong over-performer. As in the chess model, schooling is highly significant and
per_capita_gdp becomes non-significant in its presence. Also as before, results where schooling was
logged are less preferred from goodness-of-fit but we note that in that model per_capita_gdp retained
significance though with much diminished effect size.
As with chess, it appears that, at minimum, effects on Olympic achievement from country
wealth are substantially mediated through provision of schooling. Several explanations are possible.
Schooling level could be a better proxy for level of development than GDP. On the other hand, it is
plausible that schooling matters for all sports. First, even in physical sports, it might be that the very
best secure their advantage over the merely very good from using superior cognitive ability, fostered
by education investment. Second, sports and games are most widely played in education settings
where there are facilities, organised teams and instruction available. The longer the population is in
education, the greater the chance that potentially elite players will be revealed before they disappear
into the world of work. Further insight into the mechanisms by which education capital feeds into
national success might be gained from future research sport-by-sport.
References
Bernard, A.B., Busse, M.R. (2004). Who wins the Olympic Games: Economic resources and medal
totals. Review of Economics and Statistics, 86(1), 413-417.
Forrest, D., McHale, I.G., Sanz, I., Tena, J.D. (2017). An analysis of country medal shares in
individual sports at the Olympics. European Sport Management Quarterly, 17(2), 117-131.
Gásquez, R., Royuela, V. (2016). The determinants of international football success: A panel data
analysis of the Elo rating. Social Science Quarterly, 97(2), 125-141.
Lim, S.S., Updike, R.L., Kaldjian, A.S. et al. (2018). Measuring human capital: a systematic analysis
of 195 countries and territories, 1990–2016. The Lancet, 392 (10154), 1217-1234.
Scelles, N., Andreff, W., Bonnal, L. et al. (2020). Forecasting national medal totals at the Summer
Olympic Games reconsidered. Social Science Quarterly, 101(2), 697-711.
7You can also read