IMMIGRATION AND EDUCATION - THE CASE OF IRELAND - FRANCES MCGINNITY, ASSOCIATE RESEARCH PROFESSOR, ESRI - MAYNOOTH ...
←
→
Page content transcription
If your browser does not render page correctly, please read the page content below
Immigration and education –
       the case of Ireland
Frances McGinnity, Associate Research Professor, ESRI

  Presentation to the Maynooth Education Forum,
                   June 16th, 2017
Outline of presentation Nature of immigration to Ireland What are the implications of this for schools and for research on immigrant children? How do the children of immigrants fare in the Irish education system? (some evidence to date) Some policy issues Gaps and challenges for the future Concluding comments
Immigration to Ireland - Key
                Features
1. Rapid immigration during the economic boom,
   following decades of emigration
         - So no long tradition of foreign-born ‘established’ national/ethnic
        minorities, or experience of Irish society, and institutions with foreign-born
        minorities
        - high proportion of first generation immigrants in Ireland: in 2015, 17% of
        population was foreign-born - one of the highest in the EU (Eurostat).

2. Around 2/3rds of migrants European; 1/3 non-EU
• Initially immigrant flows were Irish, then UK/other EU15, Non-EU; after
  accession (2004) peak of East Europeans.
• Different rights and responsibilities of EU and non-EU
• Predominantly labour migrants, though some asylum seekers and students
  (an increasing proportion of Non-EU migrants)
Immigration, Emigration and Net
Migration, Ireland, 1987-2015 (000s)
200
150
100
Emigrants
50 Immigrants
Net migration
0
1987 1989 1991 1993 1995 1997 1999 2001 2003 2005 2007 2009 2011 2013 2015
-50
-100
Source: CSO Population and Migration Estimates, various releases. Year to April of ref. yearImmigration to Ireland - Key
Features 2
2. Culturally and linguistically very diverse: over 200
different nationalities (CSO, 2016) and 182 languages
(CSO 2012).
3. Predominantly White (Of non-Irish - 66% White; 9%
Black, 14% Asian, 10 % Other in 2016 Census)
4. Quite highly educated, esp non-EU migrants, partly
due to immigration policy (in 2015 almost half working
age non-Irish had 3rd level quals v 35% of Irish)Persons usually resident by nationality for selected countries 2006-2011
Nature of immigration -
           challenges for schools...
  Initially schools used to catering to a White, Catholic
Irish population so needed to adapt
  Most children first generation immigrants, they (and
their parents) may have poor English language skills and
knowledge of ‘system’
  Children come throughout the year, school (and DES)
schedules may not be not equipped for this
 Some groups particularly vulnerable – unaccompanied
minors, Roma children
Nature of immigration -
challenges for researchers...
Lack of consistent definitions of migrant children
in data sources – place of birth or ethnicity? parents
or children born abroad? how many parents born
abroad?
Many students from different backgrounds, often
need to be combined as numbers very small
Lack of administrative systems developed to
monitor their outcomesHow are the children of immigrants
distributed in schools?
Newcomers study in 2007/2008 found ‘newcomer children’
made up 10 per cent of primary school population and 6 per
cent of secondary population (Smyth et al 2009)
Distribution patterns very different at primary and secondary
However, immigrant students are overrepresented in larger
schools, schools located in urban areas and those with a socio-
economically disadvantaged intake (Byrne et al 2010)
Admission criteria such as ‘dates of application’ and ‘primary
school attended’ likely to disadvantage newcomers (Smyth et al
2009)
A recent newspaper article, based on school census returns for
2013/2014, highlights school segregation at primary level,
though similar patterns to those in 2007/2008.How are immigrant children faring in
Irish schools?
• What should we expect from international evidence?
• What is the educational profile of immigrant
parents?
• What are their expectations for their children?
• How do immigrant children fare academically? Do
their outcomes differ by country of origin?
• How do immigrant children fare in terms of school
engagement and well-being – at 9 and 13?Immigrant-native gap – international
evidence
Typically large differentials are observed between students
from an immigrant background and those who do not come from
this background in most advanced economies (see e.g. Brinbaum
and Heath 2007; Dronkers, 2010)
Some group/country variation but typically immigrant children
have poorer primary and secondary school grades, are less likely
to complete secondary school, attend shorter and less
demanding school careers (Heath, Rothon and Kilpi 2008).Immigrant-native gap –
proposed explanations
Assimilation (Chiswick), but ‘progress’ may differ
across groups (Portes, segmented assimilation)
Socio-economic disadvantage may account for much
of the gap (Heath et al 2008)
In addition to individual disadvantage, immigrants
may also live in disadvantaged neighbourhoods, go to
disadvantaged schools (segregation) (Kirsten, 2008)
Cultural reproduction theory – Bourdieu 1998–
immigrants may have lower cultural and social capital –
and/or their capital may not ‘translate’ well into host
country – they don’t know the ‘rules of the game’Defining migrants in Ireland: Mothers’
ethnicity and her place of birth (9 yr olds)
1.7%
1.5% Ireland
8.7%
UK
0.9% Western Europe
91.3% 0.6% Eastern Europe
Africa
Asia
3.3%
Source: Growing Up in Ireland, child cohort at age 9, 2007/2008.Income quintile of 9 year olds
100%
90%
80%
70%
60%
50%
40%
30%
20%
10%
0%
Irish NI/UK W. Europe E. Europe Africa Asia
Lowest 2nd 3rd 4th Highest
Source: Darmody et al., 2016. Household equivalised income.Education of mothers of 9 year olds
(Ireland, GUI data)
100%
90%
80%
70%
60%
50%
40%
30%
20%
10%
0%
Irish NI/UK W. Europe E. Europe Africa Asia
Primary/lower sec. Upper sec. Post-sec. Degree Post-grad
Source: McGinnity et al 2015Educational expectations of immigrant
parents v Irish (age 9, GUI)
100%
80%
60%
40%
20%
0%
Irish NI/UK W. Europe E. Europe Africa Asia
Junior Cert or lower Leaving Cert/Post-sec. Degree or higher
Source: Darmody et al., 2016Child’s attitudes to school (at age 9)
90%
80%
70%
60%
50%
40%
30%
20%
10%
0%
Ireland NI&UK Western Europe Eastern Europe Africa Asia
Always like school Always look forward to Always like teacher
Source: McGinnity et al., 2011Differences in academic outcomes at 9, reading and mathematics (GUI data) • Test scores in English reading at 9 vary between national groups, though the differences are not large. •Reading test scores are significantly lower among those from Eastern Europe, Asia and Africa, with the largest gap for Eastern Europeans. •To what extent is this due to socio-economic background, school, cultural and social capital differences? •Background and school attended explains part of this gap, greater role in played by cultural capital, esp language: gap in reading scores gap remains for children of East Europeans
Differences in academic outcomes at
     9, reading and mathematics (GUI)
• For mathematics, there is no penalty for the children of
Eastern European, Western European and Asian mothers,
even before controls.
•There is an initial modest difference between the children of
African mothers and Irish children but this disappears once
background characteristics, including financial hardship, are
taken into account.

In sum, the evidence on mean differences suggests some
differences between Irish and migrant children in English
reading and mathematics at age 9, particularly for Eastern
Europeans in reading and Africans in mathematics.
Achievement: Evidence from National Assessments (primary) and PISA (age 15) • At primary level, use national assessments in 2nd and 6th class (close to primary school curriculum) • In 2014, immigrant students in 6th class had lower scores in English reading than Irish peers, esp students from non-English speaking backgrounds (Kavanagh et al 2016) • The immigrant-Irish gap tend to be greater in 2nd class (reading and maths) • PISA (Programme for International Student Assessment) 2015 – ’literacy’ in reading, mathematics and esp science • No significant difference between immigrant students and Irish students in science or mathematics but • Immigrant students from non-English speaking backgrounds have lower scores in English reading at 15
Well-being and school experiences
        among 9 and 13 year olds
•   Smyth (2016) uses GUI child cohort to look at well-being among the same
    children at 9 (primary school) to 13 (second-level) in Ireland
•   At both time-points, children were asked to complete the Piers-Harris
    questionnaire, an internationally validated scale, which taps into six
    aspects of how children perceive themselves: behaviour, academic self-
    image, anxiety, popularity, body image and happiness.
•   AT AGE 9, children from immigrant families see themselves as less
    popular, are less happy and more anxious, report poorer behaviour, and
    are more self-critical of their academic abilities and their body image.
•   BUT BY 13 children from immigrant families do not differ from their Irish
    peers in any of these measures of well-being.
Well-being and school experience at 9
14
12
10
8
6
4
2
0
Behaviour Freedom from Happiness Intellectual Physical app. Popularity
anxiety
Irish Immigrant
Source: Smyth, 2016, using GUI child cohort at age 9.Immigrant children and
education policy 1
All children in Ireland have access to first and second-level
education, (almost) free of charge
At third level, EU citizens pay EU fees: since 2014, some non-EU
students who have been to school in Ireland for at least five years
qualify for free fees (e.g. those who have acquired Irish citizenship,
refugees, permission to remain). High non-EU fees still an issue for
those who do not qualify.
School patronage relevant to migrants, as many are non-Catholic,
given Catholic dominance in education, esp at primary level. A forum
was set up in 2011, and report pointed to potential for divestment of
patronage (Coolahan et al., 2012)
Some changes though progress has been slow (10 schools divested) ,
progress to be accelerated (DES Jan 2017)Immigrant children and
education policy 2
Admission: Smyth et al (2009) found evidence on how school admission
policies may exclude migrants – waiting lists, parental attendance, though July
2016 (Admission to Schools) Bill was introduced to change enrolment process
Intercultural education strategy 2010-2015 was launched Sept 2010, with
English language tuition a large part of financial resources - but lack of
monitoring of strategy and its effectiveness since.
The Integration Unit in DES was disbanded, and assignment of teachers for
special needs and English language merged under a general allocation model
(GAM), based on number of students
Thus no longer possible to monitor spending on English language tuition in
schools.Gaps and future research
challenges
Know relatively little about transition to third
level by the children of immigrants in Ireland
Useful to know distribution of immigrants in
schools, both primary and secondary, on a
regular basis
Useful to have disaggregated statistics on
performance in state examsSummary More recent migration history, diversity of immigrants and relatively high qualifications of immigrant parents in Ireland mean experience differs from some other EU countries Immigrant children (at 9) have positive attitudes to school and their parents have high aspirations However the is a gap in English reading scores between immigrants and Irish peers, esp for East Europeans. No overall gap in mathematics at 9, though African scores slightly lower. Monitoring policy effort on migrant children, student outcomes and school segregation crucial to avoid problems in the future – and there is more work still to be done here
Thanks for your attention!
See www.esri.ie and
http://www.esri.ie/growing-up-in-ireland/
for more infoSome further reading Smyth (2016) Well-being and school experiences among 9 and 13 year olds: Insights from the Growing Up in Ireland Study. Dublin: ESRI. Darmody, M., McGinnity, F. And Kingston, G. (2016), The experiences of migrant children in Ireland; Chapter 9 in Williams et al. ‘Cherishing all children equally?’ Dublin: Oak Tree Press. McGinnity, F., Darmody, M. and Murray, A. (2015), Academic achievement among immigrant children in Irish primary schools, ESRI WP No. 512. McGinnity, F. Quinn, E., Kingston, G. and O’Connell, P.J. (2012) Annual Monitoring Report on Integration 2011 Dublin: ESRI/Integration Centre. Darmody, M., Smyth, E., Byrne, D. and McGinnity, F. (2011b), "New school, new system: the experiences of immigrant students in Irish schools" in Z. Bekerman & T. Geisen, (eds.), International Handbook of Migration, Minorities and Education , Springer. Byrne, D., McGinnity, F., Smyth, E., Darmody, M., (2010) ‘Immigration and School Composition in Ireland’ Irish Educational Studies, Vol 29 No. 3, pp.271-288. Smyth, E., Darmody, M., McGinnity, F., & Byrne, D. (2009). Adapting to Diversity: Irish Schools and Newcomer Students. Dublin: Economic and Social Research Institute.
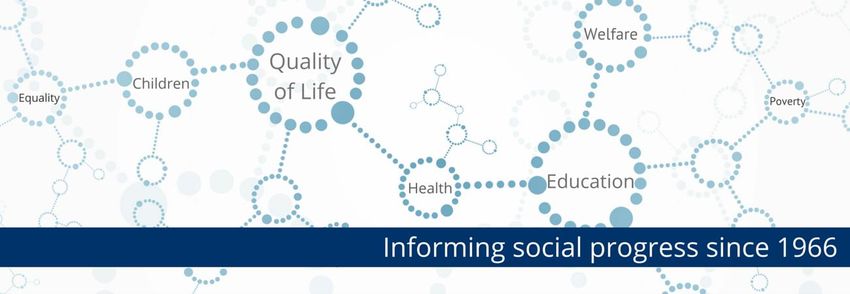
Differences in Reading Test Scores between Irish
and Migrant Children, by National Group, Controlling for a
Range of Other Factors

          NI/UK        W. Europe   E. Europe        Africa             Asia
    4
    2
    0
   -2
   -4
   -6
   -8
  -10
              Nationality              Economic background
              School                   Education/cultural activities
              Social integration
Differences in Math Test Scores between Irish
and Migrant Children, by National Group, Controlling for a
Range of Other Factors
NI/UK W. Europe E. Europe Africa Asia
3
2
1
0
-1
-2
-3
Nationality Economic background
School Education/cultural activities
Social integrationAcademic integration in schools
(Adapting to Diversity Study)
70.0
60.0
50.0
40.0 above average
average
30.0
below average
20.0
10.0
.0
Achievement Motivation AspirationsPercentage of immigrant children attending DEIS
(Urban, Band 1) GUI, Age 9, 2007-2008
30
25
20
15
10
5
0
Irish UK West European East European African AsianYou can also read