LOWESTOFT SOUTH ELECTORAL DIVISION PROFILE 2021 - www.suffolkobservatory.info - Suffolk Observatory
←
→
Page content transcription
If your browser does not render page correctly, please read the page content below
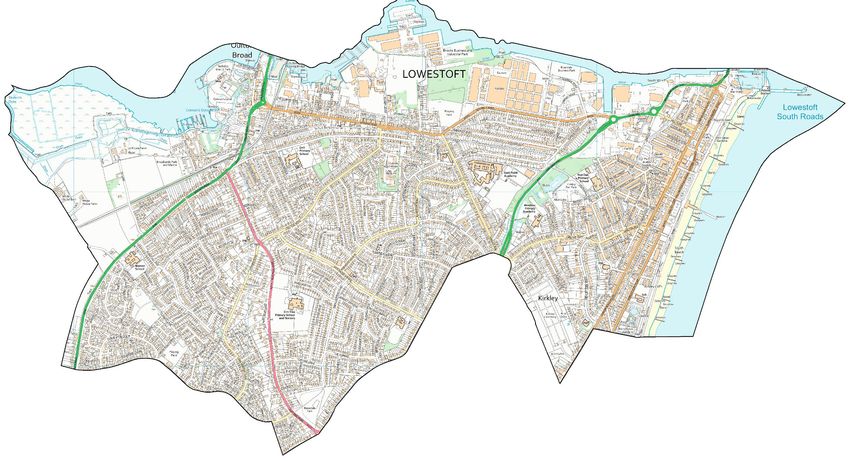
LOWESTOFT
SOUTH
ELECTORAL DIVISION PROFILE 2021
This Division comprises parts of Carlton & Whitton, Kirkley & Pakefield and
Oulton Broad Wards

            www.suffolkobservatory.info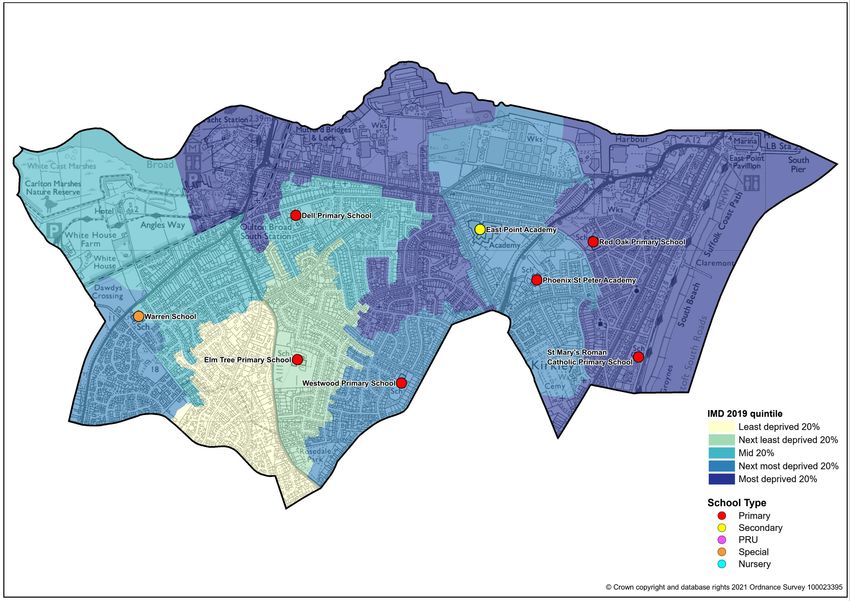
2
© Crown copyright and database rights 2021 Ordnance Survey 100023395
CONTENTS

▪   Demographic Profile: Age & Ethnicity
▪   Economy and Labour Market
▪   Schools & NEET
▪   Index of Multiple Deprivation
▪   Health
▪   Crime & Community Safety
▪   Additional Information
▪   Data Sources

                            3
ELECTORAL DIVISION PROFILES: AN INTRODUCTION
These profiles have been produced to support elected members, constituents and other
interested parties in understanding the demographic, economic, social and educational
profile of their neighbourhoods. We have used the latest data available at the time of
publication.
Much more data is available from national and local sources than is captured here, but it is
hoped that the profile will be a useful starting point for discussion, where local knowledge and
experience can be used to flesh out and illuminate the information presented here.
The profile can be used to help look at some fundamental questions e.g.
• Does the age profile of the population match or differ from the national profile?
• Is there evidence of the ageing profile of the county in all the wards in the Division or just
some?
• How diverse is the community in terms of ethnicity?
• What is the impact of deprivation on families and residents?
• Does there seem to be a link between deprivation and school performance?
• What is the breakdown of employment sectors in the area?
• Is it a relatively healthy area compared to the rest of the district or county?
• What sort of crime is prevalent in the community?
A vast amount of additional data is available on the Suffolk Observatory
www.suffolkobservatory.info
The Suffolk Observatory is a free online resource that contains all Suffolk’s vital statistics; it is
the one-stop-shop for information and intelligence about Suffolk. Through data, reports and
maps, the Suffolk Observatory provides a comprehensive picture of the County. It is a great
source for useful facts and figures that can be used for writing reports and presentations,
informing strategic and business planning, preparing funding applications or supporting
academic research. Data is presented around the key themes of population, children and
young people, health and social care, housing, crime and community safety, deprivation,
economy and employment and environment. All areas of the county are covered, right down
to district, electoral division, ward and parish level, with information easily accessible in a
variety of formats. You can also build your own reports for custom areas.
Technical Notes:
1. Where electoral divisions do not exactly match the boundaries at which the data is
available (e.g. ward, Output Area or Lower Super Output Area), we have adopted a
“best-fit” approach to produce a dataset.
2. District, county and national level data is provided where possible to provide a context
for comparisons. Where possible we have used the most recent district boundaries for
comparison purposes, but in some cases it has been necessary to use the pre-2019
districts.
4DEMOGRAPHIC PROFILE - AGE
In mid-2019, the population of Lowestoft South stood at 19,635, an increase of 1.8% since
the 2011 Census. The age structure of the component wards and the division as a whole is
set out below.
Lowestoft South
Carlton & Whitton Kirkley & Pakefield Oulton Broad
Division
All Ages 19,635 10,034 7,913 1,688
0-4 1,012 517 402 93
5-9 1,191 574 506 111
10-14 1,178 600 481 97
15-19 1,022 548 406 68
20-24 979 474 434 71
25-29 1,093 467 537 89
30-34 1,099 508 501 90
35-39 1,087 485 502 100
40-44 1,033 503 436 94
45-49 1,215 592 525 98
50-54 1,320 660 556 104
55-59 1,360 651 615 94
60-64 1,182 613 469 100
65-69 1,219 646 459 114
70-74 1,413 871 394 148
75-79 831 500 240 91
80-84 689 419 198 72
85-89 467 271 159 37
90+ 245 135 93 17
90+
85-89
80-84
75-79
70-74
65-69
60-64
55-59
50-54
45-49
40-44
35-39
30-34
25-29
20-24
15-19
10-14
5-9
0-4
10% 8% 6% 4% 2% 0% 2% 4% 6% 8% 10%
England - females England - males Lowestoft South - females Lowestoft South - males
▪ The age pyramid for Lowestoft South shows a higher-than-average proportion of people
aged 55 and over.
5▪ The most common age group in Lowestoft South is 70–74-year-olds followed by 55-59-
year-olds.
▪ Like many parts of Suffolk there is a lower than average proportion of people of working
age, particularly 20-39-year-olds.
ETHNICITY
100%
90%
80%
70%
60%
50%
40%
30%
20%
10%
0%
Lowestoft South East Suffolk Suffolk England
▪ According to the latest data (2011 Census), 97.3% (18,778) of the population of Lowestoft
South are white, slightly above the county average.
▪ There are 516 (2.7%) people of minority ethnic origin in the division.
▪ Lowestoft South has a similar diversity profile to East Suffolk district, and generally lower
proportions of minority ethnic groups than Suffolk as a whole.
Total
Asian and Black and Other
All minority
White White British Mixed Asian Black Ethnic
people ethnic
British British Group
population
Count Count % Count % Count % Count % Count % Count % Count %
Lowestoft South 19,294 18,778 97.3 18,365 95.2 248 1.3 159 0.8 81 0.4 28 0.1 516 2.7
East Suffolk 239,552 232,565 97.1 227,040 94.8 2,728 1.1 2,991 1.2 925 0.4 343 0.1 6,987 2.9
Suffolk 728,163 693,195 95.2 661,458 90.8 12,472 1.7 13,131 1.8 6,854 0.9 2,511 0.3 34,968 4.8
England 85.4 79.8 2.3 7.8 3.5 1.0 14.6
6ECONOMY
There are 5,000 people employed in Lowestoft South.
20%
18%
16%
14%
12%
10%
8%
6%
4%
2%
0%
Lowestoft South East Suffolk Suffolk England
▪ The health sector accounts for more than one in six jobs in Lowestoft South.
▪ Wholesale, retail and motor trades also provides a significant proportion of employment in
the division (17% - similar to the level across East Suffolk, Suffolk county and England).
▪ Education, accommodation and food services and public administration are also
important sectors in Lowestoft South, with these five sectors together accounting for two-
thirds of employment in the division.
7LABOUR MARKET
OUT-OF-WORK BENEFIT CLAIMANT RATE
9%
8%
7%
6%
5%
4%
3%
2%
1%
0%
Jan-18
Mar-18
Jun-18
Jul-18
Jan-19
Mar-19
Jun-19
Jul-19
Jan-20
Mar-20
Jun-20
Jul-20
Jan-21
Feb-18
Feb-19
Feb-20
Aug-18
Sep-18
Nov-18
Dec-18
Aug-19
Sep-19
Nov-19
Dec-19
Aug-20
Sep-20
Nov-20
Dec-20
May-18
Apr-18
Oct-18
Apr-19
May-19
Oct-19
Apr-20
May-20
Oct-20 Lowestoft South East Suffolk Suffolk England
▪ Lowestoft South saw a sharp increase in claimants of out-of-work benefits in the first half
of 2020 as a result of the onset of the COVID-19 pandemic.
▪ The out-of-work benefit claimant rate in Lowestoft South has been consistently around
three to four percentage points higher than the East Suffolk and county averages.
▪ In percentage terms, around 8% of the working age population (aged 16-64) are claiming
out-of-work benefits in Lowestoft South, compared to 4.9% across Suffolk.
8SCHOOLS
SCHOOL INFORMATION
Schools in the Division
Average cohort size at:
Stage (age 5)
KS2 (age 11)
KS4 (age 16)
KS5 (age 18)
Foundation
Academy
Status
Latest
Latest Ofsted Ofsted
Date
Name Phase
Requires
Dell Primary School Primary AS 52 53 0 0 21/06/2018
improvement
Elm Tree Primary Requires
Primary AS 49 45 0 0 03/10/2018
School improvement
Phoenix St Peter Requires
Primary AS 30 22 0 0 27/06/2018
Academy improvement
Red Oak Primary
Primary AS 57 49 0 0 Good 08/02/2017
School
St Mary's Roman
Primary AC 30 30 0 0 Good* 20/04/2015
Catholic Primary School
Westwood Primary
Primary AS 29 29 0 0 Good 23/02/2017
School
East Point Academy Secondary AS 0 0 104 0 Good 12/10/2016
Warren School Special AS 0 6 7 0 Inadequate* 15/11/2017
Schools with catchments that overlap with the Division
Average cohort size at:
Stage (age 5)
KS2 (age 11)
KS4 (age 16)
KS5 (age 18)
Foundation
Academy
Status
Latest
Latest Ofsted Ofsted
Date
Name Phase
Requires
Grove Primary School Primary AS 43 41 0 0 13/02/2019
improvement
Requires
Pakefield High School Secondary AC 0 0 177 0 26/04/2018
improvement*
Academy Status key: AS = Academy Sponsored, AC = Academy Converter, LA = LA
Maintained, F = Free
*The latest full inspection judgement does not relate to the current school
9SCHOOL ATTAINMENT
Foundation Stage Profile (reception)
% pupils achieving Good Level of Development (GLD)
100%
90%
80%
70%
60%
50%
40%
30%
20%
10%
0%
2017 2018 2019
Dell Primary School Elm Tree Primary School
Phoenix St Peter Academy Red Oak Primary School
St Mary's Roman Catholic Primary School Westwood Primary School
Suffolk National
▪ Foundation Stage performance at Lowestoft South schools has varied somewhat over the
past three years, but the general trend is for improving attainment levels. In 2019,
attainment at four of the six schools in the division was above the national average.
▪ Westwood Primary is the only school in the division to have consistently seen the
percentage of its pupils achieving a Good Level of Development at a higher level than the
county and national average from 2017 to 2019.
▪ Average attainment of pupils at Elm Tree Primary School has been consistently below
average during this period.
10Key Stage 2 (age 11)
% pupils achieving the Expected Level or better in Reading, Writing and Mathematics
90%
80%
70%
60%
50%
40%
30%
20%
10%
0%
2017 2018 2019
Dell Primary School Elm Tree Primary School
Phoenix St Peter Academy Red Oak Primary School
St Mary's Roman Catholic Primary School Westwood Primary School
Suffolk National
▪ Key Stage 2 attainment at three Lowestoft South schools; Red Oak Primary, St Mary’s
Roman Catholic Primary and Westwood Primary, has been consistently above the county
and national averages over the last three years of available data.
▪ KS2 attainment at Elm Tree Primary and Phoenix St Peter Academy was below average
in each year from 2017 to 2019.
▪ Attainment at Dell Primary School improved markedly in 2019 and matched the national
average of 65% of pupils achieving the expected level or better in reading, writing and
mathematics.
11Key Stage 4 (GCSE) (age 16)
% pupils achieving level 4-9 in English and Mathematics
80%
70%
60%
50%
40%
30%
20%
10%
0%
2017 2018 2019
East Point Academy Suffolk National
▪ GCSE attainment at East Point Academy was above the county average in 2017 and
2018 but dipped in 2019.
▪ The latest results show just under half of pupils achieving level 4-9 in English and
mathematics at the school, compared to 65% nationally and 62% in Suffolk.
12NEET % (NOT IN EDUCATION, EMPLOYMENT OR TRAINING)
12%
10%
8%
6%
4%
2%
0%
Lowestoft South East Suffolk Suffolk
▪ In January 2021, 5.3% of 16–18-year-olds in Lowestoft South were classified as NEET
(where current activity is known).
▪ NEET levels in Lowestoft South are consistently higher than the district and county
averages, though the gap has reduced in the last couple of years.
13INDEX OF MULTIPLE DEPRIVATION (IMD) 2019 (SEE MAP
OVERLEAF)
The IMD combines a number of indicators, chosen to cover a range of economic, social and
housing issues, into a single deprivation score for each small area in England. This allows
each area to be ranked relative to one another according to their level of deprivation. Small
areas (Lower Super Output Areas, average population 1,700) are most commonly described
as being in 1 of 5 quintile bands. The bottom quintile represents the 20% of areas that are
the most deprived in England; these are shaded pale yellow on the map. The top quintile
represents the least deprived areas in England and is shaded dark blue.
The Index is widely used to analyse patterns of deprivation, identify areas that would benefit
from special initiatives or programmes and as a tool to determine eligibility for specific
funding streams.
45%
% of population by deprivation quintile of residence
40%
35%
30%
25%
20%
15%
10%
5%
0%
Most deprived 20% Next most deprived Mid 20% Next least deprived Least deprived 20%
20% 20%
Lowestoft South East Suffolk England
▪ The IMD 2019 shows that deprivation levels in Lowestoft South are very varied, with parts
of the division among each deprivation quintile, from the least deprived 20% in England to
the most deprived 20%.
▪ Of the thirteen Lower Super Output Areas (LSOA) comprising the division, one is ranked
in the top 20% least deprived LSOAs in the country, one is in the next best quintile, two
are in the mid quintile, four are in the second most deprived quintile and five are in the
most deprived quintile.
▪ This deprivation profile means that around 70% of the population of the division live in
areas ranked among the 40% most deprived in England.
1415
HEALTH
The local data used here is based on relatively small numbers. The confidence limits provide
an indication of the reliability of the data. The 95% confidence intervals utilised on the chart
provide a range within which there is 95% chance of the true result lying.

LIFE EXPECTANCY AT BIRTH
    86
    84
    82
    80
    78
    76
    74
    72
    70
               Lowestoft South                East Suffolk                     Suffolk                       England

                            Life expectancy at birth for males        Life expectancy at birth for females

▪        Estimated life expectancy at birth in Lowestoft South are below the East Suffolk and
         Suffolk averages for both males and females.
▪        The life expectancy estimate for women is 81.4, compared to 83.8 in East Suffolk, 84.3 in
         Suffolk and 83.4 in England.
▪        For men, the estimated life expectancy at birth in Lowestoft South is 77.6, around 3 years
         below the average across the county. This is one of the lowest life expectancy estimates
         of any Suffolk division.

DEATHS, UNDER 75 YEARS, STANDARDISED MORTALITY RATIO
    180
    160
    140
    120
    100
     80
     60
     40
     20
      0
             Deaths from all causes,    Deaths from all cancers,       Deaths from circulatory        Deaths from causes
                under 75 years              under 75 years             disease, under 75 years     considered preventable (all
                                                                                                             ages)

                                       Lowestoft South       Waveney      Suffolk        England

▪        In Lowestoft South, the estimated rate of deaths from all causes, cancer and circulatory
         disease is above the East Suffolk, Suffolk and England average.
▪        The standardised mortality ratio data shown here means that for every 100 early deaths
         from all causes across England as a whole, there are an estimated 122 comparable
         deaths in Lowestoft South.
                                                                 16
CRIME & COMMUNITY SAFETY
90
80
70
60
50
40
30
20
10
0
Lowestoft South East Suffolk Suffolk England
Burglary Criminal damage and arson Drugs
Public order Shoplifting Other theft
Vehicle crime Violence and sexual offences Other
▪ Crime levels are relatively high in Lowestoft South, with 83.5 crimes per 1,000 residents
in the year to January 2021, more than the district and county averages of 59 and 66
respectively.
▪ The most commonly committed crimes in the division during this period fall under the
category of violence and sexual offences. This is the case across the county and England
as a whole.
▪ Rates of all types of crime are higher in Lowestoft South than the Suffolk average with the
exception of burglary, shoplifting and vehicle crime.
ADDITIONAL INFORMATION
Parishes in Division
Lowestoft (part)
Oulton Broad (part)
17DATA SOURCES
Category Indicator Source
ONS 2019 mid-year population
Quinary population table 2019
estimates
Demographic ONS 2019 mid-year population
Population pyramid 2019
Profile estimates
Ethnicity 2011 ONS 2011 Census
ONS Business Register and
Economy Employment by broad industrial sector 2019 Employment Survey via
NOMIS
Claimant count: The number of people claiming
Jobseeker's Allowance plus those who claim
Labour market DWP via NOMIS
Universal Credit who are out of work (% 16-64
population) January 2018- February 2021
School information and attainment 2017-2019 Suffolk County Council
Education % 16-18-year-olds NEET (Not in Employment, Suffolk County Council via the
Education or Training) 2017-2021 Suffolk Observatory
Ministry for Housing,
Deprivation Index of Multiple Deprivation 2019 Communities and Local
Government
Health Life expectancy at birth 2013-2017 Public Health England
Standardised mortality ratio for deaths from all
causes, cancer and circulatory disease, (aged
under 75), and death from causes considered
Health preventable (all ages), 2013-2017. The Public Health England
standardised mortality ratio is the ratio of
observed deaths in the study group to expected
deaths in the general population.
Community Recorded crime rate per 1,000 resident Data.police.uk via the Suffolk
Safety population February 2020 to January 2021 Observatory
For more data and information about Lowestoft South Electoral Division, see the
Suffolk Observatory www.suffolkobservatory.info
1819
You can also read