CLARE ELECTORAL DIVISION PROFILE 2021 - www.suffolkobservatory.info - Suffolk Observatory
←
→
Page content transcription
If your browser does not render page correctly, please read the page content below
CLARE
ELECTORAL DIVISION PROFILE 2021
This Division comprises Withersfield Ward in its entirety plus part of
Whepstead & Wickhambrook, Clare, Hundon & Kedington and Chedburgh &
Chevington Wards

           www.suffolkobservatory.info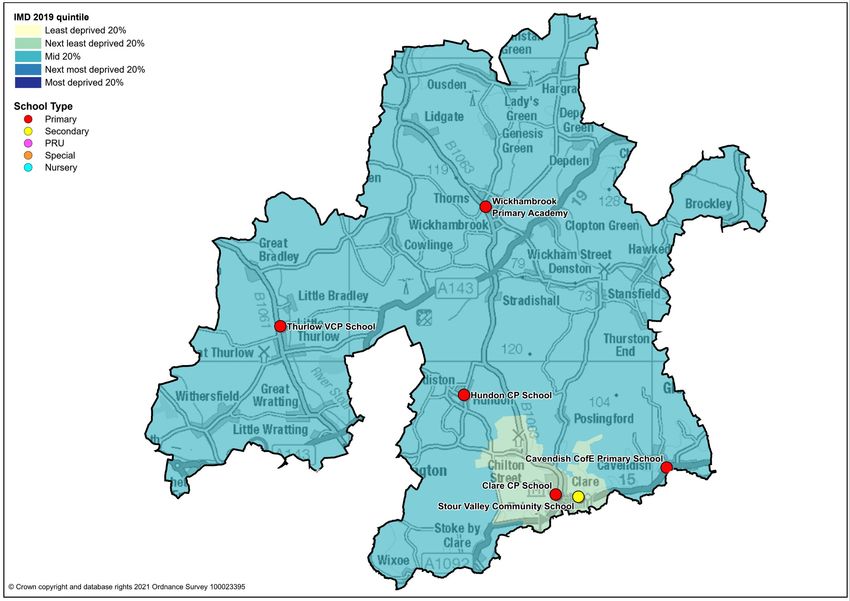
© Crown copyright and database rights 2021 Ordnance Survey 100023395
CONTENTS

▪   Demographic Profile: Age & Ethnicity
▪   Economy and Labour Market
▪   Schools & NEET
▪   Index of Multiple Deprivation
▪   Health
▪   Community Safety
▪   Data Sources

                            3
ELECTORAL DIVISION PROFILES: AN INTRODUCTION
These profiles have been produced to support elected members, constituents and other
interested parties in understanding the demographic, economic, social and educational
profile of their neighbourhoods. We have used the latest data available at the time of
publication.
Much more data is available from national and local sources than is captured here, but it is
hoped that the profile will be a useful starting point for discussion, where local knowledge and
experience can be used to flesh out and illuminate the information presented here.
The profile can be used to help look at some fundamental questions e.g.
• Does the age profile of the population match or differ from the national profile?
• Is there evidence of the ageing profile of the county in all the wards in the Division or just
some?
• How diverse is the community in terms of ethnicity?
• What is the impact of deprivation on families and residents?
• Does there seem to be a link between deprivation and school performance?
• What is the breakdown of employment sectors in the area?
• Is it a relatively healthy area compared to the rest of the district or county?
• What sort of crime is prevalent in the community?
A vast amount of additional data is available on the Suffolk Observatory
www.suffolkobservatory.info
The Suffolk Observatory is a free online resource that contains all Suffolk’s vital statistics; it is
the one-stop-shop for information and intelligence about Suffolk. Through data, reports and
maps, the Suffolk Observatory provides a comprehensive picture of the County. It is a great
source for useful facts and figures that can be used for writing reports and presentations,
informing strategic and business planning, preparing funding applications or supporting
academic research. Data is presented around the key themes of population, children and
young people, health and social care, housing, crime and community safety, deprivation,
economy and employment and environment. All areas of the county are covered, right down
to district, electoral division, ward and parish level, with information easily accessible in a
variety of formats. You can also build your own reports for custom areas.
Technical Notes:
1. Where electoral divisions do not exactly match the boundaries at which the data is
available (e.g. ward, Output Area or Lower Super Output Area), we have adopted a
“best-fit” approach to produce a dataset.
2. District, county and national level data is provided where possible to provide a context
for comparisons. Where possible we have used the most recent district boundaries for
comparison purposes, but in some cases it has been necessary to use the pre-2019
districts.
4DEMOGRAPHIC PROFILE - AGE
In mid-2019, the population of Clare stood at 11,811, an increase of 3.2% since the 2011
Census. The age structure of the component wards and the division as a whole is set out
below.
Clare, Hundon Whepstead & Chedburgh &
Clare Division Withersfield
& Kedington Wickhambrook Chevington
All Ages 11,811 6,370 2,440 2,054 947
0-4 451 229 119 68 35
5-9 515 282 92 96 45
10-14 568 313 97 113 45
15-19 496 245 94 93 64
20-24 485 255 134 65 31
25-29 624 372 158 65 29
30-34 741 392 230 89 30
35-39 636 372 143 85 36
40-44 609 342 122 108 37
45-49 838 442 187 134 75
50-54 896 456 192 156 92
55-59 984 480 223 182 99
60-64 851 417 171 191 72
65-69 813 430 140 167 76
70-74 907 517 136 184 70
75-79 623 345 109 115 54
80-84 393 242 57 65 29
85-89 236 139 30 48 19
90+ 145 100 6 30 9
90+
85-89
80-84
75-79
70-74
65-69
60-64
55-59
50-54
45-49
40-44
35-39
30-34
25-29
20-24
15-19
10-14
5-9
0-4
10% 8% 6% 4% 2% 0% 2% 4% 6% 8% 10%
England - females England - males Clare - females Clare - males
▪ The age pyramid for Clare shows a higher-than-average proportion of people over the
age of 50, particularly females.
5▪ The most common age group in Clare is 55-59, followed by 70-74.
▪ There are much lower numbers of people under the age of 40 than the national average,
in particular females aged 20-40.
▪ There is a large proportion of males aged 30-34 in the division due to the presence of
HMP Highpoint.
ETHNICITY (%)
100%
90%
80%
70%
60%
50%
40%
30%
20%
10%
0%
Clare West Suffolk Suffolk England
▪ According to the latest data (2011 Census), 94.9% (10,851) of the population of Clare are
white.
▪ There is a slightly lower proportion, 5.1%, of people of minority ethnic origin in the
division, compared to West Suffolk.
▪ The diversity profile of Clare is broadly similar to both West Suffolk and the county as a
whole.
Total
Asian and Black and Other
All minority
White White British Mixed Asian Black Ethnic
people ethnic
British British Group
population
Count Count % Count % Count % Count % Count % Count % Count %
Clare 11,440 10,851 94.9 10,433 91.2 148 1.3 169 1.5 247 2.2 25 0.2 589 5.1
West Suffolk 170,756 161,522 94.6 147,381 86.3 3,148 1.8 3,087 1.8 2,198 1.3 801 0.5 9,234 5.4
Suffolk 728,163 693,195 95.2 661,458 90.8 12,472 1.7 13,131 1.8 6,854 0.9 2,511 0.3 34,968 4.8
England 85.4 79.8 2.3 7.8 3.5 1.0 14.6
6ECONOMY
There are 3,000 people employed in Clare.
25%
20%
15%
10%
5%
0%
Clare West Suffolk Suffolk England
▪ The key employment sectors in Clare are public administration and defence and
manufacturing.
▪ These sectors are particularly important as they employ a larger proportion of people in
Clare than the national average; more than a third of employees in the division work in
these sectors.
▪ Education, accommodation and food services and wholesale, retail and motor trades also
account for between 1 in 9 and 1 in 11 jobs in the Clare.
7LABOUR MARKET
OUT-OF-WORK BENEFIT CLAIMANT RATE
7%
6%
5%
4%
3%
2%
1%
0%
Jan-18
Jul-18
Mar-18
Jun-18
Jan-19
Jul-19
Mar-19
Jun-19
Jan-20
Mar-20
Jun-20
Jul-20
Jan-21
Feb-18
Feb-19
Feb-20
Aug-18
Sep-18
Nov-18
Dec-18
Aug-19
Sep-19
Nov-19
Dec-19
Aug-20
Sep-20
Nov-20
Dec-20
May-18
Apr-18
Oct-18
Apr-19
May-19
Oct-19
Apr-20
May-20
Oct-20 Clare West Suffolk Suffolk England
▪ Clare saw a sharp increase in claimants of out-of-work benefits in the first half of 2020 as
a result of the COVID-19 pandemic, much like the rest of the county and indeed England
as a whole.
▪ Claimant unemployment levels in the division are consistently below those of the district,
county and England as a whole.
▪ In percentage terms, approximately 3.5% of the working age population of Clare are
claiming out-of-work benefits in January 2021.
8SCHOOLS
SCHOOL INFORMATION
Schools in the Division
Average cohort
size at:
Stage (age 5)
KS2 (age 11)
KS4 (age 16)
KS5 (age 18)
Foundation
Academy
Status
Latest
Latest
Ofsted
Ofsted
Date
Name Phase
Cavendish CofE Primary School Primary LA 13 9 0 0 Good 07/03/2013
Clare Community Primary School Primary AS 24 30 0 0 Good* 13/02/2020
Hundon Community Primary School Primary LA 11 13 0 0 Good 05/03/2020
Thurlow VCP School Primary LA 14 14 0 0 Good 03/05/2013
Wickhambrook Primary Academy Primary AC 25 20 0 0 Outstanding* 29/02/2012
Stour Valley Community School Secondary F 0 0 110 0 Good 11/07/2013
Schools with catchments that overlap with the Division
Average cohort size at:
Stage (age 5)
KS2 (age 11)
KS4 (age 16)
KS5 (age 18)
Foundation
Academy
Status
Latest
Latest
Ofsted
Ofsted
Date
Name Phase
Hartest CofE Primary
Primary AS 10 4 0 0 Good* 01/02/2013
School
Ickworth Park Primary
Primary LA 33 14 0 0 Good 12/11/2010
School
Kedington Primary
Primary AC 29 30 0 0 Good 12/03/2019
Academy
Bury St Edmunds
Secondary AC 0 0 248 126 Inadequate 17/01/2019
County Upper School
Horringer Court Middle
Secondary AC 0 95 0 0 Good 14/02/2013
School
King Edward VI CEVC
Secondary LA 0 0 276 201 Good 06/03/2019
Upper School
Newmarket Academy Secondary AS 0 0 118 21 Good 19/05/2017
Ormiston Sudbury
Secondary AS 0 0 108 40 Good 06/06/2014
Academy
Requires
Samuel Ward Academy Secondary AC 0 0 207 78 07/03/2019
improvement
Academy Status key: AS = Academy Sponsored, AC = Academy Converter, LA = LA
Maintained, F = Free
*The latest full inspection judgement does not relate to the current school
9SCHOOL ATTAINMENT
Foundation Stage Profile (reception)
% pupils achieving Good Level of Development (GLD)
100%
90%
80%
70%
60%
50%
40%
30%
20%
10%
0%
2017 2018 2019
Cavendish CofE Primary School Clare Community Primary School
Hundon Community Primary School Thurlow VCP School
Wickhambrook Primary Academy Suffolk
National
▪ In general, Foundation Stage attainment at schools in Clare has been good over the last
three years of available data.
▪ Pupil attainment at Cavendish Church of England Primary School, Hundon Community
Primary School and Wickhambrook Primary Academy has been consistently above the
county and national average during this period.
▪ Clare Community Primary School has seen steadily improving Foundation Stage
performance from 2017 to 2019. Attainment at the school was above the county and
national benchmarks in the most recent two years.
▪ Pupil attainment at Thurlow VCP School has fluctuated over the last three years. In 2019,
78.6% of pupils achieved a Good Level of Development at the school, compared to 72%
nationally.
10Key Stage 2 (age 11)
% pupils achieving the Expected Level or better in Reading, Writing and Mathematics
90%
80%
70%
60%
50%
40%
30%
20%
10%
0%
2017 2018 2019
Cavendish CofE Primary School Clare Community Primary School
Hundon Community Primary School Thurlow VCP School
Wickhambrook Primary Academy Suffolk
National
▪ Key Stage 2 attainment at schools in Clare division has been variable, with very strong
performance in 2018 but a mixed picture in the preceding and subsequent years.
▪ Cavendish Church of England Primary School stands out as having consistently above
average KS2 attainment.
▪ Pupil attainment at Hundon Community Primary and Thurlow VCP schools was high in
2017 and 2018 before falling below the national average in 2019.
▪ Wickhambrook Primary Academy has seen improving KS2 attainment during this period,
with above average attainment in both 2018 and 2019.
▪ Clare Community Primary School has seen KS2 attainment consistently below the
national average, though in 2018 the school outperformed the county benchmark.
11Key Stage 4 (GCSE) (age 16)
% pupils achieving level 4-9 in English and Mathematics
70%
60%
50%
40%
30%
20%
10%
0%
2017 2018 2019
Stour Valley Community School Suffolk National
▪ GCSE attainment at Stour Valley Community School has been similar to the county and
national average over the last three years.
▪ In 2019, 65% of pupils at the school achieved level 4-9 in English and mathematics, the
same level as across the country as a whole and three percentage points higher than the
Suffolk average.
12NEET % (NOT IN EDUCATION, EMPLOYMENT OR TRAINING)
6%
5%
4%
3%
2%
1%
0%
Clare West Suffolk Suffolk
▪ In January 2021, 2% of 16–18-year-olds in Clare were classified as NEET (where current
activity is known).
▪ NEET levels in Clare are generally consistently lower than the rate for West Suffolk and
Suffolk.
13INDEX OF MULTIPLE DEPRIVATION (IMD) 2019 (SEE MAP
OVERLEAF)
The IMD combines a number of indicators, chosen to cover a range of economic, social and
housing issues, into a single deprivation score for each small area in England. This allows
each area to be ranked relative to one another according to their level of deprivation. Small
areas (Lower Super Output Areas, average population 1,700) are most commonly described
as being in 1 of 5 quintile bands. The bottom quintile represents the 20% of areas that are
the most deprived in England; these are shaded pale yellow on the map. The top quintile
represents the least deprived areas in England and is shaded dark blue.
The Index is widely used to analyse patterns of deprivation, identify areas that would benefit
from special initiatives or programmes and as a tool to determine eligibility for specific
funding streams.
90%
% of population by deprivation quintile of residence
80%
70%
60%
50%
40%
30%
20%
10%
0%
Most deprived 20% Next most deprived Mid 20% Next least deprived Least deprived 20%
20% 20%
Clare West Suffolk England
▪ The IMD 2019 shows that relative deprivation levels in Clare are moderate to low, with
most parts of the division classified in the middle deprivation quintile.
▪ Of the five Lower Super Output Areas in Clare, four are in the mid 20% of areas in
England (home to over 80% of the population of Clare as shown in the chart above), while
one is in the next least deprived quintile.
1415
HEALTH
The local data used here is based on relatively small numbers. The confidence limits provide
an indication of the reliability of the data. The 95% confidence intervals utilised on the chart
provide a range within which there is 95% chance of the true result lying.

LIFE EXPECTANCY AT BIRTH
    92
    90
    88
    86
    84
    82
    80
    78
    76
    74
                    Clare                    West Suffolk                      Suffolk                       England

                            Life expectancy at birth for males        Life expectancy at birth for females

▪        Estimated life expectancy at birth for both males and females in Clare is above the West
         Suffolk, Suffolk and England averages.
▪        The estimated figure for male life expectancy in the division is 84.6 years (80.9 across
         Suffolk), while for females it is more than 2 years longer, at 86.8 years (84.3 is the Suffolk
         average).

DEATHS, UNDER 75 YEARS, STANDARDISED MORTALITY RATIO
    160
    140
    120
    100
     80
     60
     40
     20
      0
             Deaths from all causes,    Deaths from all cancers,      Deaths from circulatory        Deaths from causes
                under 75 years              under 75 years            disease, under 75 years     considered preventable (all
                                                                                                            ages)

                                         Clare    St Edmundsbury        Suffolk     England

▪        The death rate from all causes and cancer for under 75s in Clare is below district, county
         and national averages.
▪        The death rate from circulatory disease for under 75s in the division is also below the
         county and national levels.
▪        The standardised mortality ratio data shown here means that for every 100 early deaths
         from all causes across England as a whole, there are an estimated 64 comparable deaths
         in Clare.
▪        It should be noted that the confidence intervals around these data are particularly wide
         due to the small number of deaths at the local level.

                                                                 16
CRIME & COMMUNITY SAFETY
80
70
60
50
40
30
20
10
0
Clare West Suffolk Suffolk England
Burglary Criminal damage and arson Drugs
Public order Shoplifting Other theft
Vehicle crime Violence and sexual offences Other
▪ Crime rates in Clare are below the district and county levels.
▪ In the year to the end of January 2021, there were 52 recorded crimes per 1,000
residents in Clare compared to 67 in West Suffolk and 66 across the county as a whole.
▪ The most commonly recorded type of crime in the division is violence and sexual offences
which accounted for 58% of all crimes recorded in the division during this period.
▪ Crimes categorised as “other” occur at a higher rate in Clare than across West Suffolk,
Suffolk and England.
ADDITIONAL INFORMATION
Parishes in Division
Brockley Great Wratting Ousden
Cavendish Hargrave Poslingford
Clare Hawkedon Stansfield
Cowlinge Hundon Stoke-by-Clare
Denston Lidgate Stradishall
Depden Little Bradley Wickhambrook
Great Bradley Little Thurlow Withersfield
Great Thurlow Little Wratting Wixoe
17DATA SOURCES
Category Indicator Source
ONS 2019 mid-year population
Quinary population table 2019
estimates
Demographic ONS 2019 mid-year population
Population pyramid 2019
Profile estimates
Ethnicity 2011 ONS 2011 Census
ONS Business Register and
Economy Employment by broad industrial sector 2019 Employment Survey via
NOMIS
Claimant count: The number of people claiming
Jobseeker's Allowance plus those who claim
Labour market DWP via NOMIS
Universal Credit who are out of work (% 16-64
population) January 2018- February 2021
School information and attainment 2017-2019 Suffolk County Council
Education % 16-18-year-olds NEET (Not in Employment, Suffolk County Council via the
Education or Training) 2017-2021 Suffolk Observatory
Ministry for Housing,
Deprivation Index of Multiple Deprivation 2019 Communities and Local
Government
Health Life expectancy at birth 2013-2017 Public Health England
Standardised mortality ratio for deaths from all
causes, cancer and circulatory disease, (aged
under 75), and death from causes considered
Health preventable (all ages), 2013-2017. The Public Health England
standardised mortality ratio is the ratio of
observed deaths in the study group to expected
deaths in the general population.
Community Recorded crime rate per 1,000 resident Data.police.uk via the Suffolk
Safety population February 2020 to January 2021 Observatory
For more data and information about Clare Electoral Division, see the Suffolk
Observatory www.suffolkobservatory.info
1819
You can also read