Competition Commission Data Inquiry Hearing - MTN South Africa 18 October 2018
←
→
Page content transcription
If your browser does not render page correctly, please read the page content below
Competition Commission
Data Inquiry Hearing
MTN South Africa
18 October 2018
Who we are
• Proudly South African, born at the dawn of democracy

• 24 countries, 230 million customers (30 million in SA) – Global Head office in JHB

• Africa’s Largest telecom company by customers and revenue. Africa’s most valuable Brand

• 43.6bn in capex in SA (last 4 years)

• Listed on the JSE, Level 4 B-BBEE (36.34% black owned and 13.42% black woman owned)

• R11.7bn spent with 51% BO Entities, R22.5bn spent with 30% BWO entities (Over 4 Years)

• R3.3bn spent with SMME’s (Over 3 Years)
Who we are
• Direct Tax Contributions > ZAR 4.9 billion, indirect Tax Contributions > ZAR 6.2 billion (Over 3 years)

• Approximately 5000 direct employees, and in excess of 20 000 people indirectly employed

• MTN Foundation – R728 million spend (Last 11 years)

• “Yes Campaign” – MTN to employ 1,000 youth over next 12 months

• MTN population coverage 2G (99%); 3G (99%) and 4G (90%) by end of 2018 – Today, more than
  12 million people are covered by 4G, compared to October 2017

• MTN has more than 18,000km of Fibre in South Africa

• MTN has consistently dropped the effective rate of data Year on Year (27% down in H1)
The Commission’s questions
The Commission has requested comments on four questions:

1.
01     Are data prices higher than they ought to be?

02
2.     If they are, what are the factors that cause prices to be higher than they ought to be?

03
3.     How should these factors be remedied?

4.
04     What is the impact of data prices and access to data more broadly on lower-income customers, rural customers,
       small businesses and the unemployed? How important are affordable data prices for these customers?
1. Are data prices higher than
   they ought to be?
1. Are data prices higher than they ought to be?
MTN believes that data prices are competitive, within the current conditions of the South African market

Comparator Framework (1/2)
             Perception                          Reality                            Conclusion             Easily available hard
                                                                                                           data can be used to fact
1. Current data prices prevent    South Africa’s ICT and               South Africa remains an African     check perceptions vs.
                                                                                                           reality.
   South Africa from being an     broadband performance is             leader in ICT and broadband
   African ICT and broadband      measured and globally                outcomes
   leader                         benchmarked annually
                                  South Africa is a performance
                                  leader amongst SADC members
                                  and across the African continent.
                                  (See slide 9)
2.Current data prices make data South African data and device          South Africa is an African leader
  unaffordable to many South      affordability is globally            for data and device affordability
  Africans, especially lower      benchmarked annually, with           based on average income
  income and rural South Africans South Africa scoring as an African   affordability, but is hampered by
                                  leader                               extreme income inequality.
1. Are data prices higher than they ought to be?
MTN believes that data prices are competitive, within the current conditions of the South African market

Comparator Framework (2/2)
              Perception                           Reality                       Conclusion             Easily available hard
                                                                                                        data can be used to fact
 3. Current data prices are not       Stats SA CPI data shows         Consumer Price Index data does    check perceptions vs.
 coming down drive cost of living     communication costs             not recognise communication       reality.
 pressures for poor and rural South   represent a minimal (60%)
                                      of rural / poorer household
                                      spend
 4. Current data prices result in a   South African internet access Although an access gap exists
 “digital divide” preventing many     gender gap and mobile phone with 48% of households lacking
 people, and especially women,        access gender gap is globally internet access, South Africa is
 from accessing the internet          benchmarked annually.           an African leader in household
                                                                      access and gender access to
                                                                      the internet
What drives Data adoption in a country? – It is more than just affordability
  MTN believes that data prices are competitive, within the current conditions of the South African market

                                               How global ICT Indices measure overall ICT & broadband performance
  Global ICT indices are designed to help                               Facebook / The Economist          GSMA Mobile Connectivity
                                               UN / ITU
  policymakers and stakeholders to                                      Inclusive Internet Index: Score   Index:
                                               ICT Development Index:
  measure a country’s internet                                          / 100 comprised of 54             Score / 100 comprised of 39
  connectivity and inclusivity progress over                            indicators across four            indicators across four
  time                                                                  categories                        categories
  They also provide a simple way of
  benchmarking progress internationally
                                                  ICT Access [40%]         availability [25%]              infrastructure [25%]

                                                                          affordability [25%]               affordability [25%]

                                                    ICT Use [40%]
                                                                           relevance [25%]                   consumer [25%]

                                                   ICT Skills [20%]         readiness [25%]                    content [25%]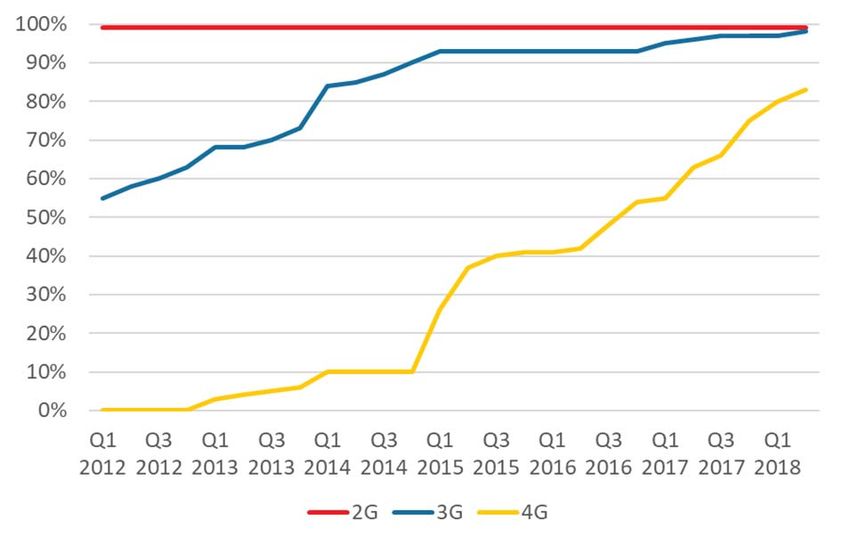
South Africa remains an African leader in ICT and
broadband outcomes
South Africa remains the African leader in ICT and broadband outcomes – once the non-comparable
                      small islands of Mauritius and the Seychelles are excluded.

           Hard data sets for evidence based test              SADC ranking                    All-Africa ranking                 BRICS ranking
ICT Development Index                                            #3 / 15                          #3 / 44                           #4 / 5
                                                    (Mauritius and the Seychelles #1 (Mauritius and the Seychelles #1   (Russia, Brazil, and China #1,
Updated November 2017                                    and #2 respectively)             and #2 respectively)            #2 and #3 respectively)

SA Score: 4.96
Inclusive Internet Index                                        #1/9                              #1 / 24                           #4 / 5
Updated February 2018                                                                                                   (Russia, Brazil, and China #1,
                                                                                                                          #2 and #3 respectively)
SA Score: 73.9 / 100

Mobile Connectivity Index                                      #2 / 14                           #3 / 45                           #4 / 5
                                                             (Mauritius #1)           (Morocco and Tunisia #1 and       (China, Russia and Brazil #1,
Updated September 2018                                                                      #2 respectively)              #2 and #3 respectively)

SA Score: 59.9 / 100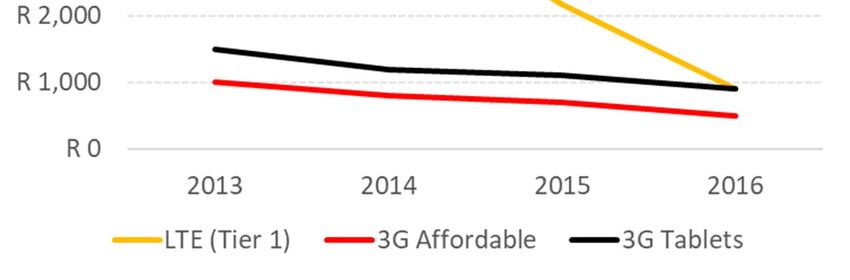
Are people spending all their money on data? NO!
                                Communication is a minor (
A household gap exists, but SA is an African leader in
closing digital divide
Hard data sets for evidence based test SADC ranking All-Africa ranking BRICS ranking 48% of South African
households lack access to
Inclusive Internet Index the internet, indicating a
significant ’digital divide’
Updated February 2018 access gap issue.
However, South Africa
Closing the Access Gap #1 / 9 #2 / 24 #3 / 5 remains a household
internet access leader in
Internet Users % Households (Morocco #1) (Russia and China ranked #1 and #2 Africa. South Africa is also
respectively) an African leader in
closing the internet
SA Score: 52% access gender gap.
Closing the Internet Gender Gap #2 / 9 #2 / 24 #3 / 5
% gap male / female access to the (Namibia #1) (Namibia #1) (Brazil and Russia ranked #1 and #2
internet respectively)
SA Score: 2.1%
Closing the Mobile Phone Gender Gap #3 / 9 #3 / 24 #3 / 5
% gap male / female access to mobile (Botswana and Namibia #1 and #2 (Botswana and Namibia #1 and #2 (Brazil and Russia ranked #1 and #2
phones respectively) respectively) respectively)
- SA Score: 0.0%
Source: Facebook / The Economist Inclusive Internet IndexAt MTN, we have identified 6 focus areas to ensure that all
South Africans enjoy the internet
C H A S E R
COVERAGE HANDSETS AFFORDABILITY SERVICE EDUCATION RIGHT SIM
BUNDLING RIGHT SETTING
•Aim is to improve •Aim is to remedy •Aim is to improve •Aim is to simplify •Aim to introduce •Aim to drive data
MTN LTE coverage the limited the affordability of and expand data education usage through
from 88% to 90% affordability and data services. service bundle for customers in USIM penetration,
by end 2018. access to 3G and offerings to cater informal markets and ensure 4G
4G devices. for customer to increase data device holders
segmentation literacy and have the right 4G
needs E.g. usage. settings
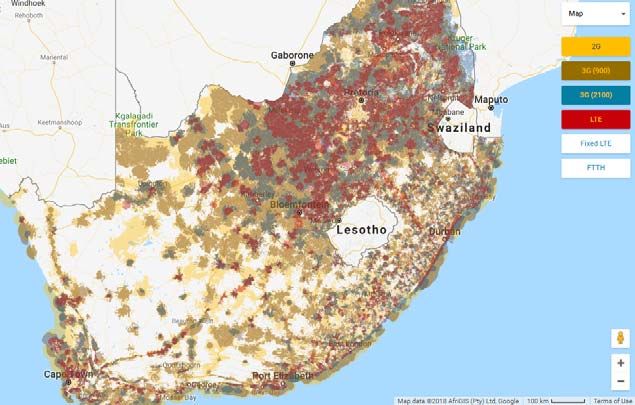
YouTube Bundles.CHASER Coverage MTN has invested R43,6Bil in expanding coverage to virtually the whole population in the last 4 years. • 4G rollout (0-90% coverage in 6 years) has been even faster than 3G rollout (0-90% in 10 years), which itself was faster than the initial 2G rollout. • 4G coverage reached 88% in August 2018. • MTN has refarmed existing spectrum for 3G and LTE deployment. • This is what infrastructure competition delivers Source: MTN, https://mybroadband.co.za/news/cellular/265403-mtn-boosts-lte-coverage-and-download-speeds.html
CHASER
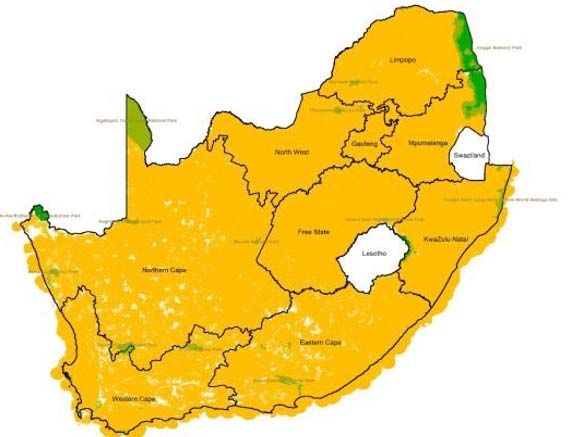
Network Investment – More sites in rural areas than in Metro
Rural areas account for the
largest share of total sites.
MTN continues to aggressively
add new sites in rural areas,
having added 2,716 sites, 858 of
which were LTE enabled, in the
past 2.5 years alone.
Major MetroCHASER Network quality P3 – Best Network in South Africa. Best Network in Africa Extensive investment in LTE has resulted in significant increase in LTE user experience. P3 has tested more than 180 networks in 65 countries with same methodology, MTN SA has proven to be the best Network in Africa
CHASER
Handset pricing – Most affordable Smartphone @R399
   Handset pricing for consumers (MTN South Africa, nominal, 2013-2016)

     Over a Billion Rand in Handset subsidies per year
CHASER
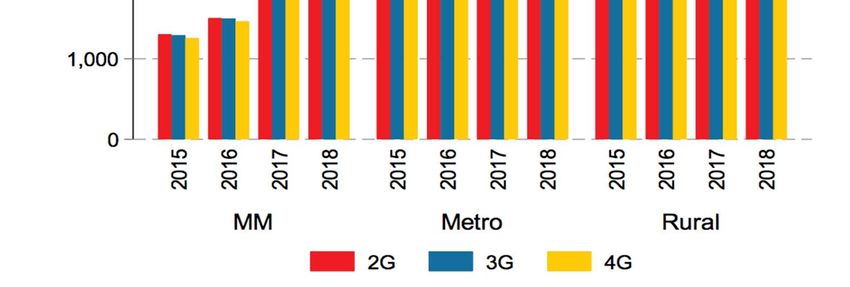
Data pricing – Effective Rate has fallen by 87%.
Data prices have drastically reduced from 20112. What are the factors that affect data
pricing?The Commission’s Questions
The Commission has requested comments on Four questions
The Commission has requested comments on Four questions
What are the factors that affect data pricing?
How should these factors be remedied?
MTN believes that the factors that affect data pricing include
Spectrum Constraints Exchange Rate Volatility
Cost Factors Regulation
The adoption of the MTN CHASER Model seeks to address these factors and enable further digital and social inclusion
C H A S E R
COVERAGE HANDSETS AFFORDABILITY SERVICE EDUCATION RIGHT SIM RIGHT SETTING
BUNDLINGCost factors
Cost Drivers, which affect the Price to Consumers
Electricity The South African
economy slipped into
recession during the
Labour second quarter of 2018,
shrinking by 0,7% quarter-
on-quarter (seasonally
Access to Internet Exchange Points adjusted and annualised).
Capital & Infrastructure Costs This followed a revised
2,6% contraction in the
first quarter of 2018, which
affects revenues and
Costs of Imported Components potential growth in
subscribers
Theft and Vandalism
Tax Regime on Smartphone HandsetsPrices would be lower if we were not spectrum constrained
Average spectrum per operator 2016
South African MNOs
operate with some of the
lowest spectrum
allocations in the world.
Inefficient infrastructure
investment has had to
compensate for this
massive disadvantage.Cost factors – Exchange Rate Volatility
USD/ZAR exchange rate 2008 to October 2018
iPhone, Then and Now
2007: R6.50/$
2018: R15.00/$
2007 $499 2018 $1,099 X2.2
2007 R3,243 2018 R16,485 X5.1
• The majority of MTN’s network infrastructure, licenses and handsets are priced in USD.
• Approximately 40% of MTNs Capex Budget was eroded due to currency volatility in 2017.
Source: https://www.resbank.co.za/Pages/default.aspxCost Factors - Fuel
Price of 95 ULP, July 2014 to October 2018
Volatile yet generally
rising costs affect
costs to serve.Cost Factors – Fuel and Electricity (2)
CPI electricity and fuel (Index Dec 2016 = 100), 2008 to 2018
Electricity prices, and
Load Shedding resulted in
an average increase of
33% in power and fuel.Cost Factors – CPI
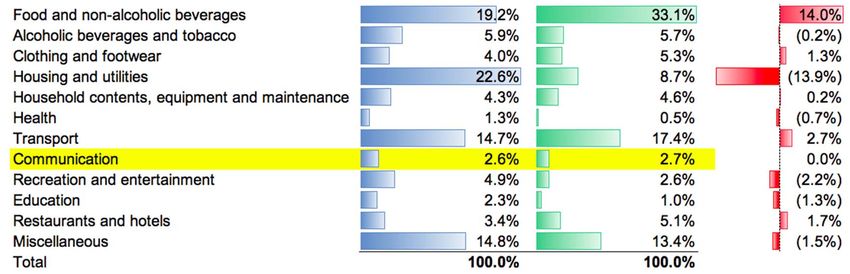
CPI all items (Index Dec 2016 = 100), 2008 to 2018
Rising CPI restricts access
to credit, hampers sales,
and has resulted in
substantial increases in
operating expenses
including Site rentals, Staff
costs, Cost of Sales and
Insurance.
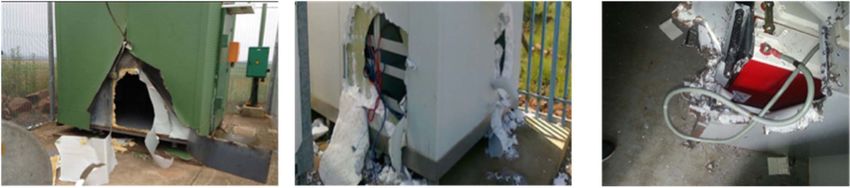
Source: StasSACost Factors – Theft and Vandalism
We lose over R100mil per year due to theft and Vandalism3. What is the impact of data pricing to the poor?
MTN Data strategy has resulted in…

High population penetration – almost 20million data users

Traffic increased by 60% YoY

90% 4G Population coverage

99% 3G Population coverage

More than 5million Smart devices sold per year
Conclusion

Critical to deliver the 4th   • Do not over-regulate
  industrial revolution       • License spectrum now – 4G and 5G
                              • The world of Technology will not wait for us

                              • Effective rates are falling fast (at double digits rates each year)
The state of competition      • Broadband population coverage is scaling up – Universal access
                              • Consumer choice – simple and extensive variety of offerings

                              • Efficient spectrum allocation – 4G and 5G
                              • WOAN – equitable implementation, preserve the incentive to
    What should the             compete
     regulators do            • Implement rapid deployment – site acquisition
                              • Don’t do open access at cost – preserve the incentives to invest
You can also read