COVID-19 Weekly Report - State of Oregon
←
→
Page content transcription
If your browser does not render page correctly, please read the page content below
COVID-19 Weekly Report
Oregon’s Weekly Surveillance Summary
Novel Coronavirus (COVID-19)

 Oregon Public Health Division                                            Published December 16, 2020

       Background
       COVID-19 Weekly Report data will be finalized every Sunday at 11 p.m. PDT, and the report
       will be published on Wednesday. Please note that the data reported here are continually
       being updated. For daily up-to-date information, visit the OHA COVID-19 web page:
       https://govstatus.egov.com/OR-OHA-COVID-19.

       As of 11 p.m. Sunday, December 13, there have been 95,010 cases of COVID-19 reported to
       the Oregon Health Authority. Of these, 4,058 (4.3%) are “presumptive” cases—i.e., people
       with COVID-19-like symptoms and close contact with a confirmed case, but who did not have
       a confirmatory laboratory test. Though not confirmed, presumptive cases are highly likely to
       have COVID-19, given their specific symptoms and known exposure. Presumptive cases are
       encouraged to seek testing to confirm that they do have COVID-19. Presumptive cases who
       test positive are recategorized as confirmed cases.

       These data represent a snapshot of COVID-19 risk factors and clinical and demographic
       characteristics of cases, and they include data on cases with pending investigations. Not all
       cases have been interviewed at the time of this report. The data shown in this report come
       from Oregon’s electronic disease surveillance system for reportable diseases.

       During the week of December 6–December 12* 149,243 tests for COVID-19 were performed
       on Oregonians; of these, 7.4% had a positive result.† This figure represents a “test-based”
       method, whereby all electronic lab reports received by OHA are used to calculate percent
       positivity.§ Detailed tables of the number of tests and percent positivity can be found online at
       https://public.tableau.com/profile/oregon.health.authority.covid.19#!/vizhome/OregonHealthAu
       thorityCOVID-19DataDashboard/COVID-
       19EPICases?:display_count=y&:toolbar=n&:origin=viz_share_link&:showShareOptions=false

       Weekly Report Summary
       During Monday, December 7 through Sunday, December 13, OHA recorded 9,222 new cases
       of COVID-19 infection—an 11% drop from last week’s tally. This drop was in the context of a
       13% decrease in testing and the proportion of tests that were positive falling from 8.1% to
       7.4%. Four hundred ninety-one Oregonians were hospitalized with COVID-19 during the
       week, compared to 494 the previous week. One hundred sixteen Oregonians died in

       * This date range aligns with CDC’s “MMWR week.”
       † Does not include antibody (serology) tests.
       § www.cdc.gov/coronavirus/2019-ncov/lab/resources/calculating-percent-positivity.html

       Data are provisional and subject to change.                                   Page 1 of 16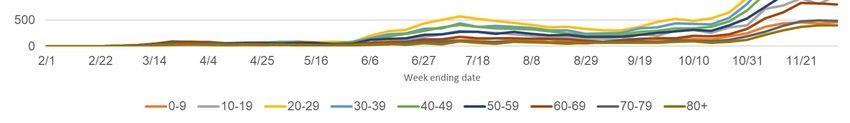
COVID-19 Weekly Report
Oregon’s Weekly Surveillance Summary
Novel Coronavirus (COVID-19)

 Oregon Public Health Division                                          Published December 16, 2020

       association with COVID-19—down from 133 the previous week. In all, 1,161 of the 95,010
       cases reported to date in Oregon have died in association with COVID-19; the case-fatality
       rate has held steady at 1.2% for several weeks. Recent data on mortality in Oregon, including
       deaths related to COVID-19, are available at
       https://public.tableau.com/profile/oha.center.for.health.statistics.

       Persons of Hispanic ethnicity have been disproportionately affected by COVID-19: they
       account for 13% of Oregon’s population but 38% of cases of known ethnicity reported to date.
       By age, the incidence of reported infection has been highest in persons 20–49 years of age,
       who make up 39% of Oregon’s population but 55% of reported cases. Persons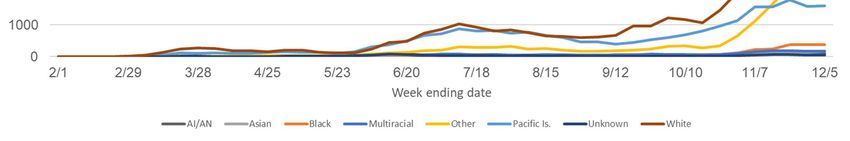
COVID-19 Weekly Report
Oregon’s Weekly Surveillance Summary
Novel Coronavirus (COVID-19)

 Oregon Public Health Division                       Published December 16, 2020

       Data are provisional and subject to change.            Page 3 of 16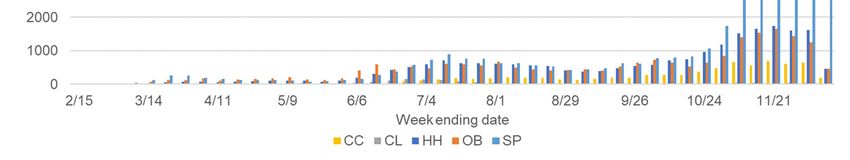
COVID-19 Weekly Report
Oregon’s Weekly Surveillance Summary
Novel Coronavirus (COVID-19)

 Oregon Public Health Division                                         Published December 16, 2020

       Epidemiologic link designations
       Sporadic: Cases who do not have known exposure to another case or outbreak.
       Outbreak: Cases who have a shared, defined exposure with at least one other case. For
       example, a defined exposure could be an event, a workplace, a congregate facility, etc.
       Cluster: Cases who had contact with another case, but the exposure is not well defined. For
       example, cases from two households who interacted many times prior to illness onset.
       Household: Cases who were exposed to another case in their household.
       Close contact: Cases who were exposed to another case, not in their household. This
       designation was added on 7/15.

       Due to the lag between case reporting and case investigation, the proportion of cases
       categorized as sporadic is high in the most recent week or more; some of these cases will be
       recategorized after investigation is completed.

       Data are provisional and subject to change.                               Page 4 of 16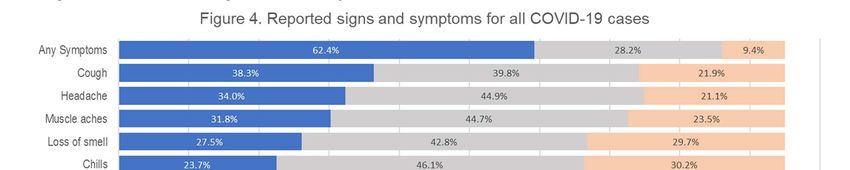
COVID-19 Weekly Report
Oregon’s Weekly Surveillance Summary
Novel Coronavirus (COVID-19)

 Oregon Public Health Division                                              Published December 16, 2020

       *Congregate living situations include, but are not limited to, long-term care facilities, group

       Data are provisional and subject to change.                                    Page 5 of 16
COVID-19 Weekly Report
Oregon’s Weekly Surveillance Summary
Novel Coronavirus (COVID-19)
Oregon Public Health Division Published December 16, 2020
homes, prisons, and shelters. Data include people with confirmed cases who live or work in
congregate living situations.
**Direct patient care is only asked if a case is a healthcare worker or volunteer. The
denominator is the number of healthcare workers or volunteers.
***Underlying medical conditions include cardiovascular disease, chronic liver disease, chronic
lung disease, chronic renal disease, current or former smoker, diabetes mellitus,
immunocompromised condition, neurologic and neurodevelopmental conditions, obesity, or
other chronic diseases.
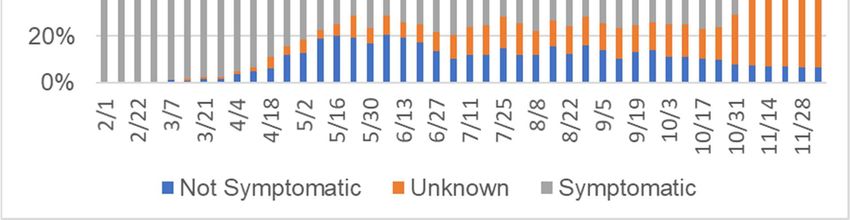
The following tables show the demographic characteristics for all COVID-19 cases. Tables 1
and 2 show case counts and severity by demographic categories. Figures 7 and 8 show the
case demographic distribution by week of onset. Tables 3 and 4 show race and ethnicity,
respectively. Figures 9 and 10 show race and ethnicity by week of onset, respectively.
Table 1. Severity and rates of COVID-19 by sex
Sex Cases % of total cases Cases per 100,000a Hospitalized % Hospitalized Deaths Case fatality
Female 48,979 51.6 2,277 2,578 5.3 523 1.1
Male 45,309 47.7 2,172 2,900 6.4 636 1.4
Non-Binary 6 0.0 0 0.0 0 0.0
Unknown 716 0.8 25 3.5 2 0.3
Total 95,010 100.0 2,243 5,503 5.8 1,161 1.2
a Populationdata were compiled from the 2019 Annual Oregon Population Report, which is produced by the
Population Research Center, Portland State University
Table 2. Severity and rates of COVID-19 by age group
Data are provisional and subject to change. Page 6 of 16
COVID-19 Weekly Report
Oregon’s Weekly Surveillance Summary
Novel Coronavirus (COVID-19)

 Oregon Public Health Division                                                     Published December 16, 2020

                               % of total
    Age group       Cases                     Cases per 100,000a    Hospitalized      % Hospitalized    Deaths    Case fatality
                                cases
  0-9              5,017         5.3                1,045              59               1.2           0              0.0
  10-19            9,668        10.2                1,946              80               0.8           0              0.0
  20-29           20,223        21.3                3,642             344               1.7           2              0.0
  30-39           16,844        17.7                2,910             427               2.5           11             0.1
  40-49           14,870        15.7                2,737             583               3.9           22             0.1
  50-59           12,084        12.7                2,258             807               6.7           72             0.6
  60-69            7,856         8.3                1,456            1,035             13.2          171             2.2
  70-79            4,647         4.9                1,366            1,094             23.5          287             6.2
  80+              3,588         3.8                2,140            1,048             29.2          596             16.6
  Not
                    213           0.2                                  26              12.2           0               0.0
  available
  Total           95,010        100.0               2,243            5,503              5.8         1,161             1.2
       aPopulation data were compiled from the 2019 Annual Oregon Population Report, which is produced by the

       Population Research Center, Portland State University

        Table 3. Severity and rates of COVID-19 by racea
                                                      Cases per                              %                        Case
 Race                  Cases     % of total cases                      Hospitalized                      Deaths
                                                      100,000b                           Hospitalized                fatality
 > 1 race              1,615           1.7              804                98               6.1            29          1.8
 American
 Indian/Alaska         1,891           2.0              3,880              148               7.8           19          1.0
 Native
 Asian                3,114           3.3               1,719             201                6.5          30           1.0
 Black                2,478           2.6               3,069             187                7.5          30           1.2
 Other                16,726          17.6                                440                2.6          150          0.9
 Pacific Islander     24,554          25.8             18,617            1,079               4.4          112          0.5
 Unknown              1,004           1.1               6,044             108               10.8          13           1.3
        Data are provisional and subject to change.                                                Page 7 of 16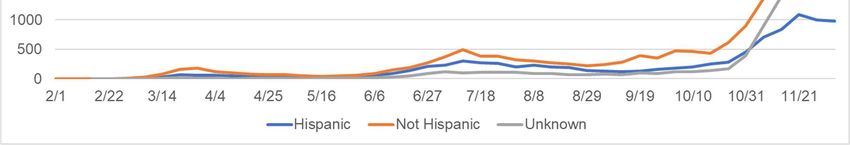
COVID-19 Weekly Report
Oregon’s Weekly Surveillance Summary
Novel Coronavirus (COVID-19)

 Oregon Public Health Division                                                                Published December 16, 2020

 White                   43,628           45.9                  1,220               3,242              7.4           778           1.8
 Total                   95,010           100.0                 2,243               5,503              5.8          1,161          1.2
      aDuring the case investigation, people are asked to self-report their race, ethnicity, tribal affiliation, country of origin, or
      ancestry.
      bNational Center for Health Statistics (NCHS). Estimates of the resident population of the U.S. by year, county, age,

      bridged race, Hispanic origin, and sex (Vintage 2018). 2) Census Bureau Population Estimates: U.S. Census bureau,
      Population Division, Annual Estimates of the Resident Population by Age, Sex, Race, and Hispanic Origin for counties
      (Vintage 2018)
      c15,505 (96.8%) of the 16,014 persons who identify as “Other” race also self-identify as Hispanic or Latino.

         Table 4. Severity and rates of COVID-19 by ethnicity
                                                            Cases per
  Ethnicity          Case count     % of total cases                           Hospitalized     % Hospitalized      Deaths     Case fatality
                                                            100,000a
  Hispanic            28,248               30                5,195                1,252               4.4             136           0.5
  Not
                      45,730               48                 1,238               3,375               7.4             761           1.7
  Hispanic
  Unknown             21,032              22                                       876                4.2            264            1.3
  Total               95,010              100                 2,243               5,503               5.8           1,161           1.2
         aNational Center for Health Statistics (NCHS). Estimates of the resident population of the US by year, county, age,
         bridged race, Hispanic origin, and sex (Vintage 2018). 2) Census Bureau Population Estimates: U.S. Census
         bureau, Population Division, Annual Estimates of the Resident Population by Age, Sex, Race, and Hispanic Origin
         for counties (Vintage 2018)

         Data are provisional and subject to change.                                                         Page 8 of 16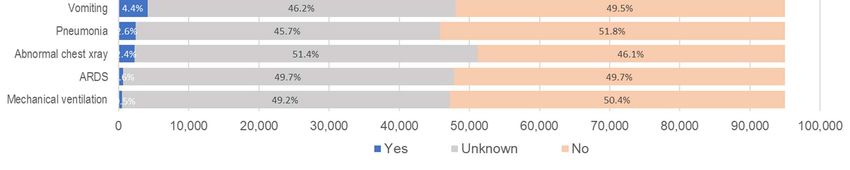
COVID-19 Weekly Report
Oregon’s Weekly Surveillance Summary
Novel Coronavirus (COVID-19)

 Oregon Public Health Division                                          Published December 16, 2020

       Follow-up
       Figure 11 shows the percentage of cases that were called within 24 hours of being reported to
       public health by race. Figure 12 shows the percentage of cases that were called within 24
       hours of being reported to public health by ethnicity. Figure 13 shows the percentage of cases
       that were interviewed, by race. Figure 14 shows the percentage of cases that were
       interviewed, by ethnicity.

       Data are provisional and subject to change.                                Page 9 of 16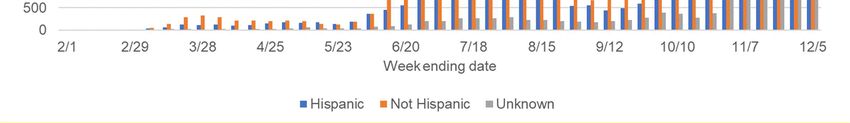
COVID-19 Weekly Report
Oregon’s Weekly Surveillance Summary
Novel Coronavirus (COVID-19)

 Oregon Public Health Division                                                        Published December 16, 2020

       a Race  and ethnicity data are collected when cases are interviewed. Race and ethnicity data for cases that were
       not interviewed are abstracted from laboratory reports and medical records if it is available.
       b The orange line represents the state metric for timely follow up for all cases: 95%.

       Data are provisional and subject to change.                                               Page 10 of 16
COVID-19 Weekly Report
Oregon’s Weekly Surveillance Summary
Novel Coronavirus (COVID-19)
Oregon Public Health Division Published December 16, 2020
a Race and ethnicity data are collected when cases are interviewed. Race and ethnicity data for cases that were
not interviewed are abstracted from laboratory reports and medical records if it is available.
b The orange line represents the state metric for timely follow up for all cases: 95%.
Data are provisional and subject to change. Page 11 of 16COVID-19 Weekly Report
Oregon’s Weekly Surveillance Summary
Novel Coronavirus (COVID-19)
Oregon Public Health Division Published December 16, 2020
a Race and ethnicity data are collected when cases are interviewed. Race and ethnicity data for cases that were
not interviewed are abstracted from laboratory reports and medical records if it is available.
a Race and ethnicity data are collected when cases are interviewed. Race and ethnicity data for cases that were
not interviewed are abstracted from laboratory reports and medical records if it is available.
Recovery
OHA staff periodically call people with reported COVID-19 who experienced fever, cough,
shortness of breath or diarrhea and were initially interviewed before May 1, when OHA
changed its definition of recovery, to inquire about resolution of symptoms. This group
includes 1,884 people who were all diagnosed before mid-April and have not succumbed to
their illness. Among these, 1,682 (88.8%) are considered to have recovered, and a recovery
date is available for 1,387 people; their time to recovery is depicted in Figure 15. Of these
1,884 people, 16 (0.8%), have not yet recovered; and recovery status is not available for 186
(9.8%). People are assumed to have recovered three days after resolution of all symptoms.
The median time to recovery among non-hospitalized symptomatic cases is 20 days
(interquartile range: 15–29 days); among symptomatic cases who were hospitalized it is 26
days (interquartile range: 18–37 days).
Data are provisional and subject to change. Page 12 of 16COVID-19 Weekly Report
Oregon’s Weekly Surveillance Summary
Novel Coronavirus (COVID-19)
Oregon Public Health Division Published December 16, 2020
*Three days after reported resolution of diarrhea, cough, shortness of breath and fever.
** Includes cases who were interviewed about their date of recovery before a change in recovery definition on May
*** This was last updated on 9/16; Data will be updated again as new information is available.
People with Intellectual and Developmental Disabilities
OHA is aware of 219 people with intellectual or developmental disabilities who have had
COVID-19 to date. This includes individuals who live in congregate settings and in family or
individual homes. To date, there are 5 deaths associated with people with intellectual or
developmental disabilities. This number is from conducting a match between the ODHS Office
of Developmental Disabilities Services client list and the Oregon COVID-19 case database.
OHA will update this number on a quarterly basis.
Additional information about the ODDS program and COVID-19 can be found here:
https://www.oregon.gov/dhs/SENIORS-
DISABILITIES/DD/ODDS%20Resource%20Library/ODDS-Residential-COVID-
19-Report.pdf
ODDS data is based on self-reports from providers and case management entities and
therefore may differ from testing data received from the Oregon Health Authority.
Weekly COVID-19 Hospitalizations
OHA is publishing data on the number of COVID-19 hospitalizations by hospital in the prior
week; data are from HOSCAP. Table 5 lists all hospitals which, at some time during the week
reported, had 10 or more suspected/confirmed COVID-19 patients. The left column shows the
Data are provisional and subject to change. Page 13 of 16COVID-19 Weekly Report
Oregon’s Weekly Surveillance Summary
Novel Coronavirus (COVID-19)
Oregon Public Health Division Published December 16, 2020
highest number of suspected and confirmed COVID-19 hospitalized patients for each hospital
between 12/07/2020 and 12/13/2020. The right column shows the highest number of
confirmed COVID-19 patients hospitalized during the same time period.
Table 5. Hospitals reporting 10 or more COVID-19 patients.
Maximum Patients Maximum Patients
Hospital
(Suspected and confirmed) (Confirmed only)
Salem Health Hospital 84 79
Providence Portland Medical Center 61 59
St. Charles Bend 49 49
Providence St. Vincent Medical 47 45
Center
Asante Rogue Regional Medical 42 27
Center
PeaceHealth Sacred Heart MC at 29 29
Riverbend
Legacy Mount Hood Medical Center 29 24
OHSU Hospital 29 22
Kaiser Permanente Sunnyside 27 27
Medical Center
Legacy Emanuel Medical Center 25 24
Kaiser Permanente Westside Medical 23 24
Center
Hillsboro Medical Center 21 17
McKenzie-Willamette Medical Center 20 20
Legacy Meridian Park Hospital 20 15
Mercy Medical Center 19 19
Sky Lakes Medical Center 19 19
Legacy Good Samaritan Medical 19 12
Center
Adventist Health Portland 18 17
Providence Medford Medical Center 17 12
Asante Three Rivers Medical Center 16 16
Good Samaritan Regional Medical 16 11
Center
VA Portland Health Care System 15 15
Asante Ashland Community Hospital 15 14
Data are provisional and subject to change. Page 14 of 16COVID-19 Weekly Report
Oregon’s Weekly Surveillance Summary
Novel Coronavirus (COVID-19)
Oregon Public Health Division Published December 16, 2020
The hospitals listed in Table 6 reported 1–9 suspected or confirmed COVID-19 patients
12/07/2020 and 12/13/2020. Hospitals not listed in either table did not report any suspected or
confirmed patients during the week.
Table 6. Hospitals reporting 1–9 COVID-19 patients.
Hospital
Adventist Health Tillamook
Bay Area Hospital
Columbia Memorial Hospital
Curry General Hospital
Good Shepherd Health Care System
Grande Ronde Hospital
Lake District Hospital
Legacy Silverton Medical Center
Mid-Columbia Medical Center
OHSU Doernbecher Children's Hospital
Providence Hood River Memorial
Hospital
Providence Milwaukie Hospital
Providence Newberg Medical Center
Providence Willamette Falls Medical
Center
Randall Children's Hospital at Legacy
Emanuel
Samaritan Albany General Hospital
Samaritan Lebanon Community Hospital
Samaritan North Lincoln Hospital
Samaritan Pacific Communities Hospital
Santiam Hospital
St. Alphonsus Medical Center - Ontario
St. Anthony Hospital
St. Charles Redmond
Willamette Valley Medical Center
Cases by ZIP Code
OHA is publishing data on cases at the ZIP code level, available online at:
Data are provisional and subject to change. Page 15 of 16COVID-19 Weekly Report
Oregon’s Weekly Surveillance Summary
Novel Coronavirus (COVID-19)
Oregon Public Health Division Published December 16, 2020
https://public.tableau.com/profile/oregon.health.authority.covid.19#!/vizhome/OregonCOVID-
19CasesbyZIPCode/OregonsCOVID-19CasesbyZipCode?publish=yes
Summary table of all zip codes available here:
https://public.tableau.com/profile/oregon.health.authority.covid.19#!/vizhome/OregonCOVID-
19CasesbyZIPCode-SummaryTable/CasesbyZIPCodeSummaryTable?publish=yes
Document accessibility: For individuals with disabilities or individuals who speak a language other than English,
OHA can provide information in alternate formats such as translations, large print, or braille. Contact the Health
Information Center at 1-971-673-2411, 711 TTY or COVID19.LanguageAccess@dhsoha.state.or.us.
Data are provisional and subject to change. Page 16 of 16You can also read