Unified Ceilometer Network
←
→
Page content transcription
If your browser does not render page correctly, please read the page content below
Unified Ceilometer Network
Ruben Delgado1,2, V. Caicedo1, K. Taguba1, D. Taylor1, P. Maniktala1,
A. Rathod1, B. B. Demoz1,2, R. K. Sakai3, F. Moshary2,4, E.J. Welton5,
 B. L. Lefer6,M. Woodman7, D. Krask7, J. Szykman8, K. Cavender8
                  1University of Maryland, Baltimore County
   2NOAA Center for Earth System Sciences and Remote Sensing Technologies

                 3Howard University, 4City College of New York

          5NASA Goddard Space Flight Center, 6NASA Headquarters

                  7Maryland Department of the Environment

                    8U.S. Environmental Protection Agency

        2020 MARAMA Air Monitoring Training Committee Workshop
                        December 8-10, 2020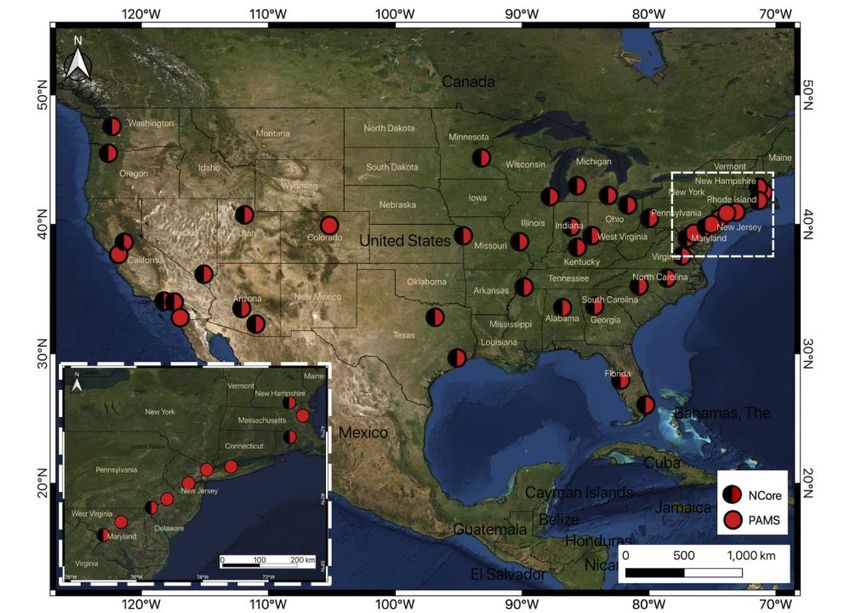
US EPA PAMS Mixing Layer Height

•   State and local air quality agencies to measure
    hourly MLH at the national PAMS, as is set forth                     EPA PAMS/NCORE Current and Future Sites
    in 40 CFR Part 58 driven by the state’s State
    Implementation Plan (SIP) modeling data needs.

•   MLH requirement not limited to a particular
    technology (i.e. ceilometers, lidars, Doppler wind
    lidars and radar wind profilers).

•   Need to develop a common MLH algorithm that
    can be implemented across a heterogeneous
    network.

•   Develop centralized standardization of data
    outputs and retrievals.

                                          EPAMS Profiler and Ceilometer Network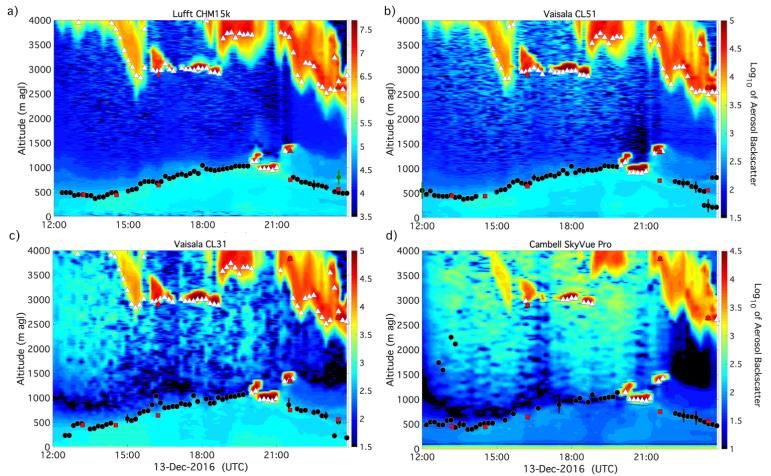
2019 MARAMA Workshop                      2020 MARAMA Workshop

     EPAMS Network Testbed                    Unified Ceilometer Network

Testbed: 6 ceilometer sites in MD and NY   Network: 28 sites across US and Canada
Unified Ceilometer Network (UCN)

•   The UCN began with evaluation studies (Ad-Hoc Ceilometer Evaluation Study) and prototype
    networks (EPAMS Network Testbed) since December 2016.

•   Collaboration between UMBC, U.S. EPA, NASA (synergy with MPLNET) and NOAA on a ground-
    based ceilometer network to support of redesigned PAMS network. UCN: unique
    State/Federal/International/Academic collaboration allows for extensive observational coverage
    of the PBL in North America.

•   The UCN network will host, process, display, and distribute ceilometer data and products in near-
    real time. Ceilometer aerosol backscatter profiles are used to determine the PBL height with
    continuous 10-minute temporal resolution (Caicedo et al. 2020).

•   Mixing layer aerosol layer, and cloud base heights will be released online in the Spring 2021.
                     Caicedo et al. (2020) https://doi.org/10.1175/JTECH-D-20-0050.1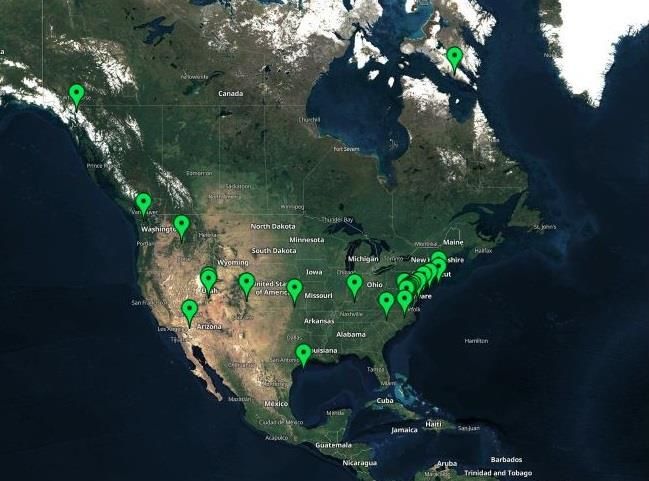
Unified Ceilometer Network
https://alg.umbc.edu/ucn/
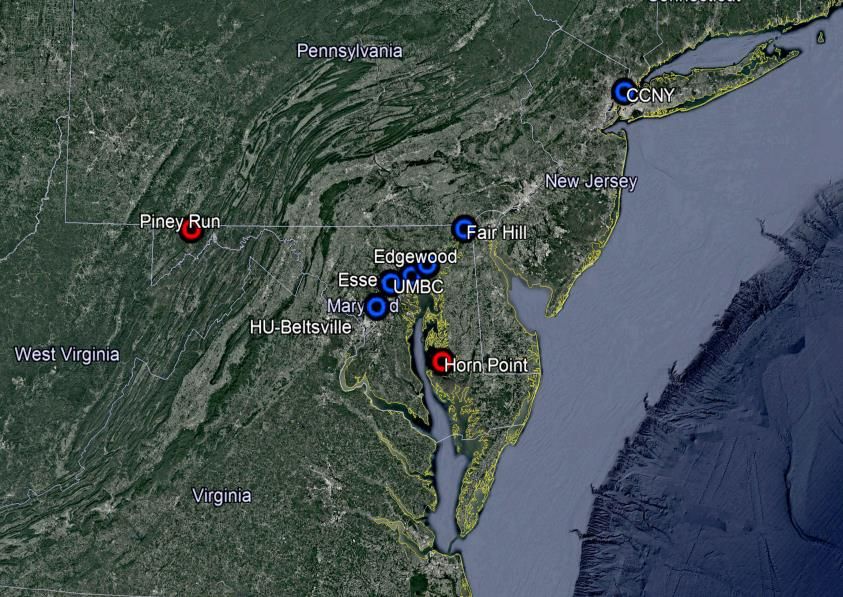
• Instrumentation: Coming Soon Online:
Ceilometer/Lidars
• Ceilometer, PANDORA, Auto GC CCNY Fair Hill, MD La Porte, TX SCAQ Management District
• Ambient air database (met, PM2.5, O3, NO2, Howard Univ./Beltsville
UMBC
Edgewood, MD Jerome Mack, NV
Essex, MD Iqaluit, NU, CA
NJDEP/Rutgers Univ.
EPA Region 10 (Idaho)
NOx, speciated VOCs) Virginia Tech Washington DC Squamish, BC, CA
Providence, RI Richmond, VA Whitehorse, YK, CA
Londonberry, NH Indianapolis, IN
• Validation/verification satellite products and Rocky Flats
New Haven, CT
meteorological/air quality forecasts. North, CO
Ardentsville, PA Konza Praire, KS
Bristol, PA Hawthorne, UT
Philadelphia, PA Lindon, UT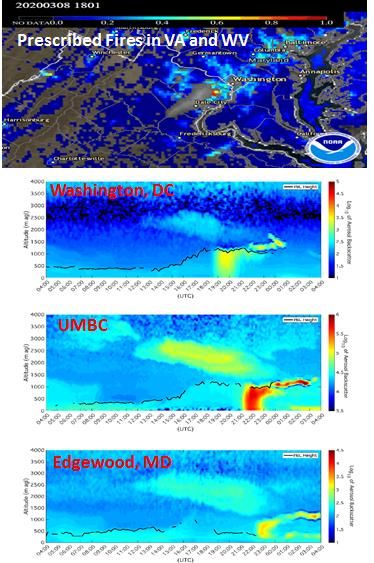
Real-Time Visualizations and Data Archive
          Real-Time                         Archive
                                                                                 PBL Automated Outputs:
                                                                        •   Cloud-base heights
                                                                        •   Precipitation flags
                                                                        •   Filtered PBL heights (NSL, RL, MLH)
                                                                        •   Uncertainties for PBL heights

                                                                                     Caicedo et al. (2020)
www.alg.umbc.edu/real-time-data-info/      www.alg.umbc.edu/archives/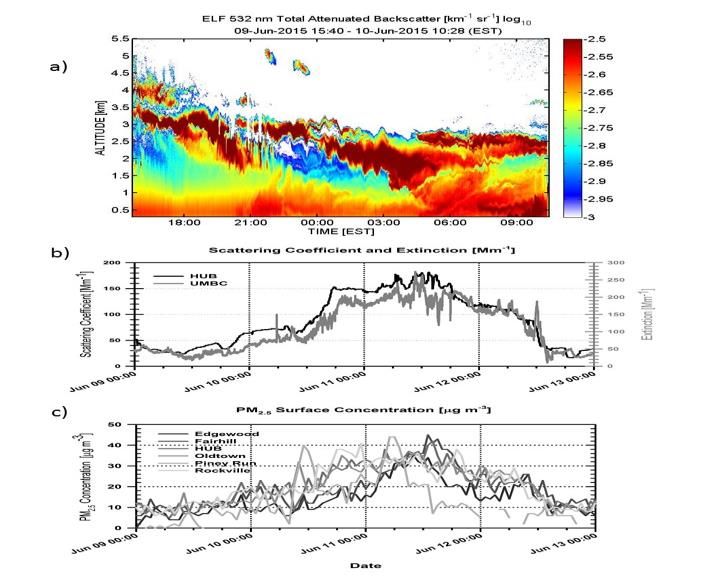
Features
Lufft Real-Time Display

                          Vaisala Real-Time Display

                                                      Current Features:
                                                      • Display of 15-minute data
                                                      • Notification of data transfer interruption
                                                      • Real-time diagnostic parameters
                                                      • Archiving all ‘raw’ data from all sites
                                                      • Displaying archive images for all sites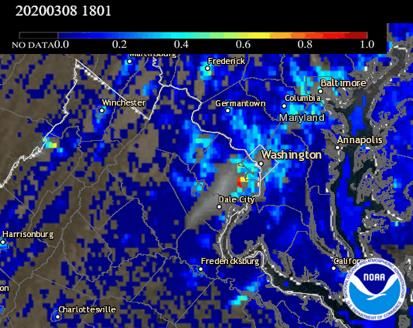
Planetary Boundary Layer Height Algorithm
An Automated Common Algorithm for Planetary Boundary Layer Retrievals Using Aerosol Lidars in
       Support of the U.S. EPA Photochemical Assessment Monitoring Stations Program
         Caicedo, V., R. Delgado, R. Sakai, T. Knepp, D. Williams, K. Cavender, B. Lefer, and J. Szykman.
                         J. Atmos. Oceanic Technol., doi.org: 10.1175/JTECH-D-20-0050.1

     Addresses instrumental signal quality                    Haar step-function to detect changes in aerosol
        (SNR, artifacts, overlap, etc.)                        backscatter profiles using multiple dilations

   Define minimum reliable signals and limitations

Common retrieval algorithm for heterogeneous network with proper QA applied to develop a data
product for use for the modeling community.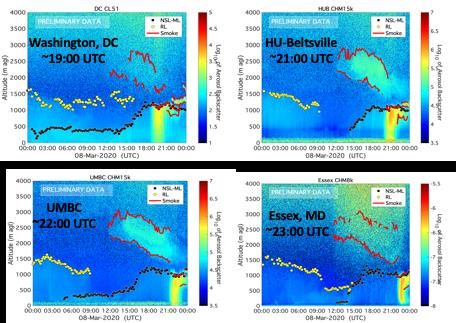
Planetary Boundary Layer Height Algorithm
Development of standardized retrieval algorithms for heterogeneous network

Automatically screens for clouds and             Layer attribution for the PBL height is supported
precipitation                                    with the use of continuation and time-tracking
• Derive cloud layer heights using the Haar      parameters
   wavelet retrieval methodology

                                   Cloud Layer

 Aerosol backscatter   Wavelet
                       Transform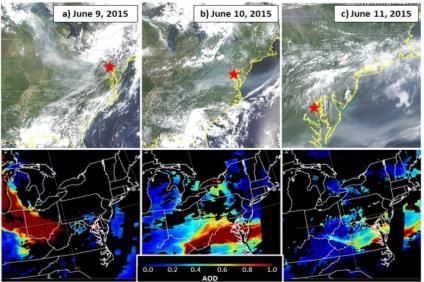
QA/QC and Calibration/Validation
•   ASTM International
     – Standard Guide for Measurement of Aerosol, Cloud, and Particle Pollution by
         Ceilometers
          •   Summary of the fundamentals of lidar, a description of the methodology and equipment used,
              factors to consider during site selection and equipment installation, and recommended procedures
              for acquiring valid and relevant data.

•   U.S. EPA Methods Document/Quality Assurance Project Plan (QAPP)
     – Quality Assurance for Ground Based Ceilometers

•   Ad-hoc Ceilometer Experiment Study (ACES) 2021
     – Evaluation of Lufft Cloud Simulator and Vaisala Termination Hood
•   Educational Materials
     – Introduction to Ceilometer: Instrumentation and Data Interpretation
          •   Available upon request

*Under preparation
Applications: Instrument Capability
• Ceilometer networks typically established by national weather services around the
globe primarily designed for detection of clouds.
• Instrument capability of providing observations of the vertical structure of the
boundary layer makes it a resourceful tool to study atmospheric phenomena.
• The presence of particle pollution in the atmosphere and their extension on a given
air mass can be determined from the ceilometer data.
• Comprehensive three-dimensional assessment of the air quality
Surface Measurements – Ceilometer - SatelliteThree-Dimensional Air Quality System (3D-AQS)
• UCN is at the center of a re-invigorated effort to combine
remote sensing and ground-based measurements of aerosol
concentrations into a 3D-view of the atmosphere.
• Designed to improve the accessibility of data for the air
quality community across the U.S.
• Serving two distinct audiences who need:
– Real-time tools that are used by forecasters for
interpretation and guidance on the day of
measurement
– Retrospective analysis tools for compliance assessment,
analysis, and event interpretation
Dreessen et al. 2016Three-Dimensional Air Quality System (3D-AQS)
Verification/Validation of Models and Satellite Products
PBL Height: Smoke transport within PBL observed by ceilometers network
Ceilometer vs NOAA FV3 and GFS model supplementing GOES-16/ABI AOD
(Loughner et al. 2019) (Huff et al. 2020)New Data Portal
• Data Portal Under Construction
• Dynamic display of ceilometer data
• Data Downloads
• Raw Data
• Retrieval (MLH) Data
• Data Export (ASCII, Netcdf)
• Quicklooks (jpeg, png)
• Synergy of air quality monitor data
and satellite observationsNew Data Portal
• Site Information (Including AQS designation)
• 3D-Air Quality System (3D-AQS)
- Integrates remote sensing observations from a
variety of platforms into air quality decision support:
Graphical Display of:
1- Ceilometer (Dynamic Interface)
2- Satellite Images
3- Surface Observations
- Data Download
• Mixing Layer Height Requirement: Data Submission
- UCN will follow guidance of U.S. EPA for data
submission to AQSMoving Forward
December 2020-March 2021
• Implementation of dynamical web display and retrieval applications
• Prototype pre-operational phase (i.e. operational testing)
April-May 2021
• Virtual Workshop on Ceilometer (Measurements, Applications and
Data Interpretation.
June 1, 2021
• Fully Operational Data Portal for U.S. EPA requirement
EPAMS Profiler and Ceilometer NetworkAcknowledgements
Primary Contacts:
Ruben Delgado, Vanessa Caicedo - University of Maryland, Baltimore County
Jim Szykman , Kevin Cavender - U.S. Environmental Protection Agency
Disclaimer: Although this work was reviewed by EPA and approved for publication, it may not necessarily reflect official Agency policy.Extra Slides
Technical Guidance
• Definition and guidelines for data transfer to UMBC database
       • Assisted FTP/HTTPS transfers setup

• Recommended guidelines for regular maintenance
       • Real-time instrument diagnostic monitoring

• Definition and guidelines for data usage/download
       •   Web portal documentation for data download and correct use of scientific data

• Guidance for the scientific use of data products
       •   Detailed documentation for data products and methodologies

• Review and exchange of relevant technical and scientific information

                                 EPAMS Profiler and Ceilometer Network
Data Archiving and Processing
Processing Chain
Ceilometer signals in Reformatted NetCDF for
Raw Level 1a uniform data format Raw Level 1b
native file format
Quality Assessment flags: Calibrations: Point Cloud/Rayleigh
Level 2 Saturation or instrument calibration, water vapor, overlap
failure background
Planetary boundary layer and
Level 3
Cloud base height processing
Level 1a: Data archiving of ‘raw’ signals directly from instrumentation
Level 1b: Reformatted ‘raw signals’ into uniform Network Common Data Form (NetCDF) data files
Level 2: NetCDF data files of calibrated signals
Level 3: PBL and cloud products: 10-minute to hourly retrievals (NetCDF data files and/or ASCII files)Synergy Ground Networks and Satellite AQ
• Real-time and Retrospective Analysis of Air Quality Events
• Correlation of Surface Mass Concentrations to Column
Huff et al., 2020
Measurements
• Above/Below Mixing Layer Height
• Aerosols: AOD-PM2.5 Estimator (MODIS, VIIRS)
• Ozone: TOLNET, PANDORA
• Verification/Validation of Satellite Products and Models
• GOES 16/ABI: Smoke Plume Height Injection
• TEMPO, MAIAYou can also read