2021 TASMANIAN SCALLOP FISHERY PRESEASON SURVEY REPORT - Targeted surveys Graeme Ewing, David Moreno, Robbie Kilpatrick, Aidan Dudgeon and Jayson ...
←
→
Page content transcription
If your browser does not render page correctly, please read the page content below
2021 TASMANIAN SCALLOP FISHERY
PRESEASON SURVEY REPORT

Targeted surveys

Graeme Ewing, David Moreno, Robbie Kilpatrick, Aidan
Dudgeon and Jayson Semmens

August 2021
INTRODUCTION AND SURVEY METHODS
The 2020 Tasmanian Scallop Fishery (TSF) preseason assessment yielded scallop density and
size structure data over a wide spatial scale. However, it also inadvertently resulted in
significant dredge effort expended on scallop beds with high discard rates to utilize the
allowable retained catch component of the survey. Consequently, the rules for participation
in the 2021 TSF preseason dredge survey were reformulated to ensure that significant survey
dredge effort would not be expended on beds with high discard rates. The three categories of
the preseason dredge survey, opportunistic, exploratory, and targeted surveys, were retained
in the new system (Appendix 1).

Dredge surveys
The 2021 (TSF) pre-season assessment was comprised of only targeted commercial dredge
surveys and IMAS video surveys. Regions identified in the 2020 survey as known scallop
beds (White Rock, The Gardens, and East Flinders) were demarcated and were not available
for opportunistic or exploratory dredge surveys (Appendix 1). IMAS developed a random
survey design within these regions for the targeted component of the dredge survey to better
reflect the variation in density of scallops across the defined area of interest. Fishers
participating in targeted dredge surveys were chartered by DPIPWE to sample in accordance
with the IMAS random survey design and did not retain scallops. The sites towed were
randomly assigned within the boundaries of polygons defined by DPIPWE managers as the
regions of commercial interest (Table 1, Fig. 1). An IMAS or department observer was
onboard for targeted surveys and catch weights (kg) of legal-sized scallops (≥ 90 mm) were
recorded for each tow. The observer recorded the size structure of each tow by measuring the
shell length (width at the widest point of the shell) of up to 100 scallops randomly sampled
from the ungraded catch. The density of legal-sized scallops was reported as the ratio of the
landed weight of legal sized scallops over the product of dredge width and tow length
(calculated from start and finish coordinates).

Video Surveys
The video component of the survey was conducted in the White Rock region of interest in
June 2021 (Table 1). Forty-nine sites within this region were randomly assigned for the 2020
White Rock Video Survey using the Create Random Points tool in the software package
ArcGIS 10.4. Assignment of random points was constrained within a 200 km2 polygon
(perimeter 72 km) provided by DPIPWE that defined the area of interest to management, and
with a minimum allowable separation of 500m. The 2021 survey deployed the IMAS towed
video camera unit at the sites from the 2020 video survey and towed from the site position in
a straight line transect for at least 500m, approximately 1m above the seafloor, and at around
1.5 knots. Each transect was recorded as a track on the vessel GPS unit.

Video footage from each site (in a randomised order) is currently being viewed and analysed
using video analysis software Transect Measure (SeaGIS) which allows frame-by-frame
analysis of the video footage. Within any frame a pixel-to-millimetre calibration was made
using a known distance (e.g., the separation of scaling lasers) allowing objects within that
frame to be measured in mm. The software also incorporated annotation of the position and
time sequence of objects and measurements within any frame. By matching the frame time
sequence with vessel GPS track time sequence data, the geographic position of objects in a
frame was determined. These features of the software were used to ascertain the number of
commercial scallops, their size, and their geographic position within the analysed segment of
each video transect.

Analysis of the video footage is ongoing and interim results of the 16 sites processed to date
have been included in this report. As the sites are being analysed in a randomised order, the
video results presented below are expected to be generally indicative of the final results of the
video survey.

Table 1: Survey tows conducted in the 2021 pre-season survey by region and survey method.

                                                 Dredge
 Area Region                                                                                Video
                        Vessel             Targeted Exploratory Opportunistic
 3      North Babel     Dell Richey II        30         -           -                        -
        South Babel     Dell Richey II        30         -           -                        -
 4      Pot Boil        Dell Richey II        30         -           -                        -
        The Gardens     Dell Richey II        28         -           -                        -
 6A     White Rock      Odete C               29         -           -                       48
                        Total                147                                             48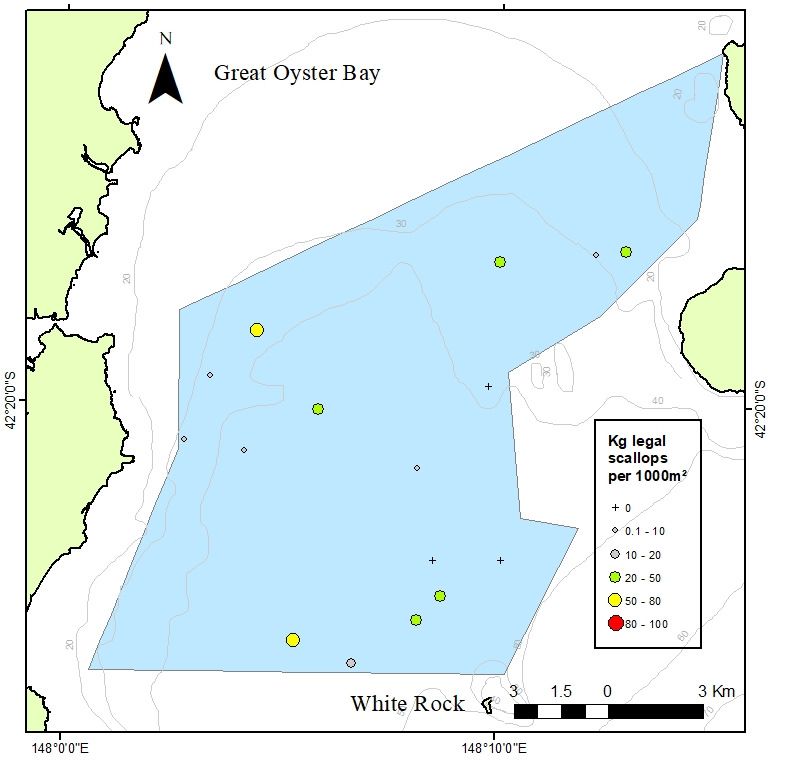
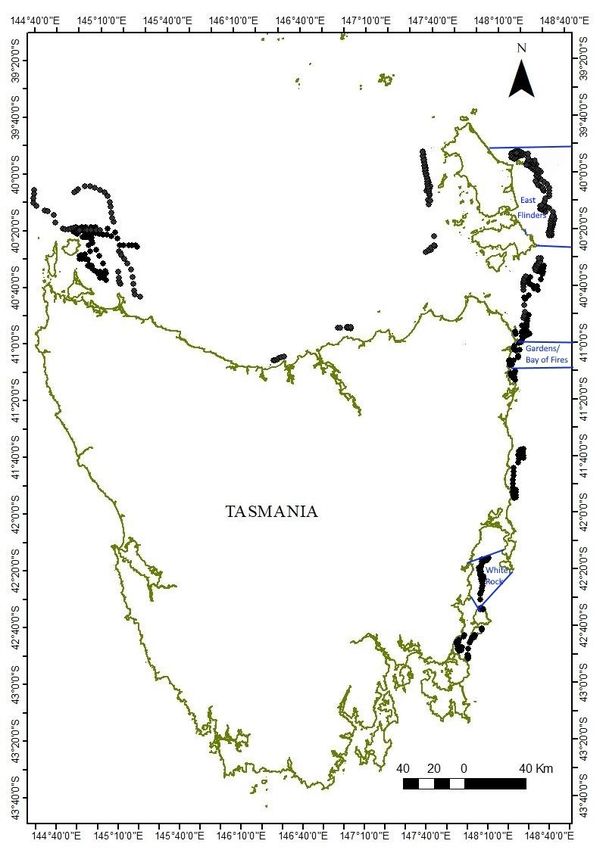
Figure 1. Map showing dredge survey tows (black dots).
SURVEYS RESULTS BY REGION
Area 6A White Rock
The White Rock targeted dredge survey consisted of 29 survey dredge tows deployed from
FV Odete C in May 2021 (Table 1; Fig. 1). The targeted dredge sites were a random subset of
the 48 sites randomly allocated in the White Rock region for the 2020 White Rock Video
survey. The 2021 White Rock video survey consisted of 48 tows of the IMAS towed video
unit. Video tows were each of around 500m in length and were also deployed on the sites
from the 2020 White Rock Video survey.

White Rock targeted dredge survey tows yielded an average density of legal-sized scallops of
15.6 kg/1000m2 (median 14.2 kg/1000m2), with a discard rate of 5.67% (Table 2; Figs. 2A
and 3A). Interim results from 16 of the tows from the video survey yielded an average
density of legal-sized scallops of 25.4 kg/1000m2 (median 21.6 kg/1000m2), with a discard
rate of 28.2% (Table 2; Figs. 2B and 3B). Higher representation of smaller scallops in the
video survey is expected and reflects the size selectivity of commercial scallop dredges.

The low to moderate densities of legal-sized scallops in the 2021 survey were similar to those
encountered in the 2020 pre-season survey. The lower proportions of sub-legal scallops and
higher average sizes relative to the 2020 survey reflect growth into the fishery of the standing
crop of scallops but may also indicate reduced stock recruitment. The full video survey
results may provide more clarity on size structure when available.

A low dredge survey discard rate, a decline in the video survey discard rate and high average
size indicate that the White Rock region has significantly less undersize scallops in 2020.
However, given the lack of recent recruitment, low to medium densities of legal-sized
scallops and the past history of openings and closures in this area, the merits of opening
White Rock in 2021 need to be given careful consideration, noting the depleted status of the
Tasmanian scallop fishery.

Table 2: Legal-sized scallop density, average size, and discard rate for the 6A White Rock
sub-region from recent dredge and video pre-season surveys.

                           Density (kg/1000m2)       Average Scallop size
 Season        Method                                                            Discard % 30          -                    -                          7.5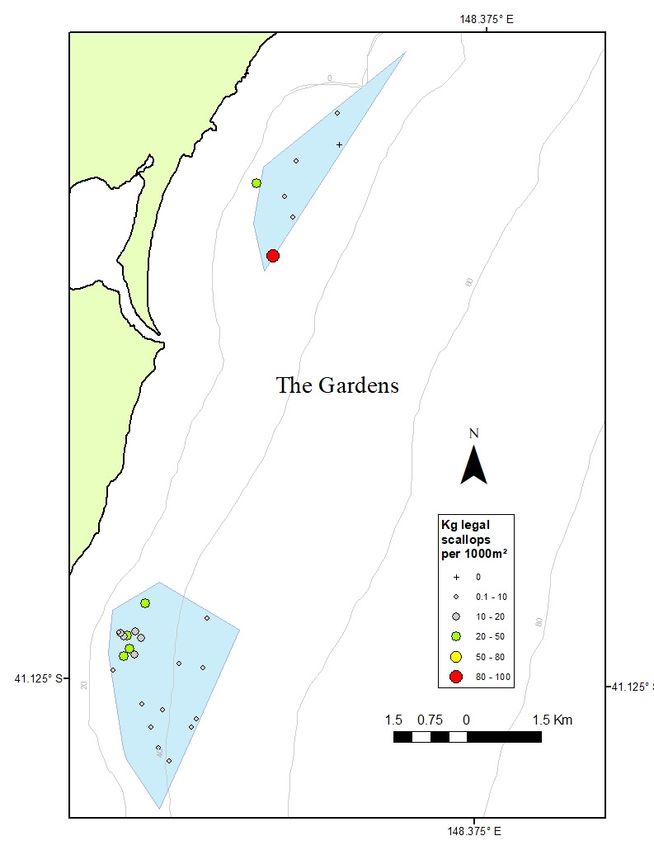
A
B
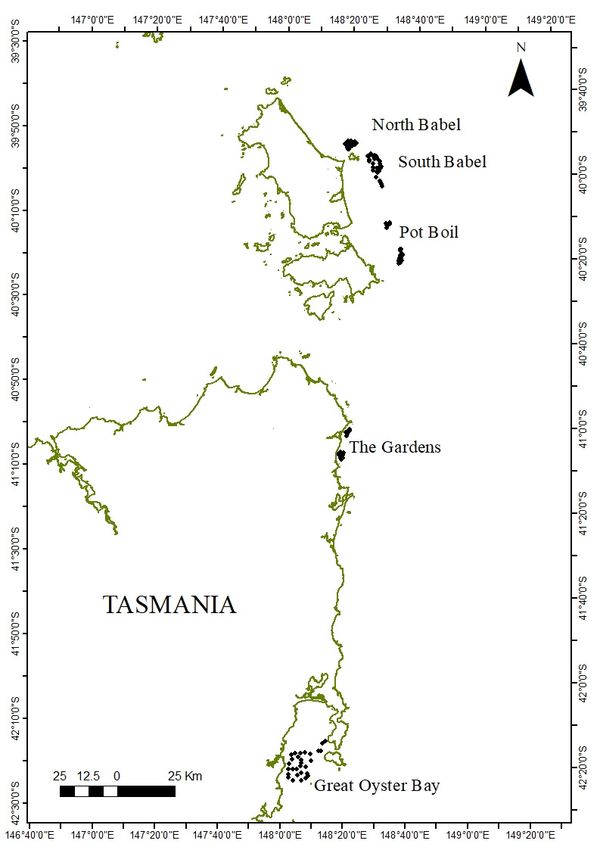
Figure 2. Legal-sized scallop density per tow for the White Rock dredge targeted survey (A)
and interim results from the video survey (B). Density is displayed as kg (of
scallops >90mm) per 1000m2.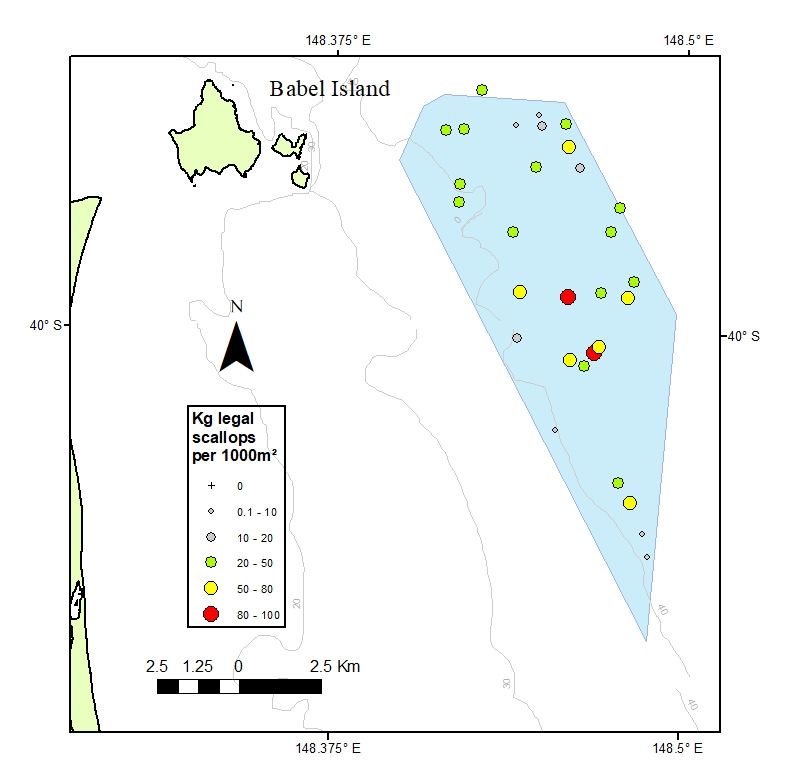
12
                              A                                      White Rock 2021
                         10
                                                                      Sub-legal: 5.67 %
Percentage of scallops

                         8                                            n= 2413

                         6

                         4

                         2

                         0
                              70
                              72
                              74
                              76
                              78
                              80
                              82
                              84
                              86
                              88
                              90
                              92
                              94
                              96
                              98
                              100
                              102
                              104
                              106
                              108
                              110
                              112
                              114
                              116
                              118
                              120
                              122
                              124
                              126
                              128
                              130
                              132
                              134
                              136
                              138
                              140
                          8
                                          Shell length (mm)
                              B
                          6
Percentage of scallops

                                                              White Rock 2021 - Video
                                                              Sub-legal: 28.2%
                                                              n= 587
                          4

                          2

                          0
                              70
                              72
                              74
                              76
                              78
                              80
                              82
                              84
                              86
                              88
                              90
                              92
                              94
                              96
                              98
                              100
                              102
                              104
                              106
                              108
                              110
                              112
                              114
                              116
                              118
                              120
                              122
                              124
                              126
                              128
                              130
                              132
                              134
                              136
                              138
                              140

                                       Shell length (mm)

Figure 3. Standardised length frequency distribution for the 29 dredge tows in the White
Rock targeted dredge survey (A) and interim video survey results (B). The dredge discard
rate was 5.67% from 2413 scallops measured at 90 mm minimum length with a mean size ±
se: 102.2 ± 0.2 mm. The video discard rate was 28.2% from 587 scallops measured at 90 mm
minimum length with a mean size ± se: 96.3 ± 0.6 mm. The vertical lines show the 90 mm
minimum length.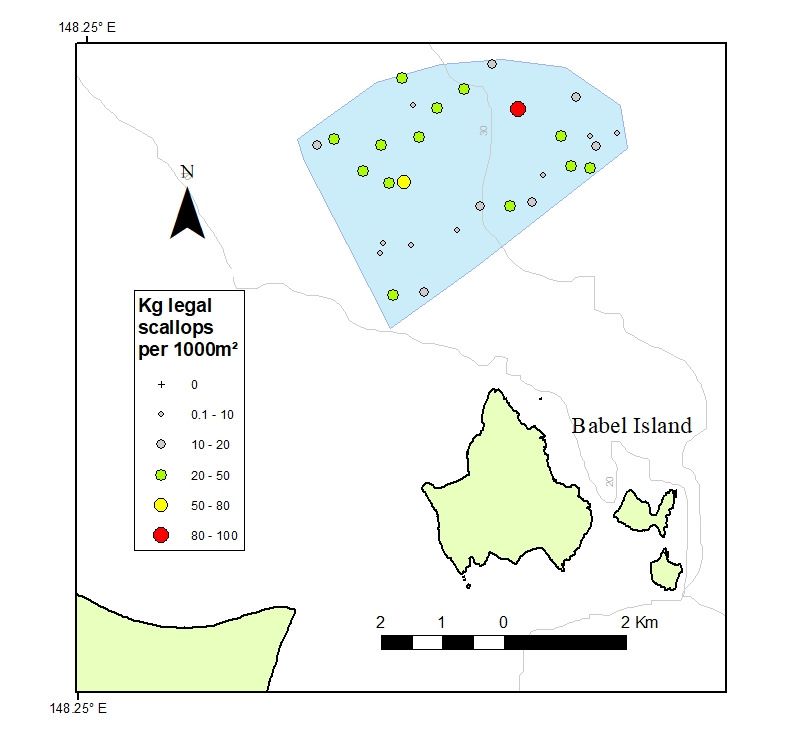
The Gardens
The Gardens targeted survey consisted of 28 survey dredge tows deployed from FV Dell
Richey II in June 2021 (Table 1; Fig. 1). The Gardens survey tows yielded an average density
of legal-sized scallops of 12.3 kg/1000m2 (median 4.8 kg/1000m2), with a discard rate of
61.3% (Table 3; Figs. 4 and 5). Average densities of legal-size scallops were similar to those
encountered in the non-random 2020 survey. Both surveys yielded very low median densities
indicating that average densities were strongly influenced by a small number of sites with
relatively high scallop densities.

Very high discard rates and patchy distribution indicate that the Gardens is currently not
suitable for opening (Table 2, Fig. 5).

Table 3: Scallop density, average size, and discard rate for The Gardens region in Area 4 in
2020 and 2021 pre-season surveys.

                   Density (kg/1000m2)         Average Scallop        Discard %
 Season
                  Average        Median        size (mm ± SE)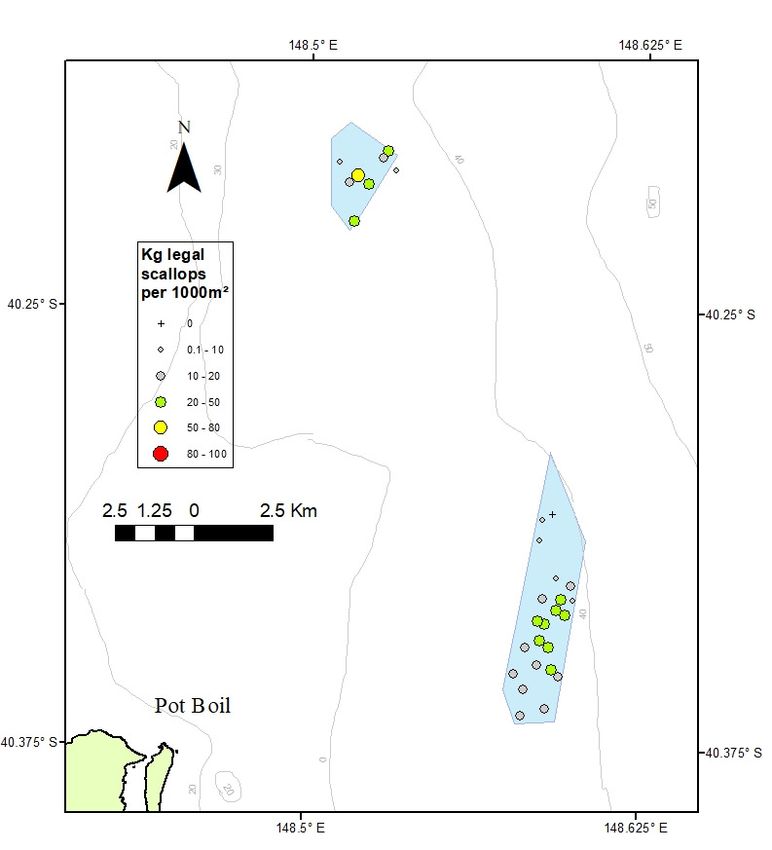
Figure 4. Legal-sized scallop density per shot for The Gardens targeted survey. Density is
displayed as kg (of scallops >90mm) per 1000m2.

12

                                                                          The Gardens 2021
                         10

                                                                          Sub-legal: 61.3 %
Percentage of scallops

                         8                                                n= 1563

                         6

                         4

                         2

                         0
                              70
                              72
                              74
                              76
                              78
                              80
                              82
                              84
                              86
                              88
                              90
                              92
                              94
                              96
                              98
                              100
                              102
                              104
                              106
                              108
                              110
                              112
                              114
                              116
                              118
                              120
                              122
                              124
                              126
                              128
                              130
                                                    Shell length (mm)

Figure 5. Standardised length frequency distribution for the 28 tows in the targeted survey
conducted in The Gardens (Area 4). Discard rate was 61.3% from 1563 scallops measured at
90 mm minimum length. Mean size ± se: 90.5 ± 0.32 mm. The vertical line shows the 90 mm
minimum length.

Pot Boil
The targeted survey conducted in the Pot Boil region to the east of Flinders Island in Area 4
consisted of 30 survey dredge tows deployed from FV Dell Richey II in June 2021 (Table 1;
Fig. 1). The Pot Boil survey tows yielded an average density of legal-sized scallops of 20.9
kg/1000m2 (median 19.1 kg/1000m2), with a discard rate of 43.6% (Table 4; Figs. 6 and 7).

Very high discard rates and moderate densities encountered at the Pot Boil in both the 2020
non-random and 2021 random surveys, indicate that this region is currently not suitable for
opening (Table 4, Fig. 7).

Table 4: Scallop density, average size, and discard rate for the Pot Boil region in Area 4 in
2020 and 2021 pre-season surveys.

                              Density (kg/1000m2)    Average Scallop    Discard %
   Season
                              Average     Median     size (mm ± SE)
Figure 6. Legal-sized scallop density per shot for the Pot Boil region in Area 4 targeted survey. Density is displayed as kg (of scallops >90mm) per 1000m2.
12
Pot Boil 2021
10
Sub-legal: 43.6 %
Percentage of scallops
8 n = 2069
6
4
2
0
70
72
74
76
78
80
82
84
86
88
90
92
94
96
98
100
102
104
106
108
110
112
114
116
118
120
122
124
126
128
130
Shell length (mm)
Figure 7. Standardised length frequency distribution for the 30 tows in the targeted survey
conducted in Pot Boil region (Area 4). Discard rate was 43.6% from 2069 scallops measured
at 90 mm minimum length. Mean size ± se: 92.2 ± 0.18 mm. The vertical line shows the 90
mm minimum length.
South Babel
The targeted survey conducted in the South Babel region to the east of Flinders Island in Area
4 consisted of 30 survey dredge tows deployed from FV Dell Richey II in June 2021 (Table 1;
Fig. 1). The South Babel survey tows yielded an average density of legal-sized scallops of
38.3 kg/1000m2 (median 36.3 kg/1000m2), with a discard rate of 26.7% (Table 5; Figs. 8 and
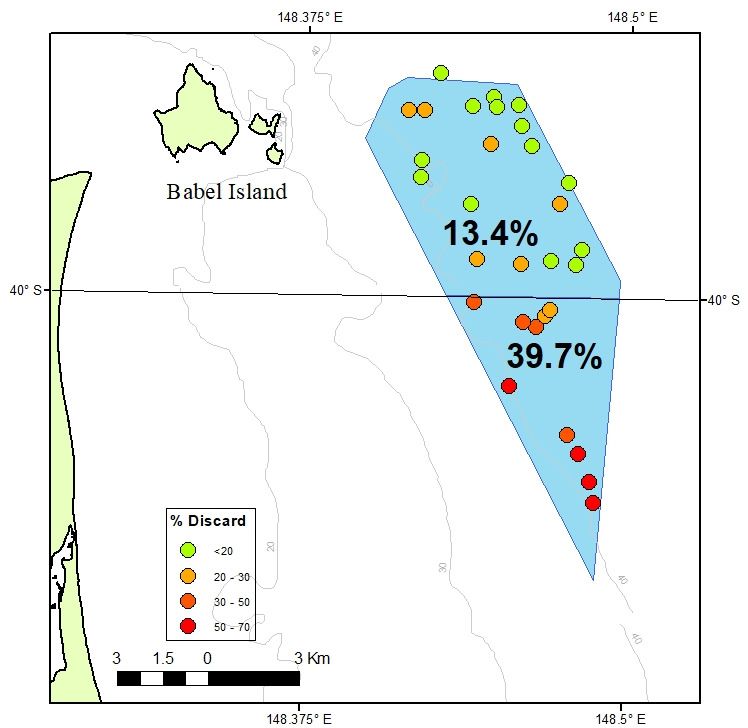
10A). While the densities of legal-sized scallops were distributed evenly throughout the
South Babel region (Fig. 8), discard rates were low in the north (Figs. 9 and 10B), and high in
the south of the region (Figs. 9 and 10C). Consequently, average densities have also been
provided for the upper and lower portions of South Babel region (Table 5).
Table 5: Scallop density, average size, and discard rate for the South Babel region in Area 4
in 2020 and 2021 pre-season surveys. Values have also been provided for the subsets of the
region above and below Latitude 400 south in the 2021 pre-season survey.
N Density (kg/1000m2) Average Scallop Discard %
Season Sub-Region
tows Average Median size (mm ± SE)Figure 8. Legal-sized scallop density per shot for the South Babel region in the Area 4 targeted survey. Density is displayed as kg (of scallops >90mm) per 1000m2.
Figure 9. Discard percentage per shot for the South Babel region in the Area 4. Percentage
text values indicate standardised discard rates for the portion of the South Babel region above
and below Latitude -400 south.
10

                     A
                                                                      Total South Babel
                 5                                                     Sub-legal: 26.7 %
                                                                       n = 2003

                 0
                10

                     B
% of scallops

                                                                     North of 400 S
                                                                   South Babel 2021
                 5
                                                                      Sub-legal: 13.4 %
                                                                      n = 1392

                 0
                10

                     C                                               South of 400 S
                5
                                                                   South Babel 2021
                                                                      Sub-legal: 39.7 %
                                                                      n = 611

                0
                     70
                     72
                     74
                     76
                     78
                     80
                     82
                     84
                     86
                     88
                     90
                     92
                     94
                     96
                     98
                     100
                     102
                     104
                     106
                     108
                     110
                     112
                     114
                     116
                     118
                     120
                     122
                     124
                     126
                     128
                     130
                                             Shell length (mm)

Figure 10. Standardised length frequency distributions for the targeted survey conducted in
South Babel region (Area 4). Plot A shows the distribution for the whole region (30 tows,
26.7% discard); plot B shows the distribution for sites that lie in the portion of the region
north of Latitude 400 south (20 tows 13.4% discard); and plot C shows the distribution for
sites that lie in the portion of the region south of the Latitude 400 south (10 tows 39.7%
discard). Mean size ± se for plot A was 96.62 ± 0.22mm, for plot B was 98.63 ± 1.22mm,
and for plot C was 92.04 ± 0.38mm. The vertical line shows the 90 mm minimum length.

North Babel
The targeted survey conducted in the North Babel region to the east of Flinders Island in Area
3 consisted of 30 survey dredge tows deployed from FV Dell Richey II in July 2021 (Table 1;
Fig. 1). The North Babel survey tows yielded an average density of legal-sized scallops of
24.1 kg/1000m2 (median 19.8 kg/1000m2), with a discard rate of 5.4% (Table 6; Figs. 11 and
12).

Low discard rates and moderate densities were encountered at North Babel in both the 2020
non-random and 2021 random surveys (Table 6, Fig. 12). This area meets the harvest
strategy rules for opening. However, this is a relatively small area, with a relatively small
biomass (Table 7), and as such may not be suitable to opening on its own.
Table 6: Scallop density, average size, and discard rate for the North Babel region in Area 3
in 2020 and 2021 pre-season surveys.
Density (kg/1000m2) Average Scallop Discard %
Season
Average Median size (mm ± SE) 90mm) per 1000m2.10
North Babel 2021
8
Sub-legal: 5.4 %
Percentage of scallops
n = 1409
6
4
2
0
70
72
74
76
78
80
82
84
86
88
90
92
94
96
98
100
102
104
106
108
110
112
114
116
118
120
122
124
126
128
130
Shell length (mm)
Figure 12. Standardised length frequency distribution for the 30 tows in the targeted survey
conducted in North Babel (Area 3). Discard rate was 5.4% from 1409 scallops measured at
90 mm minimum length. Mean size ± se: 103.8 ± 0.29 mm. The vertical line shows the 90
mm minimum length.BIOMASS ESTIMATES An estimated biomass of scallops within each of the polygons defined by DPIPWE managers as the regions of commercial interest was calculated using the standard method of scaling-up the mean density across the survey area for both the dredge and video surveys (Table 7). Biomass estimates have also been provided for the upper and lower portions of South Babel region because, despite similar densities, discard rates were low in the north of the region and high in the south of the region (Table 7). Note that adjusting the boundaries of the polygon containing the randomly allocated shots after conducting the survey violates the assumptions made in the analysis and as such the biomass values from the two new regions (North and South sections of the larger South Babel region) should be assessed with relative caution. An adjustment for dredge efficiency (Harrington et al. 2009) has been applied to the dredge biomass estimates and is also presented in Table 7. It should, however, be noted that the comparison between the dredge and video biomass estimates at the White Rock region in both the 2020 and 2021 surveys potentially raises questions around the validity of the adjustment applied for dredge efficiency, which will be further examined once all the video data has been examined. Consequently, dredge biomass values should be used as a relative value for comparison between the regions surveyed and future research should be focussed on determining robust estimates of dredge efficiency.
Table 7. Density and estimated biomass of legal-sized commercial scallops (Pecten fumatus) within each of the polygons defined by DPIPWE
managers as the regions of commercial interest, based on dredge and video survey methods. Biomass estimates are also provided for the portions
of the South Babel region that lie above and below the latitude 400 south. Dredge-derived biomass estimates adjusted for dredge efficiency
should be interpreted with caution as recent White Rock surveys raise questions about their validity. Biomass confidence intervals are 95%.

                                          Sub-                                    Biomass (t)           Adjusted Biomass (t)
                 Sub-                             Mean      SD       Area
 Region                Method        n    legal
                region                            kg/m2    kg/m2    (km2) lower CI Mean higher CI   lower CI   Mean     higher CI
                                            %
                   -    Dredge       29    5.7    0.0156   0.0144   20.0   2024    3122    4220      6072      9366       12660
 White Rock        -    Video-2021   14   28.2    0.0254   0.0230   20.0   2415    5077    7740        -         -          -
                   -    Video-2020   48   58.9    0.0219   0.028    20.0   2077    3161    4246        -         -          -
 Gardens           -    Dredge       28   61.3    0.0123   0.0184   10.4     54     128     202      162       384         606
 Pot Boil          -    Dredge       30   43.6    0.0210   0.0136   16.4    260     343     426      780       1029       1278
 South Babel       -    Dredge       30   26.7    0.0371   0.0246   67.6   1888    2509    3131      5664      7527       9393
                     0
 South Babel   Nth 40 S Dredge       20   13.4    0.0356   0.0200   40.9   1072    1456    1839      3216      4368       5517
 South Babel   Sth 400S Dredge       10   39.7    0.0401   0.0330   26.7    422    1073    1705      1266      3219       5115
 North Babel       -    Dredge       30    5.4    0.0241   0.0212   13.9    224     334     444      672       1002       1332
Appendix 1: Agenda Item 3: Scallop Fishery Advisory
Committee Meeting 62 – March 2021
Agenda Item 3 – Planning for 2021 Season and Surveys
Background
Scallop surveys are categorised in to three main categories:
• Opportunistic
• Exploratory
• Targeted
Opportunistic surveys generally take place as a vessel transits from port to an open area or to
participate in another fishery, catch can’t be retained.
Exploratory surveys take place during a defined period typically from April to June and are
designed to allow a scallop fisher to use their scallop fishing experience and knowledge to
locate potential commercially viable scallop beds. Exploratory surveys allow the retention of
scallops within an approved framework and can provide an indication of likely commercial
catch rates.
Targeted surveys target known scallop beds usually identified during an exploratory survey,
information from the survey will be used to make decisions regarding potential open areas.
Targeted surveys will follow a more structured format developed by IMAS and are typically
designed to map the extent of a scallop bed and provide estimates of scallop density. A
targeted survey will have an IMAS or DPIPWE approved observer on board to oversee the
survey and data collection.
Each survey type requires the collection of scallop size frequency data and the completion of
wheelhouse log forms.
In recent years (2017 and 2020) towed camera surveys techniques have been utilised and are
a fishery independent survey method utilising IMAS vessels and equipment. Towed camera
provides a wider understanding of bed size frequency and seabed environment that is not
subject to commercial dredge size selectivity.
2020 Survey
2020 saw an extensive state wide exploratory survey take place following two years of
closure (2018/19) where no survey activity occurred. A Targeted survey of the White Rock
area also took place with a DPIPWE approved observer on board.The survey was undertaken by two vessels with a total of 635 survey dredge tows deployed
and over 20,000 scallops measured. As a result, an extensive amount of information
regarding the location and size structure of scallop beds was obtained.
Areas of potential identified included:
• White Rock
• Gardens/ Bay of Fires
• East Flinders (Gull Isl to Babel Isl)
As such there is significantly more knowledge with which to plan and target surveys in 2021.
2020 also saw the use of a camera survey in the White Rock area, this survey was a
random stratified survey and was able to provide an estimate of total scallop biomass
and a wider understanding of scallop bed size structure.
2021 Survey Plan
Targeted Surveys
Given the knowledge that was gained from the survey last year it is proposed to progress
directly to a targeted survey for each of:
• White Rock
• Gardens/ Bay of Fires
• East Flinders (Gull Isl to Babel Isl)
It is proposed that IMAS will develop a random stratified survey plan for each of the above
areas, where an observer will be on board to oversee the survey and collect the necessary
data. A random stratified survey will allow a biomass to be calculated as occurs in the
BSCZSF fishery.
The bounds and the timing of the survey will take place in consultation with industry
participants and the Scallop Fishermen’s Association of Tasmania (SFAT).
The areas above will not be available for sate wide exploratory surveys. Approximate area of
the targeted surveys are indicated in attachment A.
It is proposed to use funds from the Scallop Research Trust account rather than retained
scallop catch to compensate fishers for participating in the targeted survey. The rate
proposed is $5,000 per survey day with a maximum budget of $30,000 for the survey. It is
expected that a targeted surveys for each of the three areas will take five days in total.
Survey participants would be expected to contribute in kind for travel time to and from
survey areas.
Exploratory surveys
It is proposed that the state-wide exploratory surveys progress excluding the areas covered by
the targeted surveys outlined in attachment A. In addition to the survey area catch cap (50t)
for each survey area it is proposed that retained catch be restricted to five tonnes from anyone single 7.5’ by 7.5’ catch reporting blocks. This is to ensure any commercial catch taken as a part of the survey is spread out as much as possible. Once the 5 tonne block catch is reached the block will be closed to further surveying. Should a scallop bed or beds within a survey area be identified as suitable to take a greater level of catch, then the survey participants will be able to undertake additional commercial fishing provided adequate survey coverage of the area has occurred. The area identified must meet the discard rate and will be determined in consultation with IMAS and the SFAT along with the level of catch. There is no guarantee that a survey area catch cap will be available to take in its entirety in any given area that is surveyed. Towed camera surveys IMAS has budgeted through the Sustainable Marine Research Collaboration Agreement (SMRCA) to undertake towed camera surveys during 2021. The priority for the towed camera survey will be White Rock, and should time and budget allow the towed camera survey may be extended to the Gardens/ Bay of Fires and East Flinders. Towed camera data will be an additional source of data and will be used in conjunction with dredge tow data when making decisions regarding a potential open area. Action for ScFAC To provide comment regarding the proposed 2021 survey plan. Attachment A- Targeted Survey Areas
You can also read