CHINA MOBILE GAMES REPORT H1 2021 - In association with: Nativex
←
→
Page content transcription
If your browser does not render page correctly, please read the page content below

CHINA
MOBILE GAMES
REPORT H1 2021
How China’s Mobile Habits Have
Changed Post-Lockdown

In association with:

CONTENTS
CONTENTS
CONTENTS
CONTENTS
  01   FOREWORD

  02   OVERVIEW OF MOBILE INTERNET USERS IN CHINA

       China’s Mobile Internet User Base

       Mobile Internet User Distribution Across City Tiers

       Average Time of Daily App Usage per Mobile Internet User

  07   OVERVIEW OF CHINA’S MOBILE GAMES MARKET

       China’s Game User Base and Growth Rate

       Actual Sales Revenue and Growth Rate of China’s
       Mobile Game Market

  11   CHINA MOBILE GAMES MARKET USER
       ACQUISITION TRENDS REPORT

  12   Overview
         Trend of the number of games running UA campaigns
        Rate of new games on the UA market
         Activation rate

  16   The Impact of iOS 14.5

        Percentage of devices with iOS 14.5 that have opted out of IDFA
        iOS 14.5 adoption rate
        Monthly distribution of paying devices across Android & iOS

  18   Genre-Specific Trends
         Ad spending distribution by genre
        Monthly new mobile game releases by genre
         Ad spending trends

  21   Trends of Ad Creatives for Games
         Video ads proportion
         Video ads vs. Image ads
FOREWORD
       There is real hope that there is light at the end of the
       tunnel where Coronavirus is concerned. Societies
       across the globe are opening up again – not least
       China’s, with many slowly easing back to a pre-
       pandemic way of life since the turn of the year.

       What impact will a return to normality have on the
       country’s mobile scene, though? Throughout 2020,
       and during the heights of lockdown, many turned
       to their mobiles and mobile gaming to pass the time.

       As a result, 2020 was a year of boom for China’s
       mobile scene. Mobile developers and publishers
       found new audiences and explored new mobile
       advertising possibilities.

       There was a concern amongst them, too. Could they
       keep these new audiences interested when ‘stay-at-
       home’ orders were eased? Would China’s citizens
       still maintain their newfound mobile usage habits?
       How would other external factors such as regulation
       impact the mobile market in conjunction with society
       reopening?

       This mobile games report takes a look at China’s
       mobile usage data over the course of H1 2021, drawing
       on a variety of different sources and comparisons
       to answer those questions and more. We hope you
       enjoy.

                                                             01
OVERVIEW
OF
MOBILE
INTERNET
USERS
IN CHINA
China’s Mobile Market Sees
A Return To Normality

                             02
China's Mobile Internet User Base
                                                     (Q4 2019 – Q1 2021)

                0.39%    0.39%       0.39%
0.30%
                                                 0.19%

                                                                  -0.19%

2019 Q4        2020 Q1   2020 Q2     2020 Q3    2020 Q4           2021 Q1

Source: Analysys.cn                                     QoQ Growth Rate

Mobile Internet User Distribution
Across City Tiers         (Q1 2020 vs. Q1 2021)

               12.4%           11.1%
                                                  Tier-1 Cities
               24.8%           22.0%
                                                  New tier-1 cities

                               19.0%              Tier-2 Cities
               19.9%
                                                  Tier-3 Cities
                               21.0%
               20.2%                              Tier-4 Cities

               14.2%           16.6%              Tier-5 Cities

                8.5%           10.3%
              2020 Q1          2021 Q1         Source: Analysys.cn

                                                                        03
Average Time of Daily App Usage
per Mobile Internet User     (Unit: Hour)

2020 Q1                                   6.7

2020 Q2                             6.0

2020 Q3                       5.4

2020 Q4                     5.0

2021 Q1                       5.3

Source: Aurora

                                                04
INSIGHTS

Mobile Internet User Base Growth
Slows as Market Saturates
By the end of the first quarter of 2021, the number of mobile Internet users
in China reached 1.03 billion - an increase of 0.78% compared to the same period
in 2020, but a decrease of 0.19% from the previous quarter.

In recent years, although the growth rate of mobile Internet users has been
slowing, it’s the first time negative growth has been seen, and indicates market
saturation has been reached.

01 Overview of Mobile Internet Users in China
   China’s Mobile Market Sees A Return To Normality                            05
Lower-Tier Emerging Markets Are Sparking
Growth Opportunities
Emerging markets have seen the largest increase in mobile Internet users.
The total proportion of tier 3 to 5 users is about 48%, narrowing the gap with
tier 1 and 2 cities. Mobile Internet users in tier-1 and 2 cities declined in the
first quarter of 2021, while the proportion of users in tier-3 to 5 cities has increased
significantly. Users from emerging markets are characterised by their high
price sensitivity, more leisure time, a strong social circle and willingness to try
out new products. Tier 3 to 5 cities represent huge marketing potential for
mobile developers and brands.

As Chinese Users Returned to Normality,
So Did Their Mobile Habits
The average time of daily app usage per mobile user was 5.3 hours in the first
quarter of 2021, compared against 6.7 hours during Q1 2020. This was likely
due to events including New Year's Day and Spring Festival holidays during the first
quarter. While usage time increased slightly compared with Q4 2020, the single-day
penetration rate of mobile apps dropped significantly, generally returning
to pre-pandemic levels.

01 Overview of Mobile Internet Users in China
   China’s Mobile Market Sees A Return To Normality                                    06

OVERVIEW
OF
CHINA’S
MOBILE
GAMES
MARKET
Sales Stay Strong Despite
Shifting Social Challenges

01 Overview of Mobile Internet Users in China
   China’s Mobile Market Sees A Return To Normality   07
China’s Game User Base and
Growth Rate              (Unit: million)

                             664.8                 665.9           667.6         666.5
     663.8

     0.13%                   0.15%                 0.17%           0.25%       -0.16%

    Nov 2020                Dec 2020              Jan 2021         Feb 2021     Mar 2021

Source: The Game Working Committee                         User Base          Growth Rate

Actual Sales Revenue and Growth
Rate of China’s Mobile Game Market
                                                                              (Unit: million)
     37.6%
                                                                                 588.3
     553.7                                                         541.5
                                                   508.5
                             493.0
                                                                                 8.6%
                                                                       6.5%
                                                    3.1%

                            -11.0%
    2020 Q1                 2020 Q2                2020 Q3         2020 Q4      2021 Q1

Source: The Game Working Committee                         Sales Revenue      Growth Rate

02 Overview of China’s Mobile Games Market
   Sales Stay Strong Despite Shifting Social Challenges                                         08
INSIGHTS As The Market Matures, Regulation Increases According to data from the Game Working Committee of China Audio-video and Digital Publishing Association, the number of mobile gamers reached 666 million in March 2021 - a decrease of about 1 million from the previous month. Consistent with trends of the overall mobile Internet user base, the number of gamers also experienced negative growth for the first time. At the same time, tightening approvals on domestic games in the first half of 2021 also had an impact on the market. The number of games that received “Ban Hao” (approvals) from January to May 2021 was 506, compared with 521 over the same period last year. These downward trends indicate that competition amongst game developers is becoming increasingly fierce. 02 Overview of China’s Mobile Games Market Sales Stay Strong Despite Shifting Social Challenges 09
Despite People Returning Back to Office,
The “Stay-At-Home” Economy is Here to Stay
In the first quarter of 2021, the sales revenue of the mobile game market
reached RMB 58.83 billion. Although the number of game users has
declined and the publication approval process has become stricter, the actual
sales revenue of the mobile game market has maintained steady growth.

With the gradual loss of ‘stay-at-home’ Pandemic traffic, there was still
an increase of 6.25% compared against Q1 2020, which reflected the vitality
of the domestic mobile game market. During Q1 2021, there were more
marketing activities during the New Year's Day and Spring Festival, users
were more active, and revenue grew.

02 Overview of China’s Mobile Games Market
   Sales Stay Strong Despite Shifting Social Challenges                         10
CHINA MOBILE
GAMES
MARKET
USER
ACQUISITION
TRENDS
REPORT
Creative Advertising Combats
The Fall In UA

01 Overview of Mobile Internet Users in China
   China’s Mobile Market Sees A Return To Normality   11
Overview

Trend of the number of games
running UA campaigns                                                   (H1 2020 vs. H1 2021)

9000

4500

     0
              Jan              Feb              Mar           Apr      May          Jun

                                                                      H1 2020        H1 2021

Comparison of the total number of products
launched in the mobile game UA market
                                                                        (H1 2020 vs. H1 2021)

    First half of 2020

    First half of 2021

0
                   4000                   8000                12000             16000

Souce: Reyun Data CAS (The domestic version)

03 China Mobile Games Market User Acquisition Trends Report
   Creative Advertising Combats The Fall In UA                                            12
INSIGHTS
Approximately 6,700 new products appeared on the UA market
in H1 2021, representing a growth rate of nearly 45% (about
13% lower than the same period last year).
Big tech companies, such as Tencent’s & Netease’s gaming
arms tend to launch new games at the beginning of the year,
most of which were developed during the previous year. This
resulted in a boom in Q1 2021 on the UA market.
13Rate of new games on the UA market
21% 20%
15% 18% 15%
14%
January February March April May June
Comparison of growth rate of new games
running UA campaigns (H1 2020 vs. H1 2021)
First half of 2020 57.7%
First half of 2021 44.5%
0% 20% 40% 60%
Souce: Reyun Data CAS (The domestic version)
14Activation rate (Unit: 10,000)
9000 1.00%
8000
7000
6000
5000 0.50%
4000
3000
2000
1000
0 0.00%
Jan Feb Mar Apr May Jun
Source: Reyun Data TrackingIO Activated Devices Activation Rate
15The Impact of iOS 14.5
Percentage of devices with iOS 14.5
32.1% that have opted out of IDFA
iOS 14.5 and above adoption rate 30.3%
Source: Reyun Data TrackingIO
Monthly distribution of paying devices across
Android & iOS
20% 21% 13% 16% 16% 19%
80% 79% 87% 84% 84% 81%
January February March April May June
Source: Reyun Data TrackingIO Android iOS
16INSIGHTS
Activation dropped as life return back to normal. Users getting
used to typical UA campaign creatives might be another reason.
The launch of iOS 14.5 in Q2 2021 had an impact on UA
performances. Data from Reyun Data’s TrackingIO shows that
among the data tracked, 30.3% of all devices had been updated
to iOS 14.5; among which 32.1% limited IDFA tracking.
In general, amongst all pay devices, the distribution of Android
vs. iOS is 8:2. The importance of Android in China cannot
be overstated.
03 China Mobile Games Market User Acquisition Trends Report
Creative Advertising Combats The Fall In UA 17Genre-Specific Trends
Ad spending distribution by genre (H1 2021)
RPG 35.7%
Casual Puzzles 19.3%
Simulation 9.9%
Online Earning 8.3%
SLG 6.1%
Card 5.3%
Shooters 3.4%
Idle 2.9%
Action 1.8%
Tower Defense 1.7%
MMO 1.2%
Racing 1.1%
Board 1.0%
0% 10% 20% 30% 40%
Source: Reyun CAS
18Monthly new mobile game releases by genre
(H1 2021)
RPG
Casual Puzzles
Online Earning
Simulation
Card
SLG
Idle
Shooters
Tower Defense
Action
Racing
Board
MMO
Rhythm
Sports
Jan Feb Mar Apr May Jun
Source: Domestic version of Reyun CAS Top 1 by monthly advertised products
Top 2 by monthly advertised products
19Ad spending trends
Top 3 65%
The top 3 genres combined
In the first half of 2021, RPG, Casual
accounted for 65% of the industry's
Puzzles, and Simulation games
total ad spend, down by nearly 10%
remained the top 3 mobile game
from last year. Ad spend became
genres in terms of ad spending —
more evenly distributed across
far ahead of other genres.
genres as some niche genres and
sub-genres spent more on ads.
SLG & Shooters Top 10
SLG and Shooters maintained their MMO dropped out of the top 10 —
places on the ad spending rankings. the fastest decline of all genres.
20Trends of Ad Creatives for Games
Top 30 daily creative sets for existing games
distributed across media types (H1 2021)
34.4% 21.1%
General News Short-Form Videos
18.9% 12.2%
Vertical News Browsers
11.1% 2.2%
Videos Tools
21Top 30 daily creative sets for new games
distributed across media types (H1 2021)
5.6%
Tools
22.5%
6.7%
General News
Videos
10.1% 22.5%
Vertical News
Readers
13.5% 19.1%
Browsers
Short-form Videos
Source: Domestic version of Reyun CAS
22Video’s Share of Total Ad Content ( 2020 & H1 2021)
80% 70% 75% 74%
62%
60% 54% 57%
40%
20%
0%
2020 Q1 2020 Q2 2020 Q3 2020 Q4 2021 Q1 2021 Q2
Videos ads vs. Images
in Content Growth Rate ( 2020 & H1 2021)
93%
90% 90% 91% 90% 90%
89%
88% 88%
87%
86%
84%
2020 Q1 2020 Q2 2020 Q3 2020 Q4 2021 Q1 2021 Q2
Source: Domestic version of Reyun CAS Videos Images
23INSIGHTS
News platforms and short-form video apps remain the favourites
of game advertisers, accounting for the majority of the top 30
creative sets. (Toutiao, Douyin are some of the samples of these
types of media.)
A new trend emerged this year: Among the nascent game advertising
media, vertical news platforms—along with general news platforms
—overtook short / ultra-short video apps to become the most used
types of game advertising media.
Reading platforms made it among the top media types for the first
time. Browsers remained largely unchanged in performance—
in terms of both ranking and market share.
Videos have been taking the lead, accounting for over 70% of all
mobile game ad content in the first two quarters of this year.
Both videos and images registered a nearly 90% content growth
rate. Currently, a major pain point is how to create video and image
content fast enough to keep up with fast-paced demand. Solving
this pain point has become an industry imperative.
24ONE-STOP
MOBILE
MARKETING
SOLUTION
Help You Achieve Success
In The Chinese Market
25
25ABOUT
XploreChina by Nativex is your one-stop mobile marketing solution designed to help
you achieve success in the Chinese market. As the only China-based agency to offer
acquisition, monetization, and creative services at scale and across multiple verticals,
we provide you with a wide range of transparent tools and solutions tailored to all
life cycle stages. To learn more, visit https://www.nativex.com/en/marketing-to-china.
Our Solutions
CHINA TOP MEDIA ANDROID SOLUTION
• Premium media buying solution • Step-by-step support for app
across China’s top media platforms. launching, management &
monetization on China’s main-
• Certified ad service provider for
stream Android app stores.
major Chinese media platforms
including ByteDance. • Real-time campaign data via
dedicated Android dashboard.
KOL MARKETING MORE SOLUTIONS
• Certified partner for China’s • Wide range of customized
top KOL agencies including marketing solutions tailored
ByteDance’s XingTu. to verticals, goals, and budgets.
• Working with 40,000+ KOLs • Services include PR & branding,
and 200+ MCNs. crisis management, social media,
SEO, and more.
• Premium creative services via
the TopWorks Studio.
Xplore China One-Stop Mobile Marketing Solution 2626Why Nativex XploreChina?
1. Premium Inventory Across China’s
Massive Mobile Ecosystem
18 + Strategic Partners in China's
Closed Media Ecosystem
272. Strong Partnerships with China's Top
Influencers
CERTIFIED 40,000+
AGENCY OF INFLUENCERS
KEY MEDIA Direct Partnerships
200+ MCNs 10+ VERTICALS
Strategic Partnerships Gaming / Social Commerce /
Comedy / Fashion, Health &
Beauty / Science & Education
/ Vlogging, and more
Top Chinese Kols We Work With
04 Help You Achieve Success In The Chinese Market
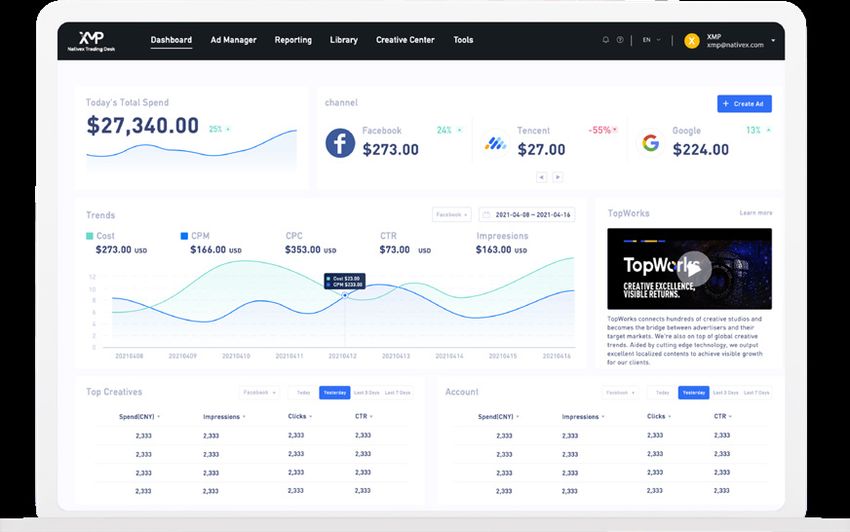
Xplore China One-Stop Mobile Marketing Solution 283. Cutting-Edge Media Buying Tools &
Creative Solutions
XMP by Nativex is the first multi-channel media buying
tool for media buyers, XMP allows you to streamline
complex campaign workflows across platforms like
Snapchat, Douyin, WeChat, Kuaishou, and more.
Interactive Playable Ads
Live-action Ads
VR Ads
3D Ads
TVC
Nativex’s TopWorks Creative Studio is a global creative
network. With 14 teams established in over 30 countries
across the world, TopWorks connects you with 200+
creative studios worldwide.
04 Help You Achieve Success In The Chinese Market
Xplore China One-Stop Mobile Marketing Solution 29Trusted by top-notch advertisers globally: 04 Help You Achieve Success In The Chinese Market Xplore China One-Stop Mobile Marketing Solution 30
Download our XploreChina
eBooks

04 Help You Achieve Success In The Chinese Market
   Xplore China One-Stop Mobile Marketing Solution   31
Check out XploreChina success stories

Learn more at Nativex XploreChina

Contact Us

This ebook was possible with
contributions from:
You can also read