Rightmove House Price Index - The largest monthly sample of residential property prices
←
→
Page content transcription
If your browser does not render page correctly, please read the page content below
Rightmove
House Price Index
The largest monthly sample of
residential property prices

    April 2019
  National edition

   Copyright © 2019, Rightmove plc. Released 15th April. For media enquiries and interviews please contact the
   Rightmove press office: T | 020 7087 0605 M | 07894 255295 or E | amy.murphy@rightmove.co.uk
Under embargo for 00.01 hours, Monday 15 th April 2019

 No Brexit deal yet, but families are doing housing deals
 • Price of new-to-the market properties increases by an average of 1.1% (+£3,447) this month, the
   biggest month-on-month rise for over a year and the largest at this time of year since 2016
 • Family home sector outperforming other sectors in key metrics as their housing needs outweigh
   uncertainty:
     • Holding value better, with average 0.7% year-on-year price increase for family homes
        compared to a fall of 0.1% nationally for all properties
     • More likely to sell, with number of sales agreed down 0.4% year-on-year while the national
        average drop is 1.6%
     • Slightly more willing to come to market, with 0.7% more new sellers than this time a year ago,
        compared with a 1.2% fall in new-to-the-market sellers nationally
 • Brexit delay could boost spring market activity as short-term uncertainty recedes

                                    National average asking prices
          Month        Avg. asking price    Monthly change      Annual change           Index
        April 2019         £305,449              1.1%                -0.1%              236.1
        March 2019         £302,002              0.4%                -0.8%              233.5
               National average asking prices by market sector (excluding Inner London)
        Sector            April 2019          March 2019        Monthly change      Annual change
  First-time buyers        £190,920            £189,606               0.7%              +0.1%
  Second-steppers          £275,573            £273,493              0.8%               +0.7%
  Top of the ladder        £539,130            £531,987               1.3%              -0.5%

      Monthly asking price trend

      £320,000

      £315,000

      £310,000

      £305,000

      £300,000

      £295,000

      £290,000

      £285,000
                    Apr-18 May-18 Jun-18 Jul-18 Aug-18 Sep-18 Oct-18 Nov-18 Dec-18 Jan-19 Feb-19 Mar-19 Apr-19

        Rightmove measured 112,570 asking prices this month, circa 90% of the UK market. The properties were put on sale
        by estate agents from 10th March 2019 to 6th April 2019 and advertised on Rightmove.co.uk.

  2
                 Copyright © 2019, Rightmove plc. Released 15th April. For media enquiries and interviews please contact the
                 Rightmove press office: T | 020 7087 0605 M | 07894 255295 or E | amy.murphy@rightmove.co.uk
Overview
It is usual for properties coming to the market at this time of year to see a price rise as the spring
moving season gets under way, but this month’s 1.1% (+£3,447) uplift is the highest in April since
2016 and the largest monthly rise seen since March 2018. The uncertain political backdrop
continues to hold back the market, with new seller asking prices, the number of properties coming
to market and the number of sales agreed all below this time last year. But despite these headline
falls, market activity remains resilient with would-be buyers and sellers still having housing needs
to satisfy, especially in the family home sector.
Miles Shipside, Rightmove director and housing market analyst comments: “The rise in new seller
asking prices reflects growing activity as the market builds momentum, egged on by the arrival of
Easter. Some sectors of the market and some parts of the country have strong buyer demand and
a lack of suitable supply. However, on average, properties are still coming to the market at slightly
lower prices than a year ago. It’s one of the most price-sensitive markets that we’ve seen for years,
with buyers understandably looking for value or for homes with extra quality and appeal that suit
their needs.”
The family home sector made up of three and four-bedroom properties (excluding four-bedroom
detached) is outperforming other sectors in the key metrics. Families’ housing needs, often driven
by the need for more space or proximity to schools, are outweighing the ongoing political
uncertainty. These properties are holding their value better than other sectors, coming to the
market at asking prices 0.7% on average higher than a year ago compared to the national average
fall for all properties of 0.1%. Owners of this type of property are also slightly more willing to come
to market, with 0.7% more new sellers than this time a year ago, compared with a 1.2% fall in new-
to-the-market sellers nationally. Finally, this sector is more likely to sell, with the number of sales
agreed down by just 0.4% compared to this time last year, while the national average drop is 1.6%.
Shipside adds: “Properties in this middle sector offer the ideal escape route to families looking for
more bedrooms, more space and their choice of schools. They are often second-steppers out-
growing their first property and it gets harder to postpone a move with growing children. They may
have already delayed for a year or two waiting for Brexit clarity, and understandably their patience
is wearing thin. While some movers are awaiting the outcome of deal or no deal, many families are
keeping on dealing in the housing market.”
The EU’s offer of a Brexit extension until October coincides with what is usually the busiest moving
season. While it is only a postponement, it lasts for long enough to relieve some of the short-term
uncertainty, and so it arrives at an opportune time for the housing market.
Shipside observes: “No doubt there are still a lot of twists and turns to come, but this extension
could give hesitating home movers encouragement that there is now a window of relative certainty
in uncertain times. We are not anticipating an activity surge, but maybe a wave of relief that
releases some pent-up demand to take advantage of static property prices and cheap fixed-rate
mortgages. This demand is clearly there as March was Rightmove’s busiest ever month with over
145 million visits to the site.”
Miles Shipside, Rightmove director and housing market analyst says: “Properties in this middle
sector offer the ideal escape route to families looking for more bedrooms, more space and
their choice of schools. They are often second-steppers out-growing their first property and it
gets to harder to postpone a move with growing children.”
3
Copyright © 2019, Rightmove plc. Released 15th April. For media enquiries and interviews please contact the
Rightmove press office: T | 020 7087 0605 M | 07894 255295 or E | amy.murphy@rightmove.co.ukAgents’ views
Bruce King, Director of Cheffins estate agents in Cambridge says: “Whilst the 2018
market definitely was not all doom and gloom, 2019 has certainly seen a new vigour.
Whilst activity and the actual number of sales is still lower than this time last year, the
number of active buyers within the market has increased which has helped to contribute
to price rises for the best properties available. We’re certainly seeing an uplift in activity
as we come into the spring and summer months. The best way to describe the sentiment
in the market at the moment is ‘bored of Brexit;’ fed up with sitting on their hands, sellers
are now looking to get on with their lives and move house and buyers are looking to
secure somewhere new. People’s reasons for moving are still as relevant now as they
ever were and buyers in the market still need to upsize, downsize, move locations, move
into school catchments and so on and we are seeing that they are now returning to the
marketplace as they realise that they can’t keep putting life on hold. Families in particular
have been most active in the market over the past few months with house moves driven
by schools, job relocations or upsizing.”
Nick Leeming, Chairman of Jackson-Stops, comments:”With Brexit delays becoming
somewhat of a blur, buyers across the country are getting back to business as usual and
are re-establishing the search for their dream home. However, with demand currently far
outweighing supply, buyers, particularly those in the family homes market, have become
frustrated at the lack of new homes coming to market. This greater competition has
resulted in upward pressure on prices, so it is perhaps not surprising to see today’s data
showing a greater monthly price increase. The early bird gets the worm and now
represents an ideal time to buy if you are upsizing. Properties that are well-priced and of
a high-quality are being snapped up quickly and we expect that to continue as we head
into the busier, warmer months ahead.”
4
Copyright © 2019, Rightmove plc. Released 15th April. For media enquiries and interviews please contact the
Rightmove press office: T | 020 7087 0605 M | 07894 255295 or E | amy.murphy@rightmove.co.ukAsking price trends
Five year asking price trend
£320,000
£310,000
£300,000
£290,000
£280,000
£270,000
£260,000
£250,000
£240,000
£230,000
£220,000
Apr-14 Oct-14 Apr-15 Oct-15 Apr-16 Oct-16 Apr-17 Oct-17 Apr-18 Oct-18 Apr-19
% monthly change in average asking prices
1.5%
1.0% 1.1%
1.0% 0.8% 0.7% 0.7%
0.5%
0.4% 0.4% 0.4% 0.4%
0.0%
-0.1%
-0.5%
-1.0%
-1.5%
-1.5%
-2.0% -1.7%
-2.5% -2.3%
Apr-18 May-18 Jun-18 Jul-18 Aug-18 Sep-18 Oct-18 Nov-18 Dec-18 Jan-19 Feb-19 Mar-19 Apr-19
5
Copyright © 2019, Rightmove plc. Released 15th April. For media enquiries and interviews please contact the
Rightmove press office: T | 020 7087 0605 M | 07894 255295 or E | amy.murphy@rightmove.co.ukAverage time to sell and stock
Average 'time to sell' (no. of days) - National
85
80 77
75
71
70
70 67
65
65
61 61 61
60
59
60 57
56 56
55
50
45
40
Mar-18 Apr-18 May-18 Jun-18 Jul-18 Aug-18 Sep-18 Oct-18 Nov-18 Dec-18 Jan-19 Feb-19 Mar-19
Average stock per agent (including Under Offer/Sold STC)
60
52 53 52 52 52
50 50
50 47 48
45 46 45 46
40
30
20
10
0
Mar-18 Apr-18 May-18 Jun-18 Jul-18 Aug-18 Sep-18 Oct-18 Nov-18 Dec-18 Jan-19 Feb-19 Mar-19
6
Copyright © 2019, Rightmove plc. Released 15th April. For media enquiries and interviews please contact the
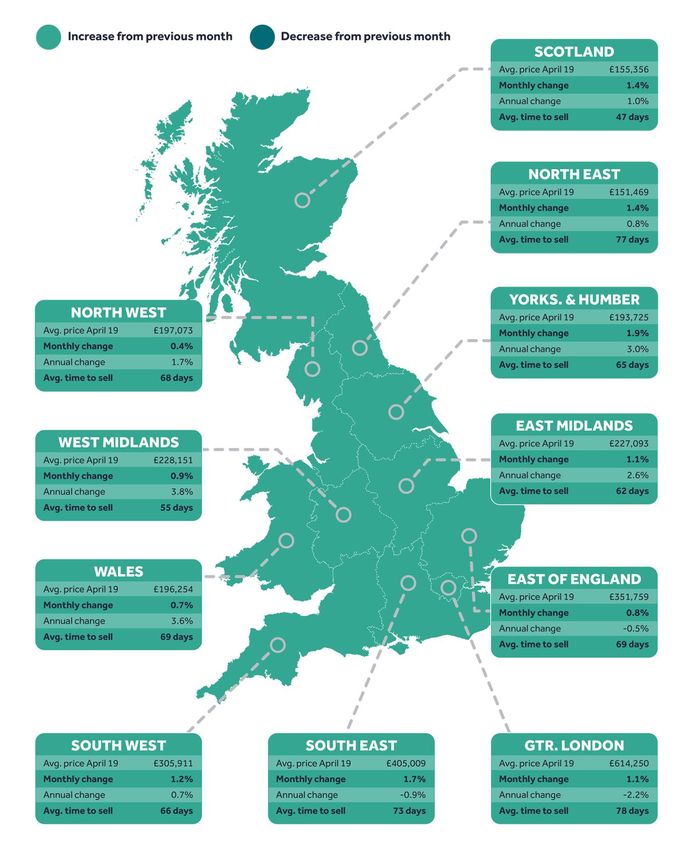
Rightmove press office: T | 020 7087 0605 M | 07894 255295 or E | amy.murphy@rightmove.co.ukRegional trends
7
Copyright © 2019, Rightmove plc. Released 15th April. For media enquiries and interviews please contact the
Rightmove press office: T | 020 7087 0605 M | 07894 255295 or E | amy.murphy@rightmove.co.ukLondon trends
Average 'time to sell' (no. of days) - London
100
95
89
90
85 82 82
80 78
76
75 72 72 72 71
70
70 67 67 67
65
60
55
50
Mar-18 Apr-18 May-18 Jun-18 Jul-18 Aug-18 Sep-18 Oct-18 Nov-18 Dec-18 Jan-19 Feb-19 Mar-19
8
Copyright © 2019, Rightmove plc. Released 15th April. For media enquiries and interviews please contact the
Rightmove press office: T | 020 7087 0605 M | 07894 255295 or E | amy.murphy@rightmove.co.ukLondon trends
Borough data is based on a three-month rolling average and can be used as an indicator of overall
price trends in each borough over time. It is not directly comparable with the overall London
monthly figures.
Avg. price
Borough Monthly change Annual change
April 2019
Havering £411,119 -0.6% 0.4%
Southwark £645,549 2.6% 0.2%
Redbridge £453,142 0.5% -0.2%
Wandsworth £812,750 1.9% -0.3%
Barking and Dagenham £313,688 1.1% -0.3%
Enfield £453,923 1.1% -0.5%
Islington £761,455 2.0% -0.9%
Newham £408,920 1.4% -1.1%
Waltham Forest £477,995 0.6% -1.4%
Bexley £403,515 0.3% -1.6%
Bromley £528,005 0.6% -1.8%
Ealing £551,429 0.4% -1.9%
Sutton £459,418 1.9% -1.9%
Harrow £547,591 0.9% -1.9%
Greenwich £441,685 1.3% -2.2%
Hillingdon £484,215 1.0% -2.4%
Croydon £432,033 1.4% -2.6%
Hounslow £545,667 0.7% -2.6%
Haringey £602,863 0.1% -2.6%
Brent £569,278 1.0% -2.6%
Westminster £1,424,478 0.6% -2.7%
Lambeth £627,469 3.8% -2.7%
Hammersmith and Fulham £922,700 0.7% -2.9%
Richmond upon Thames £810,227 -0.9% -3.0%
Camden £968,144 -1.7% -3.1%
Lewisham £458,342 0.2% -3.8%
Kingston upon Thames £607,641 -0.2% -3.9%
Barnet £634,472 0.9% -4.1%
Merton £628,333 0.5% -4.3%
Tower Hamlets £562,270 1.5% -5.7%
Hackney £625,637 -0.7% -5.8%
Kensington and Chelsea £1,516,867 0.5% -7.0%
9
Copyright © 2019, Rightmove plc. Released 15th April. For media enquiries and interviews please contact the
Rightmove press office: T | 020 7087 0605 M | 07894 255295 or E | amy.murphy@rightmove.co.ukEditor’s notes
About the Index:
The Rightmove House Price Index methodology was updated in January 2018. The report now includes data for
Scotland and a number of measures have been refined. The stock per agent figure now calculates the average based
on the number of properties an agent has on Rightmove each day across the month, rather than the average of the
total number of properties each agent advertised in the month. London asking prices are now broken down into travel
zones. For the purpose of historical comparisons, the historical figures have been restated based on the new
methodology.
The Index includes asking price breakdowns in the housing market to offer trends at three different sectors of the
market: first-time buyer, second-stepper and top of the ladder. Inner London prices have been excluded from this
categorisation as the normal housing ladder is not really applicable.
Advertising property for over 90% of all UK estate agents, Rightmove is in a unique position to identify any immediate
changes in the market. Rightmove’s House Price Index is compiled from the asking prices of properties coming onto
the market via over 13,000 estate agency branches listing on Rightmove.co.uk. Rather than being a survey of opinions
as with some other indices, it is produced from factual data of actual asking prices of properties currently on the
market. The sample includes up to 200,000 homes each month – representing circa 90% of the market, the largest and
most up-to-date monthly sample of any house price indicator in the UK. The Index differs from other house price
indicators in that it reflects asking prices when properties first come onto the market, rather than those recorded by
lenders during the mortgage application process or final sales prices reported to the Land Registry. In essence,
Rightmove’s Index measures prices at the very beginning of the home buying and selling process while other indices
measure prices at points later in the process. Having a large sample size and being very up-to-date, the Rightmove
Index has established itself as a reliable indicator of current and future trends in the housing market.
Rightmove measured 112,570 asking prices this month, circa 90% of the UK market. The properties were put on sale
by estate agents from 10th March 2019 to 6th April 2019 and advertised on Rightmove.co.uk.
Market sectors explained:
First-time buyer: This figure represents the typical property a first-time buyer would purchase, covering all two bed
properties and smaller that come to market (houses and flats).
Second-stepper: This figure represents the typical property of a person moving from their first home, covering all
three and four bed properties that come to market (houses and flats) excluding four bed detached houses.
Top of the ladder: This figure represents asking prices at the top end of the market, covering all five bed properties
and above (houses and flats), as well as four bed detached houses.
About Rightmove.co.uk:
Rightmove.co.uk is the UK’s leading property website, displaying details of homes for sale or rent to the largest online
audience. It is consistently ranked the number one property website in the UK (source: Experian Hitwise). It has circa
90% of all properties for sale and at any time displays a stock of over one million properties to buy or rent. The
Rightmove.co.uk site attracts over 130 million visits from home movers each month with time on site averaging over
one billion minutes per month (Rightmove data, July 2017).
10
Copyright © 2019, Rightmove plc. Released 15th April. For media enquiries and interviews please contact the
Rightmove press office: T | 020 7087 0605 M | 07894 255295 or E | amy.murphy@rightmove.co.ukYou can also read