Supply Constraints Keep Pressure on Prices - Market Indicators Report | First Half 2018 - Colliers International
←
→
Page content transcription
If your browser does not render page correctly, please read the page content below
Market Indicators Report |
 First Half 2018

AUCKLAND RESIDENTIAL DEVELOPMENT REPORT

Supply
Constraints
Keep
Pressure
on Prices

SKHY
Grafton, Auckland
Architect: Cheshire
Developer: Lamont & Co.

Accelerating Success
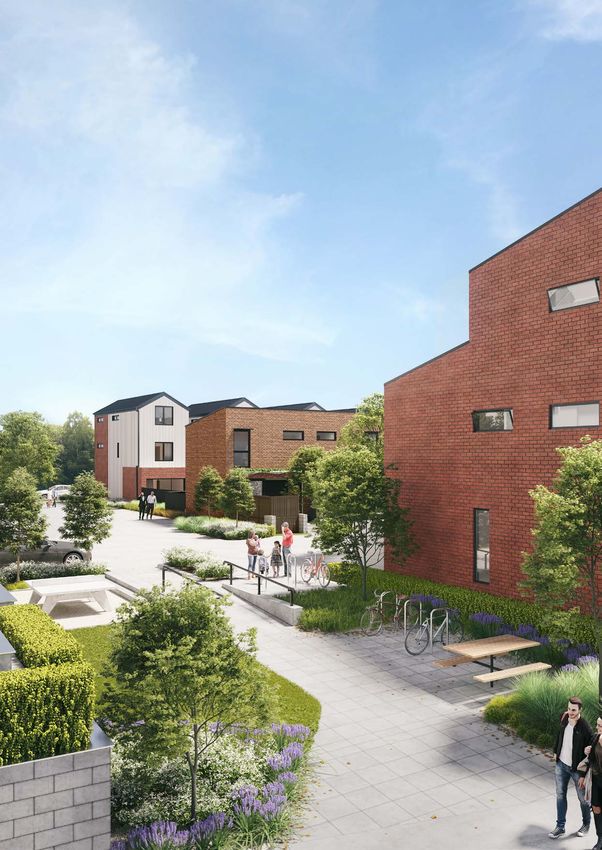
O.K.L.A.
3 Kaipiho Lane, Albany, Auckland
Architect: Ignite Architects
Developer: Kingsman Development
O.K.L.A. is a collection of 117 contemporary and refined apartments
over six levels with a boutique retail offering at ground floor. Located in
the heart of Albany, O.K.L.A. has a choice of 1, 2 and 3 bedroom
apartments with generous balconies. O.K.L.A. has been inspired by
modernist architecture, with an honest, functional and timeless
aesthetic, bringing everyday luxury to Albany.

Contents
Macro - Economic Factors                   1

Auckland Residential Property Indicators   2

Residential Market Overview                3

New Zealand Residential Market             4

Auckland Residential Market                4

  colliers.co.nz/Find-Research

  Follow us on LinkedIn:
  Colliers International - New Zealand

  Follow us on Twitter: @Colliers_NZ

  Subscribe on YouTube: ColliersIntNZ
Macro-Economic Factors
INFLUENCING THE RESIDENTIAL PROPERTY MARKET

POPULATION                                              EMPLOYMENT & WAGES                              CONSTRUCTION COST
Population changes adjust the pressures                 Changes in unemployment and wages               Changes in construction and material
on the housing market.                                  change a household’s willingness to             costs affect sale and land prices.
                                                        take on more debt.

     5.5%                        Decrease in annual
                                 net migration.             0.4%                        Decrease in
                                                                                        unemployment.          4.6%                        Increase in residential
                                                                                                                                           building construction
                                                                                                                                           cost index.
             MARCH 2017: 71,932                                    MARCH 2017: 5.0%                                  MARCH 2017: 2,007
             MARCH 2018: 67,984                                    MARCH 2018: 4.6%                                  MARCH 2018: 2,099
Source: Stats NZ, Permanent & long-term migration by    Source: Stats NZ, Labour Force Status by        Source: Stats NZ, Price Index by Item of Capital Goods;
age, sex and NZ area (Annual-Mar)                       Sex by Age Group (Annual-Mar)                   (Base: September Quarter 1999 = 1000) (Quarterly-Mar)

FINANCING                                               GOVERNMENT POLICIES                             INFRASTRUCTURE
Changes in mortgage interest rates affect               Government policy changes alter the             Changes in infrastructure and public transport
households’ ability to repay their mortgage.            supply and demand balance of a                  can promote access to the local area and
                                                        housing market.                                 subsequently boost property values.

  0.02                       % Decrease  in two-year
                               fixed mortgage
                                     interest rates.
                                                        March committed
                                                                The Government has

                                                        2018 programme
                                                                         $2 billion for
                                                              KiwiBuild, an ambitious
                                                                          that aims to
                                                                                                        April
                                                                                                        2018
                                                                                                                              East West Link “Scale Down”.

                    APRIL 2017: 5.07%                                                                   Ministry of Transport’s revised Auckland
                    APRIL 2018: 5.05%                          deliver 100,000 affordable, quality
                                                             homes for first home buyers over the       Transport Alignment Project package (ATAP2)
                                                                 next decade, 50,000 of them in         will invest around $800m into the East West
                                                                                       Auckland.        Link, a reduction of around $950m from the
Source: RBNZ, New residential mortgage interest rates                                                   earlier proposal.
(average % end of month), 2-years                       Source: MBIE, KiwiBuild                         Source: NZTA, State Highway Projects

                                                                                          1
Residential Property Indicators
AUCKLAND | FIRST HALF 2018
RESIDENTIAL BUYER TYPES
40% 20%
Movers
26%
Multiple property First home buyers
owners Source: CoreLogic, May-18
7% New to market, 6% Re-entry
& 1% Other
MEDIAN RESIDENTIAL SALE PRICE
APARTMENTS RESIDENCE SECTION
$
555,000 920,000
$ $
539,000
0.2% from a year ago
0.9% from a year ago 0.8% from a year ago
Source: REINZ, Annual to Mar-18 Source: REINZ, Annual to Mar-18 Source: REINZ, Annual to Mar-18
NEW RESIDENTIAL RESIDENTIAL MARKET AUCKLAND
BUILDING CONSENTS OUTLOOK SURVEY
13 YEAR
HIGH NET POSITIVE
11,629 UNITS 23%
from a year ago
Source: Colliers International Research
Net percentage (optimists minus pessimists) of respondents
Source: Stats NZ, Building consents by region (Annual-Apr) who expect the median price to increase over the next 12 months, Mar-18
NEW SUPPLY: APARTMENTS
PROJECTS CURRENT SUPPLY BREAKDOWN MEDIAN FLOOR AREA*
CBD CITY FRINGE SUBURBAN 97m (2 bdrm)
2
10 Completed Q4-17 AND Q1-18
59% 25% 16% 146m2 (3 bdrm)
75 Under Construction MEDIAN ASKING PRICE*
28 Marketing/Design Stage SUPPLY BREAKDOWN BY 2021
$10,955/m2 (2 bdrm)
CBD CITY FRINGE SUBURBAN
$
11,877/m2 (3 bdrm)
2018F AND 2019F: 4,534 units (57 projects)
2020F AND 2021F: 4,122 units (46 projects) 55% 24% 21% Depending on typology and location
*Average price across all individual developments tracked
All prices include GST and area based on GFA (internal and balcony area)
NEW SUPPLY: TERRACED & DETACHED DWELLINGS
GROWTH AREAS MEDIAN FLOOR AREA* MEDIAN ASKING PRICE*
Hobsonville Point 113m (2 bdrm) 2 $7,462/m2 (2 bdrm)
Manukau
Mount Wellington
162m2 (3 bdrm) $
6,571/m2 (3 bdrm)
Depending on typology and location
*Average price across all individual developments tracked
All prices include GST and area based on GFA (internal and balcony area)
2While more consents were issued in 2017 anticipated supply (of terraced and detached
than for many years, the problematic issues of homes in particular) is at risk of reducing, due
feasibility and affordability remain. If sale prices to an insufficient supply of developable land
are steady and costs go up, then the only variable which can actually be bought at a realistic price,
left to balance the equation is land cost. added to the usual risk factors of infrastructure
availability, construction cost, and bank funding.
Many pieces of land were sold in Auckland in say
2013-2016 at prices which relied on continuing Constant demand doesn’t conjure up an equal
house price inflation, or on a willing land banker number of homes unfortunately, and we expect
to buy the land at an even higher price, or a to see steady pricing as demand continues to
favourable outcome under the Unitary Plan. exceed supply. Deferred starts due to slower
pre-sales are not helping. Sadly, this does
None of these factors are available now. The nothing for first time buyers, and nothing to
consequence is that some land owners can’t sell accelerate building at scale which is urgently
for a profit, nor can they develop at a profit if needed. Innovation is coming, in terms of
the land cost input is the price they paid for it. construction methods, financing and tenure, but
So maybe they will just sit on it, and hope the we will need all of them, plus a fully operative
infrastructure hurries up a bit. Kiwibuild programme to really change the game.
Robust demand ensures that we are not going
to see any dramatic market movements, but the ALAN MCMAHON
urgency to make decisions has reduced. What National Director
may happen in this hiatus period is that the Research and Consulting
Kerepeti, Hobsonville Point,
Auckland
Architect: Context Architects
Developer: Ngai Tahu Property
3New Zealand Residential Market Outlook
Net Percent
New Zealand
-20%
Queenstown
0% 20% 40% 60% 80% 100%
Residential Market
Tauranga/Mt Maunganui
Wellington >> Between December 2016 and December 2017, household debt as a
Hamilton percentage of nominal disposable income increased from 167.3% to 168.1%
Napier/Hastings (RBNZ).
Nelson >> The value of housing stock increased from $1,013.8 billion in December
Auckland 2016 to $1,067.4 billion in December 2017, a 5% increase (RBNZ).
Rotorua
>> New residential mortgage lending to investors dropped to $1,373 million
Whangarei
in March 2018, a 4% decrease from a year ago. Lending to first time buyers
Dunedin
has increased to $911 million in March 2018, 11% increase from a year ago
Palmerston North
(RBNZ).
Christchurch
New Zealand Overall >> Multiple property owners (investors) are buying 38% of all the residential
properties sold, movers 26% and first home buyers 23% (CoreLogic).
Mar-18 Dec-17 Sep-17
>> The annual number of new residential building consents increased from
30,371 (Apr-17) to 32,015 (Apr-18), an increase of 5.4% (Stats NZ).
Source: Colliers International Research
Percent of respondents who expect the median price to increase over the next 12 months. >> The median price for March 2018 is $517,000 (5.1% annual increase) for
apartments, $550,000 (6.0% annual increase) for residences and $253,000
(18.8% annual increase) for sections (REINZ).
>> Queenstown, Tauranga/Mt Maunganui and Wellington are the three
centres where the highest proportion of respondents in our March 2018
Residential Market Outlook Survey expect the median price to increase
Auckland Apartment Supply Timeline over the next 12 months.
4,000 CBD City Fringe Suburban Forecast
3,500
3,000
Auckland
2,500
Residential Market
Number of Units
2,000
1,500
1,000 >> Multiple property owners (investors) are buying 40% of all the residential
500 properties sold, movers 20% and first home buyers 26% (CoreLogic).
0 >> The annual number of new residential building consents increased from
2000
2001
2002
2003
2004
2005
2006
2007
2008
2009
2010
2011
2012
2013
2014
2015
2016
2017
2018F
2019F
2020F
10,226 (Apr-17) to 11,629 (Apr-18), an increase of 13.7% (Stats NZ).
>> The median price for March 2018 is $555,000 (0.9% annual increase) for
Source: Colliers International Research
Note: Only completed and units in the construction, marketing or design phase are included. An
apartments, $920,000 (0.8% annual increase) for residences and $539,000
apartment is classified as a building that has 10 or more residential units stacked horizontally and/or (0.2% annual decrease) for sections (REINZ).
vertically.
>> The mean residential weekly rent in March 2018 is $556 in Auckland, $478
in Franklin, $538 in Manukau, $589 in North Shore, $507 in Papakura, $572
in Rodney and $521 in Waitakere (MBIE). Manukau experienced the largest
annual rental increase.
Auckland Residential Market Outlook >> Since our last report (2H 2017), 688 apartment units (10 projects) have been
completed and 670 apartment units (13 projects) have been announced.
50% Mar-18 Dec-17 Sep-17
>> The total number of apartment units completed in 2018 is likely to reach
40% around 2,254 units (34 projects), with approximately 7,070 more units in
30% 2019, 2020 and 2021 (79 projects).
Net Percent
20% >> In 2018, 31 apartment projects were identified that will not proceed under
10%
original plans. 6 of these sites are currently being re-marketed for sale or
have sold, 10 have been abandoned under current proposals and 15 have
0%
been deferred.
-10%
>> An increasing proportion of respondents to our March 2018 Residential
-20% All Dwellings New Apartment Existing Apartment New Terraced & Existing Terraced &
Detached House Detached House Market Outlook Survey thought median prices in the next 12 months would
increase for new and existing apartments and detached and terraced homes
Source: Colliers International Research
compared to December 2017.
Percent of respondents who expect the median price to increase over the next 12 months.
4Boathouse Bay
Snells Beach, Auckland
Architect: Crosson Architects
Developer: Arabella Lane Limited
For more information contact: Colliers International Research
and Consulting offers a range of
Alan McMahon Pete Evans commercial and residential
National Director | National Director | property solutions:
Research & Consulting Residential Project Marketing
• Property Investment Strategies
Leo Lee Jeff Davidson • Demand & Supply Studies
Research Manager Director |
Residential Project Marketing • Market Analysis & Forecasts
Elena Christodoulou • Feasibility Analysis
Research Analyst
Colliers International • GIS Spatial Analysis
Josh Lee Level 27, SAP Tower • Catchment Analysis
Research Co-ordinator 151 Queen St,
• Lease Audit & Benchmarking
Auckland
+64 9 358 1888 • Site Options Analysis
• Corporate Real Estate Strategy
• Financial Analysis
• Business Cases
Whilst all care has been taken to provide reasonably accurate information within this report, Colliers International cannot guarantee
the validity of all data and information utilised in preparing this research. Accordingly Colliers International New Zealand limited, do
not make any representation of warranty, expressed or implied, as to the accuracy or completeness of the content contained herein
and no legal liability is to be assumed or implied with respect thereto.
© All content is Copyright Colliers International New Zealand Limited 2018 (Licensed REAA 2008) and may not be reproduced without
expressed permission. Licensed REAA 2008You can also read