Atlanta: 1Q2021 Housing Market Analysis - May 2021 - St. Bourke
←
→
Page content transcription
If your browser does not render page correctly, please read the page content below
Atlanta: 1Q2021
Housing Market Analysis

May 2021
Atlanta Housing Market Analysis
Atlanta’s recovery remained relatively steady through 1Q2021, posting crucial gains in employment (+60% jobs
recovered to-date) and announcing major office expansions by several Fortune 500 companies. One of the brightest
spots in Atlanta’s recovery thus far has been the housing market, which has built on the momentum established in the
second half of 2020 and posted strong numbers so far in 2021.
Atlanta’s housing market is being driven by the following factors:
• Low interest rates. While 30-year fixed mortgage rates have crept up slightly from lows established in 2020, they
remain at historically low levels and currently hover just above 3%. Potential buyers have flooded the market in the
last 6-9 months in an effort to lock in a low rate for the life of their loan, and the slight increase in the rate since
the beginning of 2021 has reinvigorated the “act now before it’s too late” mentality for many potential buyers.
• Inventory shortages. Atlanta is experiencing critical shortages across the board – we don’t have enough finished
lots, we don’t have enough finished new homes, and we don’t have enough existing homes on the market. These
shortages have contributed to Atlanta’s “buying frenzy” and caused both land and home prices to skyrocket over
the last 6 months.
• Increased home prices. Decreased supply and increased demand have (unsurprisingly) put upward pressure on
both new and existing home prices. The median sale price for a home in Atlanta increased to $330,000 in 1Q2021,
a +15.8% increase since 1Q2020. The sharp increase in prices over a relatively short period is raising concerns
around affordability, especially given that wages and income have hardly moved over that same period.
• Supply chain and materials costs increases. Builders have reported significant issues with their supply chains
and materials pricing, especially in regards to softwood lumber. Lumber prices have soared nearly 300% in the last
12 months, which is adding an estimated $36,000 to the base cost of the average single-family home. Additionally,
construction timeframes are being extended as builders are reporting issues securing everything from appliances
to doors and windows.
We’ve provided a comprehensive overview of some of Atlanta’s most critical housing metrics in the sections below:
Mortgage Rates
30-year mortgage rates hit an all-time low in 2020 after the Federal Reserve slashed the Fed Funds Rate to zero in
response to the onset of the pandemic. No rate increases are expected from the Federal Reserve until 2022, however
interest rates have increased steadily since the beginning of 2021 and currently stand around 3.17%. We expect interest
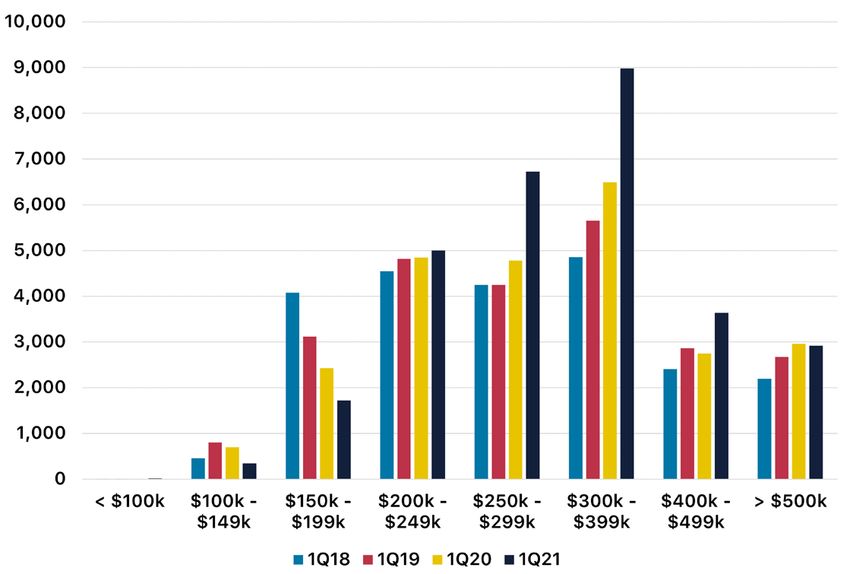
rates to remain near historic lows (below 4%) for the remainder of 2021.Active Listings Active Listings: Total Active Listings: Months’ Supply The number of active listings in Metro Atlanta dropped -37% in the last 12 months with just over 7,400 homes on the market at the end of 1Q2021. Active listings have decreased for 8 straight months as fewer existing owners are listing their homes for sale due to increased economic instability related to the pandemic, and low interest rates are making it more attractive to refinance than move for some potential sellers. Supply levels at the end of 1Q2021 were critically low with just over 1 month’s supply of activity listings, down -52% from 1Q2020. “Normal” supply in a healthy market is considered 6-8 months. Housing Starts Housing Starts: Total Housing Starts: By Price Range Annualized housing starts jumped dramatically from For more than a decade, the majority of housing starts in 1Q2020 to 1Q2021 with single-family detached (SFD) Atlanta fell into the $200k - $250k range. In recent years starts increasing by +16.2% and single-family attached we have seen that trend shift into the upper $200’s, and (SFA) starts increasing by +28.9% over the last 12 months. now the $300k price segment is officially dominating Annual growth for SFD starts has not increased at this rate starts. Higher prices are great for builders, although since 1Q2016 and is being suppressed only by a critical much of these price increases are due to higher land and shortage of viable lots. Attached housing starts continue materials costs, but are troublesome for potential buyers. to make significant gains as they present opportunities for With a median household income of just over $55,000, builders to achieve higher densities and offer product at the majority of housing starts now present homes that the price points more affordable for the average buyer. median income earner in Atlanta cannot afford.
New Home Closings
New Home Closings: Total                                      New Home Closings: By Price Range

New home closings increased in line with starts -             As we have seen with starts, new home pricing trends are
annualized SFD closings rose +13.3% and SFA closings          increasing at an accelerated rate. Annualized closings in
grew a whopping +34.9% over the last 12 months. Both          1Q2021 grew for every price segment except the < $200k
SFD and SFA closings would likely have been even              and > $500k segments, however the $250k - $299k and
higher if not hampered by low inventory and elongated         $300k - $399k price segments continue to account for
construction times. Demand for new SFD and SFA homes          the majority of growth. Annualized closings in the $250k
remains extremely high, but closings in 2021 will likely be   - $299k range increased +22.9% over the last 12 months
constrained simply because there won’t be as many new         while closings in the $300k - $399k range increased a
homes available to purchase.                                  staggering +30.6% over the same time period.

Lot Deliveries
Lot Deliveries: Total                                         Lots in Development

Both SFD and SFA lot deliveries were fairly consistent        As shown above, a large majority of future lots (83%) are
year-over-year, only increasing by +0.6% and +1.6%,           considered dormant, meaning that while those lots have
respectively, over the last 12 months. The reduced growth     been planned for future development, no activity has
rate can be attributed to decreased lot production in         occurred in the last 2 years. Of the lots in development,
2Q and 3Q2020 due to uncertainty brought on by the            40% are engaged in predevelopment work, 40% are in
pandemic. Deliveries picked up significantly in 4Q2020,       the excavation phase, and 20% have advanced to road
however, increasing by +88% in the last 3 months of the       construction. Of the 28,000 lots currently in development,
year. Deliveries remained elevated in 1Q2021, and 21,000      21,000 are expected to deliver this year.
new lots are expected to be delivered in 2021.
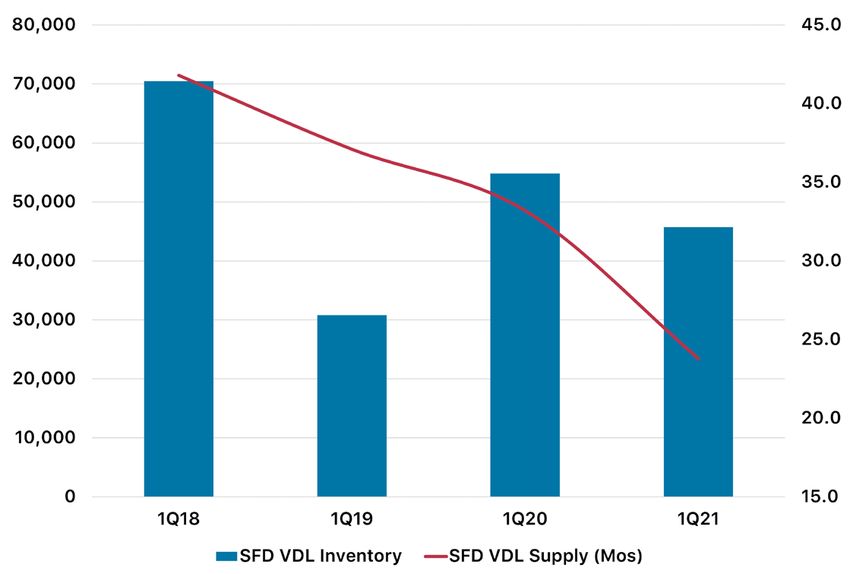
Inventory & Supply
Inventory & Supply: SFD                                      Inventory & Supply: SFA

SFD VDL inventory declined -16.6% since the end of           SFA VDL inventory decreased by -7.1% over the last 12
1Q2020, and there are just under 46,000 VDLs in the          months, resulting in an 18.4 months’ supply of finished
market. When you consider that approximately 25% of          attached lots. When you apply the 25% “junk” lot
Atlanta’s VDLs are considered “junk” lots (no construction   reduction, actual inventory stands just below 8,100 lots
activity for 2+ years), the actual supply of VDLs drops      and supply drops to just 14.1 months.
from 23.8 months to 18.3 months.

Market Leaders
Annual Growth: Starts                                        Annual Growth: Closings

It’s not surprising to see Gwinnett County lead the Metro    As with starts, Gwinnett County led the Metro in new
in starts growth over the last 12 months (+786 starts,       home closings growth over the last 12 months (+1,010
+23.6% YoY). The rest of the top five leaders in starts      closings, +34.4% YoY). With the exception of Cobb,
growth, however, may not be what you were expecting.         more “secondary” submarket counties round out the
Hall, Forsyth, Paulding, and Newton counties, once           top five with closings in Hall and Newton counties both
considered “secondary” submarkets, rounded out the           increasing by more than +60% since 1Q2020. These
top five and saw a cumulative +38.8% increase in housing     counties farther from Atlanta’s urban core generally have
starts since 1Q2020. Given the critically low VDL supply,    a higher availability of lots/land and more opportunities
builders have had to shift their focus to farther suburbs    for buyers to purchase homes at affordable price points
that have historically seen lower levels of activity.        when compared to projects closer to the city center.
Annual Growth: Lot Deliveries                                 Top Submarkets by Price Range

Cherokee County leads the Metro area’s effort to increase     Looking even deeper than county level, the most popular
lot development, increasing lot deliveries by +67.9% over     price point and submarket over the last 12 months was
the last 12 months (+932 more lots). South Fulton County      South Atlanta (South Fulton County) and the
As with starts and closings, we are seeing
more activity in farther suburbs than ever
before. Only two of the top ten communities
are located within 25 miles of Downtown
with another five submarkets on the list are
located more than 35 miles from Downtown.
The strength of the WFM movement and
decreased commutes have encouraged
buyers to look in areas farther from
Downtown than they may have normally
entertained. When coupled with (generally)
more affordable prices, these once-
overlooked suburbs are quickly becoming
the future of residential construction in the
Atlanta market.

Three of the top ten communities have
less than a 12-month supply of lots in the
pipeline, a good indication that they will
likely reach full build-out by the end of the
year.

Leading Builders

Builder                                         1Q21 Closings   Annual Closings      YoY Growth (Annual Closings)

DR Horton*                                          980              3,702                       + 21.5%

Lennar                                              343              1,576                        + 2.4%

Century Communities                                 423              1,475                       + 42.2%

Smith Douglas Communities                           244               820                        + 18.2%

Chafin Communities                                  220               819                        + 14.7%

Meritage Homes                                         112            657                        + 16.9%

Knight Homes                                           34             577                         + 9.7%

Starlight Homes / Ashton Woods                       161              577                        - 30.8%

LGI Homes                                              98             571                         + 5.2%

Taylor Morrison Homes                                114              569                         + 9.2%

* Combined total between all DR Horton product lines

DR Horton continues to lead active homebuilders in Atlanta, selling nearly 1,000 homes in 1Q2021 and eclipsing 3,700
in annualized sales. A +21.5% increase in closings in the last year has further cemented DR Horton’s grip on the Atlanta
market, and they currently sell as many new homes per year as they next three builders combined. Nine of the ten
homebuilders on this list increased their closing volume over the last 12 months, with seven of those nine increasing
by double-digit percentages. Century Communities posted the largest year-over-year growth, increasing closings by
+42.2% since the end of 1Q2020.
Conclusion
There is a lot to be excited about in regards to Atlanta’s housing market: interest rates will likely remain near historic
lows through the end of the year, builders across the board are increasing production of both lots and new homes,
and for-sale listings are finally starting to creep back to normal levels which should work to relieve growing concerns
around price. More people are returning to work, and the elimination of all pandemic-related restrictions around public
gatherings, namely sports and entertainment events, should reinvigorate the lagging Leisure & Hospitality industry
(still down 53,000 jobs [-17.6%] compared to February 2020).

Despite receiving (almost) nothing but good news about the economic recovery and housing market over the last 6-9
months, we cannot ignore the headwinds that will have an increasingly negative impact on the housing market as we
head into the summer:

•   Lot shortages. Atlanta’s critical undersupply of viable lots will have an increasing impact on housing starts and
    closings as they relate to both location and volume. Low supply is driving land prices (and therefore home prices)
    up at an accelerated rate, and builders are turning their attention to farther suburbs in part to secure land at a
    price point that works for their product.

•   Construction delays and costs. Labor shortages and supply chain disruptions have significantly extended
    construction times for homebuilders, who have reported issues securing everything from kitchen appliances to
    bathroom fixtures to windows. Exacerbating these issues is the exorbitant price of softwood lumber, which is
    adding more than $36,000 in construction costs for the average single-family home. In many cases, builders are
    intentionally limiting their sales and construction pipelines in hopes that supply chains and pricing issues will ease
    as the vaccination rate increases and we look to return to a true “normal.”

•   Home prices and affordability. Shortages of both lots and homes have combined with pent-up, pandemic-
    accelerated demand to create a perfect storm for increased pricing. Limited lot supply, increased construction
    costs, and increased demand have pushed the median home price up nearly +16% in the last 12 months, which
    disproportionately impacts the two largest homebuyer segments – first-time homebuyers and first move-up
    homebuyers. Both land and home pricing will continue to trend upward at an accelerated rate until supply levels
    are more in line with current demand levels.

    For information about market research & reporting, including custom market reports,
                     please contact Katie Fidler at katief@stbourke.com.
You can also read