Prospects for Natural Graphite Flake Markets - Tirupati Graphite November 2018 Consultancy & Special Projects Director + ...

Page created by Francisco Sparks
 
CONTINUE READING
Prospects for Natural Graphite Flake Markets - Tirupati Graphite November 2018 Consultancy & Special Projects Director + ...
Prospects for Natural Graphite
Flake Markets

Tirupati Graphite
November 2018

Blevich@fastmarkets.com
Consultancy & Special Projects Director
+ 44 207 556 6020
Prospects for Natural Graphite Flake Markets - Tirupati Graphite November 2018 Consultancy & Special Projects Director + ...
Introduction

                     BrIan Levich, Consultancy & Special                     • Tirupati Grpahtie plc l has engaged Fastmarkets (formerly Metal Bulletin Group”), the
                     Projects Director                                         independent research and consultancy arm of Fastmarkets, part of Euromoney
                                                                               Institutional Investor PLC, registered in the United Kingdom, to receive a study on the
                                                                               prospects of the natural graphite market

                     blevich@fastmarkets.com                                 • Feel free to contact me about any aspect of this report, or for any additional
                     +44 (0) 207 556 6020                                      information requirements you may need to further support you and your teams

 Disclaimer

 Prices and other information contained in this repot have been obtained by us from various sources believed to be reliable. This information has not been independently verified by
 us. Those prices and price indices that are evaluated or calculated by us represent an approximate evaluation of current levels based upon dealings (if any) that may have been
 disclosed prior to publication to us. Such prices are collated through regular contact with producers, traders, dealers, brokers and purchasers although not all market segments may
 be contacted prior to the evaluation, calculation, or publication of any specific price or index. Actual transaction prices will reflect quantities, grades and qualities, credit terms, and
 many other parameters. The prices are in no sense comparable to the quoted prices of commodities in which a formal futures market exists. This document is for information
 purposes only. Whilst every effort has been made to ensure that the information is correct and that the views are sound, Fastmarkets. cannot be made liable for any loss no matter
 how it may arise.
                                                                                                                                                                                                2
Prospects for Natural Graphite Flake Markets - Tirupati Graphite November 2018 Consultancy & Special Projects Director + ...
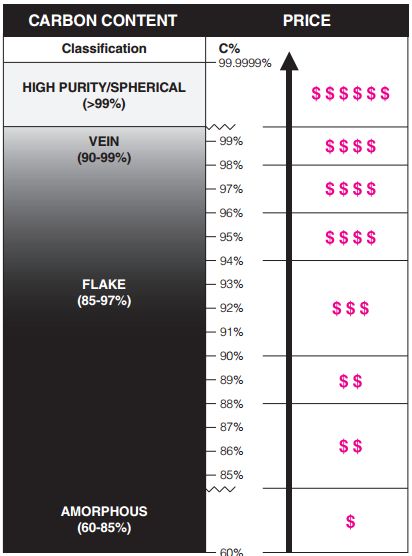
Built on a foundation of trust and reliability from the companies
that have been brought together over the years, Fastmarkets will
continue to grow and evolve with the markets. Continuing the history
of rich and robust methodologies, deep connections in the market and
revolutionizing technology solutions – we are committed to providing
prices and market insights that allow you to master your markets.
Prospects for Natural Graphite Flake Markets - Tirupati Graphite November 2018 Consultancy & Special Projects Director + ...
“Our aim is to provide the
world’s leading
and most trusted price
reporting, events &
intelligence service for the
markets that we serve”
.

                               4
Global Economic Outlook

          GLOBAL GDP (% CHANGE)          CHINESE QUARTERLY GDP (% CHANGE)                        GLOBAL GDP OUTLOOK
 5%                                  7.5%                                           3.5%
 4%                                  7.0%                                           3.0%
 3%                                                                                 2.5%
 2%                                  6.5%                                           2.0%
 1%                                  6.0%                                           1.5%
 0%
                                                                                    1.0%
-1%                                  5.5%
                                                                                    0.5%
-2%
                                     5.0%                                           0.0%
-3%

 Global output expanding with all         Chinese economy rallied in 2016/17 on         2018 may be peak
  regions positive                          stimulus
                                                                                          Rising US interest rates in 2018
 Remains below rate seen prior to         Turned down in Q2 2018
                                                                                          End of QE in Europe and Japan
  financial crisis
                                           Outlook is for further weakness
                                                                                          Slowing Chinese growth
 Asia is fastest-growing region
                                           On-going shift to consumption from
                                                                                          Higher oil prices will choke
 Recovery in Latin America & CIS           capital investment and reduction in
                                                                                           consumption
                                            debt risk
 Acceleration in North America &
  Europe                                   Government could potentially re-
                                            stimulate
                                                                                                                              5
Economic outlook – Our key assumptions

     Steel output is correlated to economic growth     Global GDP not returning to +4% growth                                RISKS

                                                                                                              •Decade of monetary easing coming to
                                                                                                                            an end

                                                                                                              •Global debt now at higher levels than
                                                      3.5%
                                                                                                                              2008
                                                      3.0%
                                                      2.5%
                                                                                                                •Surging US economy leading to
                                                      2.0%
                                                                                                                        strong US dollar
                                                      1.5%
                                                      1.0%
                                                      0.5%
                                                                                                                 •Rising risks of emerging market
                                                      0.0%
                                                                                                                   currency crisis due to excess
                                                                                                                            offshore debt

                                                                                                               •Tightening credit cycle in mature &
                                                                                                                        emerging markets

                                                                                                              •China slowing, but remains robust for
                                                                                                                 now, but potential excess debt

                                                                                                                           •Trade war
 The expansion is becoming less even, and risks to the outlook are mounting. The rate of expansion appears
  to have peaked in some major economies and growth has become less synchronized

                                                                                                                                                    6
Global natural flake graphite consumption trends

 • Demand for natural graphite has
   historically been driven by the
   refractory, foundry and crucible sector.

 • Refractory, foundry and crucible
   demand accounts for approximately
   46% of global demand for natural
   graphite. The refractory industry drives
                                                                       7%             CAGR
   the majority of this demand, whilst the                             Global expandable graphite market
   foundry and crucible sectors consume                                growth between 2017-2022
   smaller volumes of higher purity
   graphite products.

  Graphite price historically driven by
  steel and industrial applications;
  now and in future more by battery &
                                                                       32% CAGR
                                                                       Global batteries market growth between
  other high growth sector demand
                                                                       2017-2022

  • The battery sector is comparatively small
    but rapidly growing. In 2017, we estimate
    that the battery sector accounted for 13%
    of overall global consumption of natural
    graphite.                                   ~1.2m tonnes in 2018
  • As of 2017, less than 50% of graphite
    consumed was within batteries for EVs.
    This is forecast to change in the coming
    years.                                                                                                 7
Demand for graphite is expected to experience an unprecedented growth
elsewhere

                                                 Large Flake 20 – 80 mesh   Medium Flake 80 – 150 mesh   Small Flake 100 mesh to Micronised

 Over 150                                        Reactory
                                                 Bottm Plates
                                                 Gaskets and Seals

 graphite                                        Flame Retardants
                                                 Thermal sheets
                                                                            Basic Refractory:

                                                                            Magnesia Carbon
                                                                                                         Paintings & Coatings

                                                                                                         Pencils
                                                                            Alumina Carbon
 applications                                    Fuel cells
                                                 Plugging Agents
                                                                            Unshaped Refractory
                                                                                                         Dry & Ni MH Batteries

                                                                                                         Lubrication
                                                                            Flame Retardants
                                                 Expandable Graphite
                                                                                                         Friction Materials
                                                 Thermal Management
                                                                                                         Composites
Basic graphite properties related to the
applications:                                                                                            Li-ion Batteries

• High electrical and thermal conductivity                                                               Aviation & Space Technology
• Insertion chemistry (intercalation)
• Chemical stability under acidic and alkaline                                                           Nuclear Technology
conditions, inertness
• Lubricity
• Low weight
• Price / performance ratio                               Sectors = High growth, over 7% CAGR projected
Graphite’s value chain

                        Mining
                       - Excavation   Ore
                        - Transport
Value Added Products
Natural graphite demand by end-user applications
out to 2027

                                                               Given the rapid increases in EV and
                                                               storage facilities projected globally
                                                               the global demand share of
                                                               graphite in this sector will
                                                               substantially rise from a 13% share
                                                               in 2017 to 56% by 2027

                                                               Graphite will keep it’s position as
                                                               main anode material for many years
  Total natural graphite
  consumption in 2017
  reached over 1.1m
  tonnes…

                                    … and will reach over to
                                    over 2.8m tonnes by 2027

                                                                                              10
Demand for EV Lib batteries

                                       84,000 tonnes
    NATURAL SPHERICAL                                                                  SYNTHETIC

                                              47:53 %
                                        China accounts ~45% of
     39,719                                                                                   44,076                 2018
                                        global graphite demand in
    (= 99,000
    tonnes                              lithium-ion batteries but
    flake)                              will be >50% in 2025

                  Disadvantages         Due to performance and      Disadvantages
                                         price issues, the ratio
   186,500        • High Yield Loss
                                          between natural and       • More costly & energy-                          2022
                                          synthetic graphite is       intensive vs Natural
  (= 466,000      • Complicated
                                         expected to be around      • Lower Capacity vs
                                                                                              188,000
  tonnes flake)     Production
                                             50:50 by 2022            Natural

                                              50:50 %
                                                                                                 73% supplied by
  100% supplied                                                                                  China, 15% Japan,
  by China                            374,515 tonnes                                             12% Other
New Natural Graphite Flake Projects

Significant increases in supply are expected from ex-China countries, such    •   New projects take a long time to come to market
as Mozambique, Madagascar, Guinea and Brazil, with substantial new
graphite production facilities planned. However, there are challenges:                     o Bringing a new mine into production takes time and requires significant
                                                                                             technical knowledge to meeting the increasing complexities of
•   Increasingly high market entry barriers                                                  consumer requirements. A unique skill set is required for value-added
                                                                                             grades
             o High market entry barriers exist, particularly increasing in
               high growth, value-adding processing applications e.g. Lib,
               expandables, composites etc.                                              > 2.5 YEARS +              >1 YEAR +                18-24 MONTHS +

             o Syrah Resources’ Balama flake graphite mine in
               Mozambique that came online in October 2017. The                                                       REACHING THE
               company missed its production target for the first half of                 FINANCING                     CORRECT                    QUALIFICATION
               2018 and has since reduced its output guidance for 2018                                               SPECIFICIATIONS
               from 160,000 tonnes to 101,000-106,000 tonnes
                                                                                                                    > 5 YEARS
•   Limited graphite projects in the pipeline
    (at least short-term)
                                                                              Undoubtedly, there is a real market need for reliable and secure high quality graphite
                                                                              suppliers outside China there are supply-side challenges
             o No new projects are expected to come on stream in 2019
               except Tirupati Graphite in Q1 2019 with 9,000 tonnes and          • Strong cost pressures from car OEM’s but no compromise in quality
               additional 18,000 tin Q4 2019 to total 27,000 tonnes               • Material consistency & logistical issues mean lengthy output ramp up’s.
                                                                                  • Financing/mining lease/sovereign risk issues (particularly affecting African-
                                                                                    based operations)
                                                                                  • Lengthy process to build trust and end-user customer base as product samples
                                                                                    are insufficient
                                                                                  • Not all flake graphite deposits are created equal to meet required market
                                                                                    demand
Key supply-side market conclusions
                                                                    •   In 2016, China accounted for approximately 60% of natural graphite production,
                                                                        however environmental restrictions have reduced graphite production.. It will
                                                                        remain the largest producer of natural graphite, ~ 750,000 tpy, however increases
 Natural Graphite Supply, 2017 - 2025                                   in supply from other countries will mean China’s dominance will reduce over the
                                                                        next 5 years. In the production of spherical graphite, for use in battery anodes,
                                                                        China will continue to control the majority of the processing and production.
 100%
                                                                        However, Chinese mines reportedly lack significant large and jumbo flake graphite
                                                                        therefore creating a market opportunity for any new large flake size producers.

 80%
                                                                    •   Any new project to come to market and survive will have to meet following
                                                                        key criteria in today's demand environment

                                                                            • Low stripping ratio
 60%                                                                        • Resources / reserves for > 10 years (> 10 Mt)
                                                                            • High yield of highest-quality marketable products
                                                                            (> 94% Carbon, >75 micron)
 40%                                                                        • Favourable jurisdiction and logistics
                                                                            • Low operating costs
                                                                            • Short timeframe to production (< 2 years)
                                                                            • Offtake (sales) agreements in place
 20%
                                                                            • Experienced management with strong understanding of graphite markets

                                                                    •   This means not all the ~1.3m tpy planned new graphite supply projects will
  0%
                     2017                          2025
                                                                        come to fruition. We expect start-up’s to take up more of a modular
                                                                        approach to supply increases over the forecast period accordingly.
        China   Mozambique     Brazil   Sweden   Tanzania   Other
                                                                    •   We expect significant global production deficits emerging particularly in large
                                                                        flake and battery application areas, thereby providing upward pressure on
                                                                        market prices.
Graphite Price Outlook
Price analysis & forecasts

Flake graphite prices are dictated by three factors:

Carbon purity:
Flake graphite concentrate with a greater carbon purity receive a premium price because they require less processing to remove disruptive impurities. A carbon content of 90% C and above
is generally required in all refractory, foundry and crucible applications. The most common grade used in refractory applications is around 92% C, but some major producers will demand a
purity of up to 96% C to ensure the integrity of their products. The price of grades
Natural Flake Price Forecasts by size/purity

Grade                                             CIF Europe
Mesh Size      Carbon   2017    2018    2019    2020    2021    2022    2023    2024    2025

+32Mesh         92      1,932   2,070   2,174   2,282   2,378   2,478   2,582   2,690   2,803
+32Mesh         94      2,100   2,210   2,323   2,441   2,551   2,666   2,786   2,911   3,042

                                                                                                                                                       7%
+32Mesh         95      2,150   2,270   2,406   2,551   2,699   2,855   3,021   3,196   3,381
+32Mesh         96      2,200   2,360   2,549   2,753   2,962   3,187   3,429   3,690   3,970
+32Mesh

+48Mesh
                97

                92
                        2,350

                        1,564
                                2,470

                                1,670
                                        2,668

                                        1,770
                                                2,881

                                                1,876
                                                        3,111

                                                        1,980
                                                                3,360

                                                                2,088
                                                                        3,629

                                                                        2,203
                                                                                3,920

                                                                                2,325
                                                                                        4,233

                                                                                        2,452
                                                                                                                                                                      CAGR
+48Mesh         94      1,700   1,810   1,919   2,034   2,146   2,264   2,388   2,519   2,658
+48Mesh         95      1,750   1,855   1,985   2,124   2,251   2,386   2,529   2,681   2,842
+48Mesh         96      1,800   1,915   2,049   2,192   2,346   2,510   2,686   2,874   3,075
+48Mesh         97      1,850   1,970   2,128   2,298   2,482   2,680   2,895   3,126   3,376

+80Mesh         92      741      900     927     955     983    1,013   1,043   1,075   1,107
+80Mesh         94      790      960    1,008   1,058   1,111   1,167   1,225   1,286   1,351
+80Mesh         95      820     1,030   1,102   1,179   1,262   1,350   1,445   1,546   1,654
+80Mesh         96      880     1,150   1,242   1,341   1,449   1,565   1,690   1,825   1,971
+80Mesh         97      900     1,250   1,363   1,485   1,619   1,764   1,923   2,096   2,285

+100 -80Mesh    92       808     850     893     901     906     910     915     920     924
+100 -80Mesh    94       878     920     929     938     943     948     953     957     962
+100 -80Mesh
+100 -80Mesh
                95
                96
                         976
                         969
                                 960
                                 970
                                         979
                                         999
                                                 999
                                                1,029
                                                        1,009
                                                        1,060
                                                                1,019
                                                                1,086
                                                                        1,029
                                                                        1,114
                                                                                1,039
                                                                                1,141
                                                                                        1,050
                                                                                        1,170
                                                                                                • Strong CAGR price growth in high purity and large flake
+100 -80Mesh    97      1,040   1,065   1,097   1,130   1,164   1,193   1,223   1,253   1,285     distribution particularly.
+200Mesh        92      745     800     816      832     849     866     883     901     919
+200Mesh        94      810     830     847      864     881     898     916     935     953    • Synthetic graphite commands a significant premium to natural
+200Mesh        95      803     845     862      879     897     915     933     952     971      flake graphite, given it’s a man-made, environmentally damaging
+200Mesh        96      847     870     887      905     923     942     961     980     999
+200Mesh        97      950     970     989     1,009   1,029   1,050   1,071   1,092   1,114
                                                                                                  and high energy intensive product.

-200Mesh        92      386     550     532     510     485     455     435     415     400     • This will act as a significant advantage to natural flake
-200Mesh        94      420     570     576     551     522     489     463     443     429
-200Mesh        95      400     470     549     520     498     482     467     447     437       consumption levels and help support natural flake prices over the
-200Mesh        96      450     570     641     634     621     588     576     552     534       forecast period.
-200Mesh        97      500     635     692     685     670     635     622     596     577
Contact

PRODUCED BY FASTMARKETS

8 Bouverie Street | London | EC4Y 8AX | United Kingdom

Copyright © Euromoney Global Limited. All rights reserved.

EMAIL
Blevich@fastmarkets.com

TELEPHONE
+ 44 (0) 207 556 6020
You can also read