Market Demand. Forecasting Changes. Policy Solutions - Demanda de Mercado. Cambios de Previsión. Soluciones de Política.
←
→
Page content transcription
If your browser does not render page correctly, please read the page content below
Market Demand. Forecasting Changes. Policy Solutions
Demanda de Mercado. Cambios de Previsión. Soluciones de Política.

Market Demand. Forecasting Changes. Policy Solutions
Demanda de Mercado. Cambios de Previsión. Soluciones de Política.
Moderator: Mollie Fitzpatrick, Managing Director and Co-Founder, Root Policy
Research
Confirmed speakers:
• Cindy DeGroen - Demographer, Department of Local Affairs
• Cheryl Young, Senior Economist, Trulia
• Celia Smoot, Director of Housing, LISC
• Jennifer Steffel Johnson, Instructor and Associate Chair, University of Colorado
Denver College of Architecture and Planning
Population and Economic
  Transitions for the
 Colorado Front Range
                   2019
              Cindy DeGroen
         State Demography Office
   Colorado Department of Local Affairs
      Demography.dola.colorado.gov
Primary Trends
• Recent Concentrated Growth – 95% along Front
  Range.
• Migration – Job related, young, educated, lower
  income.
• Aging – 65+ and 85+ fastest growing age groups.
• Increasing racial and ethnic diversity.
• Population growth (but slowing) – slowing births,
  increasing deaths, slowing international migration.

Big Picture – 2017-2018 Pop Change
• US – 327.2 million, + 2.02 million or .6%
• Colorado - 5,695,564
• Ranked 7th fastest 1.4% - NV, ID, UT, AZ, FL, WA
• 8th in total growth 79,662 – TX, FL, CA, AZ, NC,
  WA, GA
• Range in Colorado by county (2016-17)
        •   +12,000 to -470
Components of Population Change 1970‐2018
140,000
                                                                   Natural Increase                   Net Migration

120,000

100,000

 80,000

 60,000

 40,000

 20,000

     ‐

(20,000)

(40,000)
           1970
                  1972
                         1974
                                1976
                                       1978
                                              1980
                                                     1982
                                                            1984
                                                                   1986
                                                                          1988
                                                                                 1990
                                                                                        1992
                                                                                               1994
                                                                                                       1996
                                                                                                              1998
                                                                                                                     2000
                                                                                                                            2002
                                                                                                                                   2004
                                                                                                                                          2006
                                                                                                                                                 2008
                                                                                                                                                        2010
                                                                                                                                                               2012
                                                                                                                                                                      2014
                                                                                                                                                                             2016
                                                                                                                                                                                    *2018
Colorado

Age

AGE MATTERS
Why?
Preferences
Housing
Income
Service Demands
Labor Force
Where do we grow from
        here?
0%
State – 2.4M
Front Range – 2M
Denver Metro – 1M
North FR – 600K
South FR – 400K
Rest of State – 400K
Thank you

  State Demography Office
 Department of Local Affairs
       Cindy DeGroen
 Cindy.degroen@state.co.us
        303-864-7752
Demography.dola.colorado.gov
Denver Housing Trends
Denver Housing Forum
April 19, 2019
Cheryl Young,
Senior Economist
Trulia3.3% 26.9k 3.4%
Denver: Denver: Number of Mountain States:
Unemployment non-farm jobs Wage growth in
rate, February created from December 2018.
2019. January 2018 to
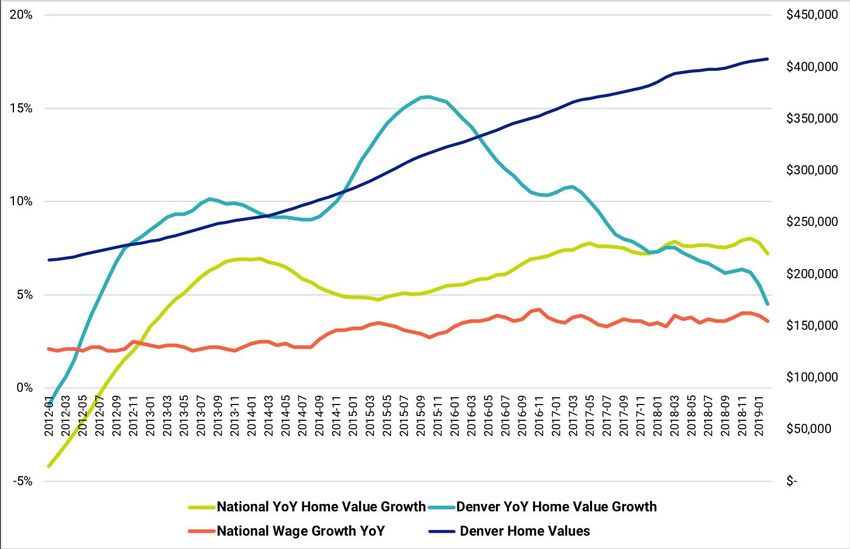
January 2019.Denver home values rose over 90% since 2012
Source: TruliaDenver home value growth outpaced national rates
Source: TruliaHome value growth has outpaced wage growth
Source: Trulia and Atlanta Federal ReserveHomes sales are slowing nationally
Source: National Association of RealtorsMeanwhile, in Denver...
Average number of days a Annual increase in number of
74 listing stayed on the market
until it sold in Denver 25.4% days a listing stayed on the
market until it sold in Denver
(Jan 2019). (Jan 2018-Jan 2019).
Share of listings on the Percentage point increase in
13.8% market that experienced
a price cut in Denver 5.6 share of listings with at least
one price cut in Denver
(Feb 2019). (Feb 2018 - Feb 2019).
Source: TruliaInventory is bouncing back in Denver
Source: TruliaInventory recovering in starter and trade-up segments
Source: TruliaNew home permits in Denver above pre-recession average
Source: U.S. Census BureauAffordability worsening, especially for starter-home buyers
Source: TruliaMany continue to struggle to afford homes in Denver
First Responders Teachers Restaurant Workers
Median
wage $75,140 $54,403 $22,320
% of
affordable 18.6% 5.06% 0.16%
homes
Median List Price: $529,000
Source: Trulia and BLSTakeaways
● The housing market is slowing despite strong national
and regional economies
● The slowdown in housing may be welcome news for
some Denver home buyers
● Affordability issues continue to worsen for
starter/first-time home buyers and other members of
the communityThank you! Please visit us at: www.trulia.com/research
About LISC
About LISC

LISC is an
investor, capacity
builder, convener
and innovator.       Pool public and private dollars           Work with local partners                 Support people and places

                     We raise funds from philanthropies,       Through a network of local offices       By investing in housing, businesses,
                     corporations and financial firms,         and community-based partners             jobs, schools, public spaces, safety,
                     federal, state and local                  across the country, we provide           youth, health centers, grocery stores
                     governments and through the               grants, loans, equity and technical      and more, we catalyze opportunities
                     capital markets.                          assistance.
                                                                                                        in communities nationwide.
                     We also generate income from              We also lead advocacy efforts on
                     consulting, and lending services.         local, regional and national policy.

                               Offices in 33 cities and work in hundreds of rural communities across the country.

                                                                                                                                 2
Since 1979
$18.6 billion invested
$56.2 billion leveraged
376,000 homes 63 million square feet $287 million S&P ‘AA’ Rating
Affordable homes built and/or Square feet of commercial, retail Total Net Assets LISC is the first CDFI to tap the
and community space, including: general obligation bond market,
preserved including:
• Early childhood centers • Net worth has increased 48% in with a $100 million issuance in
the past 4 years 2017
• Multifamily rental
• Schools
• Closed on more than $1.6 billion
• Supportive housing for special • Fields/recreational spaces of debt transactions
populations such as chronically
homeless, LGBTQ, seniors and • Healthcare centers • Raised an average of $123
veterans million annually in grants over
• Grocery stores
the past 3 years
• Affordable homeownership • Financial Opportunity Centers
We also emphasize sustainability
through green, healthy housing and
transit oriented development.
3Rental Housing Affordability
Federal Subsidy
Workforce LIHTC
Program
• 80%-120% AMI • 60% AMI and • 30% AMI and
below below
• There is a shortage of affordable housing across all income bands and projections are
clear that the need will continue to grow.
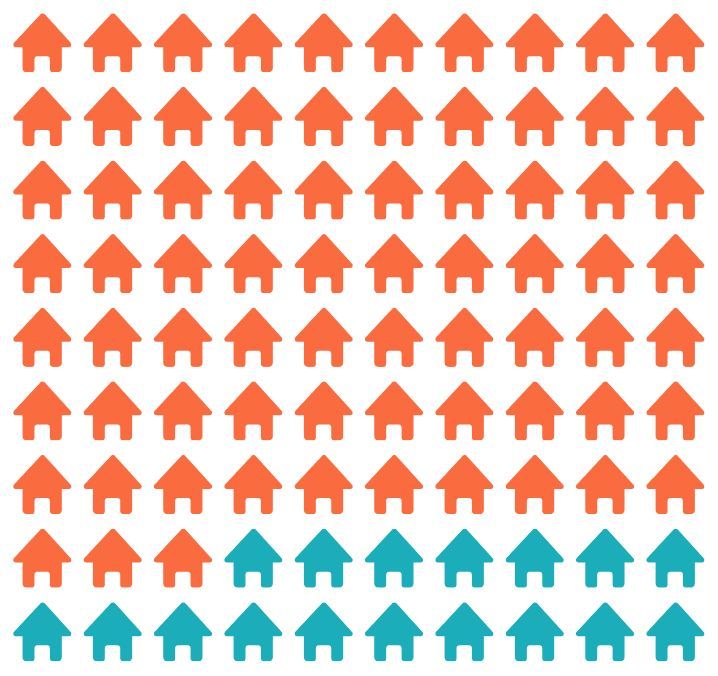
• Need is especially acute for extremely low‐income renters, whose household incomes
are at or below the poverty guideline or 30% of their area median income. Only 37
affordable and available rental homes exist for every 100 extremely low‐income renter
households. Extremely low‐income renters face a shortage in every state and major
metropolitan area, including Denver.
• There are no dedicated affordable housing resources for the Missing Middle, families
that fall outside of the LIHTC eligibility but still meet the definition of low income (AMI
between 80% and 60%).
• Solutions must be based on sustainable subsidy mechanisms while paired with
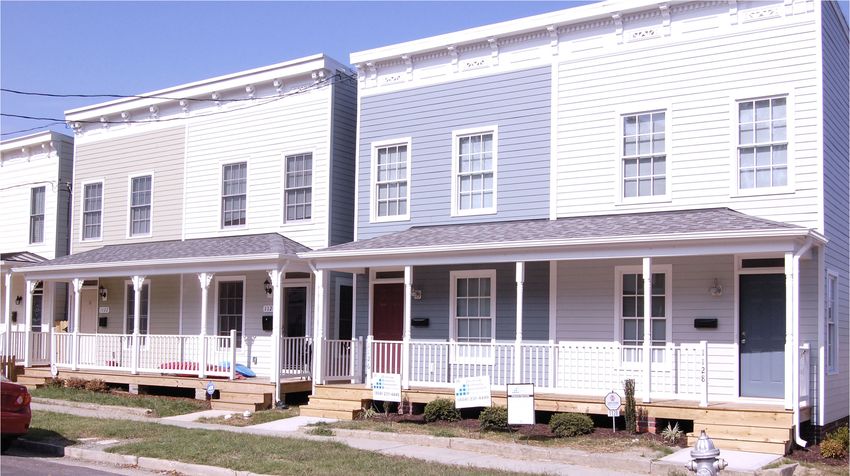
economic mobility and inclusive mechanisms.Homeownership – Out of Reach? • House prices have risen over 6% per year on average since the house price trough in 2012, and they show no sign of slowing down. Incomes, however, have not kept up. • Single family market is feeling the pressure of higher interest rates, lack of affordable homeownership opportunities and historically high debt loads. • Single‐family for rent is the fastest‐ growing segment of the U.S. housing market, 56% of the gains in rental housing stock from 2005 to 2015 were due to single‐family homes.
Local Solutions: Kansas City, MO
Challenge: The City of KCMO needed to address a disinvested area of urban core
replete with vacant single family homes where rehab capital was not readily
available.
Goal: Create a comprehensive strategy and financial mechanism to fill a critical gap
in the local housing market, incentivize banks to participate , and effectuate
affordable homeownership opportunities for low‐and middle‐income families in the
urban core.
The Fund: LISC designed the KCMO Loan Program to attract nimble, cheap long‐
term capital and make joint strategic public/private investments to eligible
homebuyers for acquisition and rehab of vacant, single‐family homes.
Partners: City of KCMO, local banks, Financial Opportunity Centers and nonprofits.
Impacts (Expected): Promote neighborhood stabilization, homeownership and
family wealth building through targeted financial and technical assistance for
homebuyers.
Local Solutions: Charlotte, NC
Challenge: Despite tremendous urban growth, Charlotte recently ranked last among America’s cities terms
of economic mobility. Charlotte residents are severely housing cost burdened and struggle to find affordable
housing in areas of opportunity.

Goal: Produce more mixed‐income housing for low‐to‐moderate income households in areas of opportunity.

The Fund: LISC designed a $50 MM preferred equity Fund unique for the Charlotte market to produce more
mixed‐income housing by combining a below‐market return pool with conventional debt and without
cannibalizing existing affordable housing resources.

Partners: City of Charlotte, Mecklenburg County, Charlotte Housing Authority, Foundation for the Carolinas,
philanthropic investors, banks.

Impacts (Expected):
‐ An “additive” Investment Fund: Produce ~1,500 mixed‐income housing units over the next 5 years and
   house families with a range of incomes (30‐120% AMI).
‐   Leverage $50 MM of City of Charlotte Housing Trust Fund to stretch the City’s limited resources further.
‐   Advance economic mobility and increase affordable housing choice in areas of opportunity in Charlotte
    and Mecklenburg County.
Local Solutions: L.I.V.E Denver Challenge: Lack of inventory of housing affordable for lower income families impacts Denver’s workforce, including nurses in hospital and care centers, and leads to difficulty in obtaining employees and high rates of turnover. Goal: Affordable housing for working low‐to‐moderate income families and individuals in currently vacant apartments by obtaining rent discounts and by buying down the cost of rents for up to 400 units in first year of pilot program. The Initiative: A pilot program to increase housing affordability by connecting Denver’s working low‐ and moderate income families to current vacant rental units, in partnership with private property owners, by sourcing funds from the City, foundations, and employers. Partners: City and County of Denver, Downtown Denver Partnership, Denver Housing Authority, Apartment Association, Foundations, Employers, LISC (Fund Manager).
Celia D. Smoot
Director, LISC Housing

               Contact: csmoot@lisc.org
                         Or
                804-358-2421 ext. 26
Forecasting Changes in the Denver
Housing Market: Identifying
Solutions to Meet Housing Demand
Dr. Jennifer Steffel Johnson
CU Denver Department of Urban and Regional Planning
April 19, 2019Forecasting Changes in the Denver
Housing Market: Identifying
Solutions to Meet Housing Demand
for Equitable Access to Opportunity
Dr. Jennifer Steffel Johnson
CU Denver Department of Urban and Regional Planning
April 19, 2019Forecasting Changes in the Denver
Housing Market: Identifying Solutions
to Meet Housing Demand for Everyone
to Have an Amazing Quality of Life
Dr. Jennifer Steffel Johnson
CU Denver Department of Urban and Regional Planning
April 19, 20191. Affordability is paramount
2. Housing means more
    than just a roof
       overhead
Moving Forward Leverage Assets Diversify Opportunities • Existing homeownership units • Starter homes • Existing market-affordable units • Universal design in new homes • Strong neighborhood character • Sharing economy • Gentrifying neighborhoods
Asset:
Existing Homeownership
Units
Ease the way for ADUs
Facilitate aging in place
with the addition of
services, cooperation, and
unit modificationsAsset: Market-Affordable Units Maximize preservation Consider San Francisco’s Small Sites Program
Asset:
  Strong Neighborhood
        Character

• Opportunity to add gentle
  density in the form of
  context-sensitive “missing
  middle” housing
Asset:
Gentrifying
Neighborhoods
• Opportunity to access high-
quality amenities and
necessities
Preserve, build and voucher
affordable units to ensure a
mix of incomesOpportunity for
Diversity:
Small “Starter” Homes
Capture strong demand
Create “missing middle”
unit types
Consider limited equity
models and other
affordability toolsOpportunity for
Diversity:
Universal Design
• Facilitates intergenerational
filtering
Require in new
construction (especially in
smaller units)Opportunity for
Diversity:
Sharing Economy
• Sharing common space
and tasks supports many
household types
Change restrictive
definitions of “family”To Effectively Leverage Assets and Diversify
Opportunities:
1. Listen to Communities
2. Think Regionally
3. Think Diversity
4. Be Creative
5. Keep the Focus on Quality of LifeThanks! Jennifer.SteffelJohnson@ucdenver.edu
Thank you!
¡Gracias!
You can also read