Growing with Passion Investor Relations Presentation - November 2015
←
→
Page content transcription
If your browser does not render page correctly, please read the page content below
Growing with Passion
Investor Relations Presentation

November 2015
Content
Jungheinrich at a Glance
World Material Handling
Equipment Market
Business Model
Business Development in
Q1-Q3 2015
Strategic Issues and Outlook
Appendix
2
Jungheinrich at a Glance
Jungheinrich at a Glance

Character and norms of
an independent, family-                                     Consolidated net sales
                                   Key figures                         split by region
owned company

Leading intralogistics
service & solution pro-   in € million    2014    Change
vider with manufact-      Incoming                         Germany
                                          2,535     + 8%
uring operations          orders                                         26%      Western
                                                                                  Europe
                          Sales           2,498     + 9%
No. 2 in Europe                                                        9%           51%
No. 3 in the world        EBIT             193     + 12%
                                                           other
                                                           countries      14%
Focus on direct sales                                        Eastern
                          Net income       126     +18%
                                                             Europe

                          Employees      12,549     +6%
Single-brand strategy

4
Dividend

           Dividend per preferred share in €             Net income in million €

                                                                                                              126

                                                           112*
                                  106                                               107

          82

                                                           0.86                     0.86                     1.04
                                 0.76
        0.55

        2010                     2011                      2012                     2013                     2014
2012 figures adjusted due to the application of the amended version of IAS 19 and various changes in the accounting treatment of interest income
and expenses.
5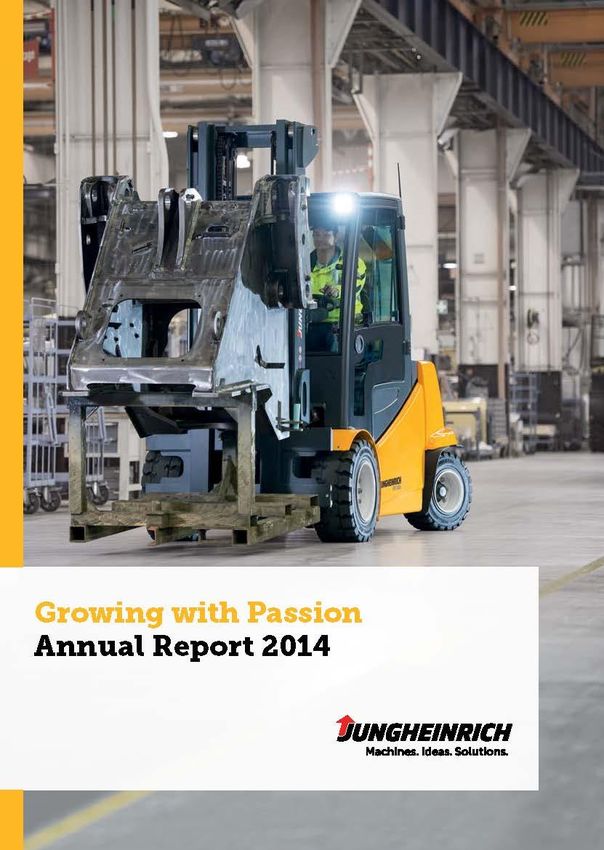
World Material Handling
Equipment Market
World Material Handling Equipment Market—Volume
in thousand units

                           2014: Steady growth across
                                                            Europe
Worldwide                  all quarters                                                      thereof Eastern-
                                                            2014             +9%         345 europe -0.4%

                                                                                              thereof Eastern-
                                                            2013            +2%      316
                                                                                              europe +8%

                                                            2007                             411

                                                            Asia
                                                            2014                   +11%        444
                                                 1,094
                                                            2013                   +11%     401
                                               +8%
                                                            2007                   277
         951                     +7%   1,010
                                                            North America
                                                            2014     +9%     219

                                                            2013     +11%   201

                                                            2007            191
       2007                            2013          2014
Source: WITS und SIMHEM.

7
World Material Handling Equipment Market
Breakdown of Volume by Region
Percentage of total market in terms of units

          2007 = 951       thousand units                             2014 = 1,094       thousand units

                          Asia                                                       Asia
                            28%                                       Europe
     Europe                                                                            41%
                                                                       31%
       43%                    thereof China
                                  12%                                                thereof China
                                                    thereof          5%                     25%
                         North                      Eastern Europe
                         America                                     8%        North
          8%               20%                                                 America
thereof
                   9%                               Rest of World                20%
Eastern Europe                                      Central/South America 4%
                                                    Australia/Africa 4%
 Rest of World
Central/South America 5%                       European market volume in 2014 still
Australia/Africa 4%
                                               16% below pre-crisis level

                                                                                    Source: WITS. and SIMHEM.

8
World Material Handling Equipment Market
Breakdown of Volume by Product Segment
in terms of units

Worldwide
                                                                                           20%
2014: 1,094 thousand units                                          Europe                (28%)
(2007: 951 thousand units)                                                         61%
                                                                                             19%
                                                                                  (52%)
                                                                                            (20%)

                                                                    Asia
                                                                                    19%
                     39%                                                           (18%)
                                    44%
                    (37%)                                                        16%      65%
                                   (45%)                                        (16%)    (66%)

                         17%                                        North America
                        (18%)
                                                                                          37%
                                                                                   45% (43%)
        Warehousing equipment                                                     (40%)
                                                                                         18%
        Battery-powered counterbalanced trucks                                          (17%)

        Internal combustion engine-powered counterbalanced trucks            Source: WITS and SIMHEM.

9
World Material Handling Equipment Market—Market Structure
Comparison Broken Down by Product Segment in 2014 (2007)
in terms of units

                    Europe                                                China

                               20%
                              (28%)                                14%
                                                                   (9%)            73%
                 61%
                                19%                                               (79%)
                (52%)                                          13%
                               (20%)
                                                              (12%)

                Warehousing      Battery-powered counterbalanced      Internal combustion engine-
                equipment        trucks                               powered counterbalanced
                                                                      trucks
          Europe and China: Trend towards warehousing equipment;
          future growth potential for Jungheinrich
Source: WITS.

10
World League Ranking
2014 (2013) Net sales in million €, including currency effects
Ranking in Europe
6,169
1
(5,854)
4,678
2 3
Jungheinrich Kion Toyota
(4,495)
2,498
2,083
(2,290)
Linde
Still
(2,008)
Toyota Fenwick
Raymond OM Still Hyster
BT Industries Baoli Yale
Cesab Voltas Jungheinrich Utilev
1
Toyota Kion Jungheinrich Hyster-Yale
1 Fiscal year: April to March, adjusted: January to December. Source: company data.
11Business Model
The Jungheinrich Business Model

            Intralogistics                      Financial services

 New truck business
                                          Usage transfer and sales financing of
 Development, production and sale of
                                          material handling and warehousing
 new forklifts including logistics
                                          equipment
 systems and mail-order business

 Short-term hire
 Rental of new and used material
 handling equipment

 Used equipment
 Reconditioning and sale of used trucks

 After-sales services
 Maintenance, repair and spare
 part business

13
Breakdown of Net Sales: Intralogistics Segment 2014
by Business Fields
12 %
29% After-sales services
47 % 11 %
New truck 54%
business 8%
4%
17% Short-term hire and
17 %
used equipment
14Business Fields: New Truck Business and After-Sales Services
New truck business After-sales services
Examples: Potential for after-sales services depends
ETV C16 ERC16 EZS 570 on market penetration!
5,900 employees in the global after-sales
organization, thereof 4,200 after-sales
service engineers
High market penetration: 1,022 thousand trucks
~68.1 thousand units
Service
Service expiring in Service potential
65 65 55 59 59 67 76 82 81 48 60 76 73 72 84
Production in thousand units
2000 2001 2002 2003 2004 2005 2006 2007 2008 2009 2010 2011 2012 2013 2014
15The Short-Term Hire and Used Equipment Business Field
Short-term hire Used equipment
Marketing of used equipment (leasing,
Hire periods: generally 1 day to 24 months short-term hire fleet and trade-ins)
Targeted degree of capacity utilization Professional reconditioning of forklifts in
70% to 80% the Dresden Used Equipment Centre
(increase in capacity to 8,000 forklifts by
-Inventory: 2014 = 38.1 thousand trucks the end of 2015)
(+13% yoy)
2014: 5,100 reconditioned trucks
16Divisions: Logistics Systems Business and Mail-Order Business
New truck business
Net sales €1,375 million
€339 million Logistics systems
€50million Mail-order business
17Logistics Systems
Jungheinrich—Partner for End-to-End Logistics Solutions
Planning and design
Forklift trucks Warehouse management
systems:
Racking and storage
equipment
Warehouse administration
Conveyor systems
Warehouse control
Stacker cranes Radio data transmission,
terminals & scanners
System integration
Maintenance and service
18Jungheinrich Acquires MIAS Group
Jungheinrich reinforces its leading position as a provider of logistics
systems.
The Munich-based MIAS Group is an international mechanical engineering
company active in the warehousing and transportation technology sectors,
where it offers stacker cranes and load handling technology.
MIAS Group key figures in 2014: net sales of approx. €40 million and over
300 employees.
As part of the Jungheinrich Group, the MIAS Group will maintain an
independent presence on the market under the MIAS brand name.
19Acquisition of NTP Forklifts Australia
Jungheinrich acquired a majority stake in NTP Forklifts Australia at the
end of October.
NTP ranks among the leading dealerships in the Australian material flow
engineering sector.
By making this strategically important acquisition, Jungheinrich is
continuing to resolutely enlarge its global direct sales footprint.
Business will be continued as a Jungheinrich Group company under the
independent brand NTP Forklifts Australia.
Headquartered in Adelaide, NTP Forklifts Australia has branch offices in
all of Australia’s major regions and employs more than 230 people.
20Mail-Order Business—in Germany, Austria and in the Netherlands
Catalogue Development of net sales in € million
Main catalogue:
1,000 pages
More than 36,000 products
Online
+18% 50.1
+11% 42.3
+12% 38.1
34.0
2011 2012 2013 2014
21Deliveries by Industry
Retail and wholesale
(incl. food distribution)
12%
Logistics
47% 11% Mechanical, automotive and
electrical engineering
8% Food industry (Production)
Chemical industry
4%
17% Timber, paper and print
1% industries
Other industry sectors
Based on incoming orders in terms of units in 2014.
22Financial Services—Principles and Objectives
Service function for Jungheinrich sales division
Business Substantial financial services profits are stated in sales
policy division
New truck business/after-sales services/used equipment
Promotion and expansion of new truck business and
after-sales services
Principle: Every financial service agreement to cover full service
Sales policy and maintenance
Permanent customer retention
Flexible, customized contracts
Matching refinancing (term and interest)
Risk Regular creditworthiness checks
management Quarterly assessment of contractual/residual value risks
Transparency and process reliability via Group database
Full disclosure on Jungheinrich’s consolidated balance sheet
23Business Development in Q1-Q3 2015
World Material Handling Equipment Q1-Q3 2015
Growth Rates by Region
in terms of units; compared to Q1-Q3 2014                                     Worldmarket
                                                                          in thousand of units

                                                                            818.6         827.9

Europe                                              +7%
                                                                      Q1-Q3 2014 Q1-Q3 2015

Western                                                     +11%

Eastern       -12%                            +5%     excluding Russia
thereof Russia -42%
Asia                              -6%       +4%     excluding China
thereof China -12%

North America                                               +11%

World                                       +1%

                                                                         Source: WITS, SIMHEM 9/2015.

25
Incoming Orders
Of all business fields New truck business
in million € in thousand units
1,874 +11% 2,089 63.8 +13% 72.4
Q1-Q3 2014 Q1-Q3 2015 Q1-Q3 2014 Q1-Q3 2015
Slightly over 60% of the growth is attributable All product segments (warehousing
to new truck business equipment as well as battery and
IC engine-powered counterbalanced
trucks) contribute to the strong rise
26Production and Orders on hand—New Truck Business
in thousand units
Production Orders on hand
in thousand units in million €
63.2 +10% 69.5
379 +36% 516
Q1-Q3 2014 Q1-Q3 2015 12/31/2014 09/30/2015
The order reach was more than four
months
27Net Sales and Earnings
in million €
Consolidated net sales EBIT
7.4% EBIT ROS 7.7%
1,792 +10% 1,965
133.4 +13% 151.4
Q1-Q3 2014 Q1-Q3 2015 Q1-Q3 2014 Q1-Q3 2015
Net sales from new truck business +10% Earnings growth resulting from persistently
Net sales from short-term hire and positive developments across all business
used equipment +11%
fields and large number of units produced
Net sales from after-sales services +8%
Net sales outside Europe +23%, primarily
due to increases in China and the USA
28R&D and Capital Expenditures
in million €
R&D Expenditures Capital Expenditures
Capex ratio as a
percentage of
3% 3%
Capitalization net sales
24% ratio 20%
52.1 58.8
35.6 40.0
Q1-Q3 2014 Q1-Q3 2015 Q1-Q3 2014 Q1-Q3 2015
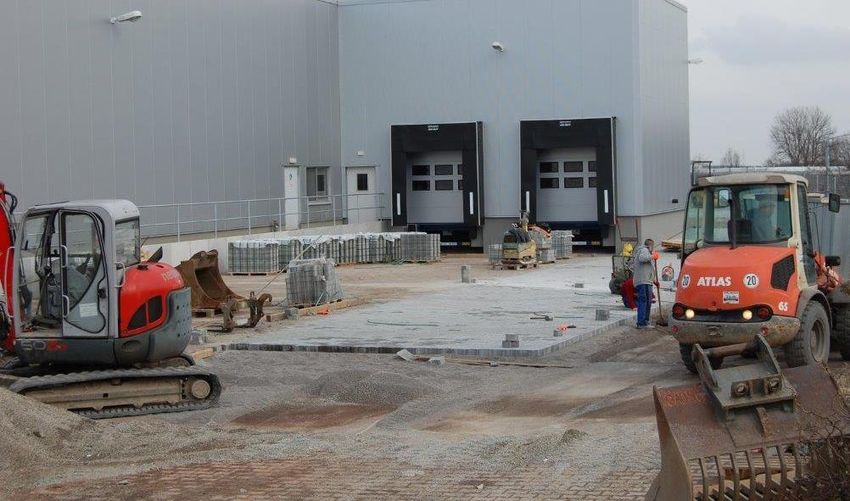
Capital expenditures in both periods cover
major construction projects: Norderstedt
training centre, modernization of the Moosburg
factory, expansion of the Dresden Used
Equipment Centre & corporate headquarters
in Hamburg
29Major Construction Projects
Modernization of the Moosburg
Norderstedt Training Centre factory
Expansion of the Used
Equipment Centre Dresden Corporate headquarters
30Working Capital and Net Debt
in million. €
Working capital Net debt1
as a
23.3% percentage 21.9%
of net sales „Cash“
557 575 -118 -101
09/30/2014 09/30/2015 09/30/2014 09/30/2015
1 Financial liabilities minus liquid assets and securities.
31Financial Services
in milion €
Original value of new Original value of contracts on
contracts hand
1,813 1,959
340 398
Trucks
111.3 119.0
in thousand units
Q1-Q3 2014 Q1-Q3 2015 09/30/2014 09/30/2015
32Workforce Trend
In full-time equivalent (FTE), including apprentices, excluding temporay workers.
+688 13,1237
12,549
(+ 5%)
Germany
■ Sales in Europe remain the focal 5,638 5,853
point of the continued headcount
expansion
■ Q3 2015: +259 Employees
Abroad 6,911 7,384
12/31/2014 09/30/2015
33Strategic Issues and Outlook
34The Jungheinrich Group’s Growth Strategy
Goal for 2017:
>€3 billion
net sales
1
1 Internal combustion engine-powered counterbalanced trucks.
35Basic Conditions and Risks
Economic outlook Risks
Growth rate Forecast
GDP in % 2014 2015
■ Economic risks in European
World 3.2 2.9 countries
Eurozone 0.9 1.5 ■ Foreign exchange fluctuations
Germany 1.6 1.8 ■ Growth risk in China
China 7.3 6.8 ■ Other geopolitical risk factors
USA 2.4 2.5
Source: Commerzbank October 2015.
36World Material Handling Equipment Market
in thousand units
Europe
Worldwide
2015e
thereof Eastern-
2014 +9% 345 europe -0.4%
thereof Eastern-
2013 +2% 316
europe +8%
951 1,010 +8% 1,094 Asia
2015e
2014 +11% 444
2013 +11% 401
2007 2013 2014 2015e
We anticipate that the Western European market will grow. North Amerika
With the exception of Russia, this also applies to Eastern 2015e
Europe. The Russian market is no longer expected to
post a market improvement in Q4 2015. 2014 +9% 219
In Asia—except China—we expect the market to continue 2013 +11% 201
posting solid growth, whereas in China, only the ware-
housing segment is likely to grow.
Source: WITS and SIMHEM, 2015 figures estimated.
37Jungheinrich Group—Forecast for 2015 confirmed
Net sales EBIT EBT
Incoming orders
€2.65 bn - €195 million - €180 million -
€2.7 bn - €2.8 bn
€2.75 bn €205 million €190 million
Capital expenditures in tangible assets €90 million - €100 million
Research and development expenditures ~ €50 million
ROCE 15% - 20%
Dividend policy: Payout ratio of 25% to 30% of net income
38Disclaimer Since developments cannot be foreseen, the actual business trend may deviate from the expectations presented here based on assumptions and estimates made by Jungheinrich company management. Factors that may lead to such deviations include changes in the economic environment, changes in the political and legal environment and within the material handling equipment sector as well as exchange and interest rate fluctuations. Therefore, no responsibility is taken for forward-looking statements made in this presentation and no ensuing liability is assumed. 39
Appendix
Plants and Portfolio of Products
Germany China
Norder- Lüne- Moos- Degern- Lands-
Dresden Qingpu
Products Plants stedt burg burg point berg
Low-lift trucks
Stacker trucks
Battery-powered
counterbalanced trucks
IC engine-powered
counterbalanced trucks
Reach trucks
Order pickers
High-rack stackers
Tow tractors
Small-series and
customized trucks
Control units, batteries
and chargers
Reconditioning of used
equipment
42World League Ranking Competitors in 2014
sales in million €
6,169
4,678
2,498
2,083
1,882 1,855
Linde
Still 1,487 1,326
Toyota Fenwick Mitsubishi
Raymond OM Still Hyster Nippon Y. Nissan
BT Indust. Baoli Yale Crown Caterpillar Kalmar TCM 800 783
Cesab Voltas Utilev Hamech Rocla Cargotec Atlet
Toyota 1 Kion Jungheinrich Hyster-Yale Crown 2 Mitsubishi 2 Kalmar Unicarriers2 Manitou Anhui Heli
Nichiyu
1 Fiscal year April to March adjusted Jan. to Dec. 2014.
Source: Logistik Journal October 2015, Comany data.
2 Fiscal year April to March.
43Incoming Orders
in million €
2,120 1,924 2,178 2,251 2,357 2,535
2007 2010 2011 2012 2013 2014
44Consolidated Net Sales
in million € Germany Abroad
2,498
2,270 2,290
2,116
2,001 607 613 655
1,816 571
505
493
1,496 1,323 1,545 1,663 1,677 1,843
2007 2010 2011 2012 2013 2014
Change in accounting treatment as of 1/1/2013, figures for 2012 were adjusted to the change in the statement of interest income from financial
services (finance lease customer contracts).
45EBIT and EBIT ROS
EBIT in million € EBIT Return on sales (EBIT ROS)
EBIT ROS
7.8% 7.5% 7.7%
7.0% 6.9%
5.4%
139.5 97.6 145.8 176.8 172.4 192.7
2007 2010 2011 2012 2013 2014
Change in accounting treatment as of 1/1/2013, figures for 2012 were adjusted due to the application of the amended version of IAS 19
and various changes in the accounting treatment of interest income and expenses.
46EBIT-Return on Capital Employed (ROCE)
Interest-bearing capital excluding liabilities from financial services and provisions for pensions.
Since 2012, interest-bearing capital includes provisions for pensions and provisions for non-current personnel obligations.
Capital employed ROCE
ROCE 26.2%
24.1%
22.7%
21.6%
18.7% 18.4%
818 920 1,047
578 430 556
2007 2010 2011 2012 2013 2014
Change in accounting treatment as of 1/1/2013, figures for 2012 were adjusted due to the application of the amended version of IAS 19
and various changes in the accounting treatment of interest income and expenses.
47Research & Development
Expenditures in million €
41 36 38 44 45 50
Change in accounting treatment as of 1/1/2013, figures for 2012 were adjusted due to the application of the amended version of IAS 19
and various changes in the accounting treatment of interest income and expenses.
Number of employees (FTE, average)
350 322 342 378 400 418
2007 2010 2011 2012 2013 2014
48Capital Expenditures
in million €
52 52 78 91 84
33
2007 2010 2011 2012 2013 2014
49Equity Ratio
Jungheinrich Group "Intralogistics" segment
39.9% 41.2% 43.0% 42.4% 47.1% 46.0%
26.7% 26.4% 27.8% 27.3% 30.2% 29.6%
2007 2010 2011 2012 2013 2014
Change in accounting treatment as of 1/1/2013, figures for 2012 were adjusted due to the application of the amended version of IAS 19
and various changes in the accounting treatment of interest income and expenses.
50Net Debt
excl. liabilities from financial services and accrued liabilities for pensions
in million €
203 162 183 154 132
"Cash"
Net debt
-40 2010 2011 2012 2013 2014
2007
51Tax Ratio
41.1%
28.8% 28.2% 28.9% 28.2%
14.1%
2007 2010 2011 2012 2013 2014
Change in accounting treatment as of 1/1/2013, figures for 2012 were adjusted due to the application of the amended version of IAS 19
and various changes in the accounting treatment of interest income and expenses.
52Net Income
82 82 106 112 107 126
2007 2010 2011 2012 2013 2014
Change in accounting treatment as of 1/1/2013, figures for 2012 were adjusted due to the application of the amended version of IAS 19
and various changes in the accounting treatment of interest income and expenses.
53Employees
in FTE Germany Abroad
12,549
11,840
11,261
10,711
10,178 10,138
5,167 5,356 5,638
4,761 4,661 4,925
6,094 6,484 6,911
5,417 5,477 5,786
2007 2010 2011 2012 2013 2014
54General Information
Financial Calendar Contact:
Pro-forma figures for the 2015
financial year 03/03/2016 Andrea Bleesen
Balance sheet press conference 03/23/2016 Head of Investor Relations
Analyst conference 03/24/2016
Interim report as of 03/31/2015 05/10/2016 Jungheinrich Aktiengesellschaft
2016 Annual General Meeting 05/24/2016 Friedrich-Ebert Damm 129 · 22047 Hamburg
Telefon +49 40 6948-3407 Fax +49 40 6948-753407
Dividend payment 05/25/2016
andrea.bleesen@jungheinrich.de
Interim report as of 06/30/2015 08/09/2016
www.jungheinrich.com
Interim report as of 09/30/2015 11/08/2016
Subscribed capital: Stock exchanges:
102 million € subdivided into Frankfurt and Hamburg and
18 million non-par-value ordinary shares all other German stock exchanges
16 million non-par-value preferred shares (listed)
Securities identification numbers Segment: Prime Standard
(Preferred shares): Ticker abbreviations: Branch: Industry
ISIN: DE0006219934 Reuters JUNG_p.de Stock index: MDAX
WKN: 621 993 Bloomberg JUN3 GRYou can also read