Investors Presentation - August 2021 Dr Stephan Meeder, CEO/CFO Heike Baumbach, Head of Investor Relations - CropEnergies AG

Page created by Lester Contreras
 
CONTINUE READING
Investors Presentation - August 2021 Dr Stephan Meeder, CEO/CFO Heike Baumbach, Head of Investor Relations - CropEnergies AG
Investors Presentation
                            August 2021
                      Dr Stephan Meeder, CEO/CFO
           Heike Baumbach, Head of Investor Relations
Investors Presentation - August 2021 Dr Stephan Meeder, CEO/CFO Heike Baumbach, Head of Investor Relations - CropEnergies AG
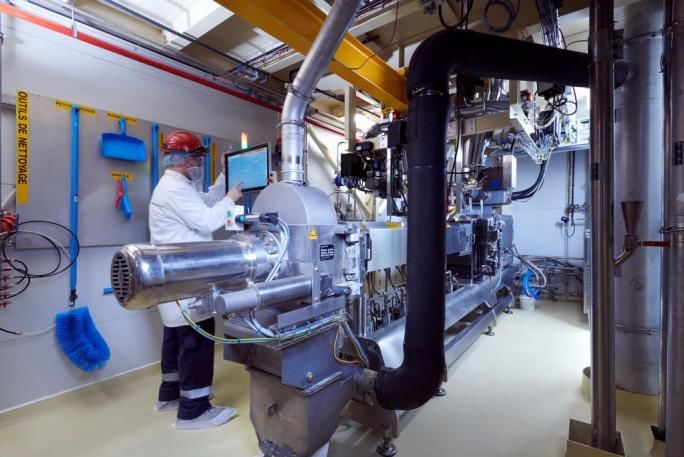
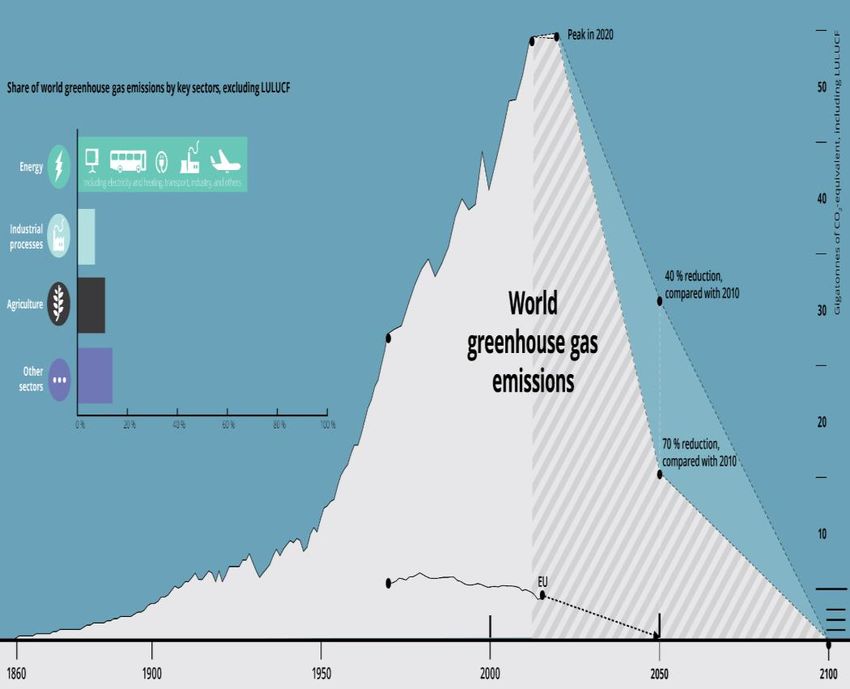
Two challenges of our times

GHG emissions: worldwide >50 bn. t CO2eq./a           Corona: worldwide more than 202 million infected
                                                                                                                     As of 4 August 2021

                                        Source: EEA                 Source: https://www.worldometers.info/coronavirus/worldwide-graphs/#total-cases

CropEnergies AG, August 2021                                                                                             2
Investors Presentation - August 2021 Dr Stephan Meeder, CEO/CFO Heike Baumbach, Head of Investor Relations - CropEnergies AG
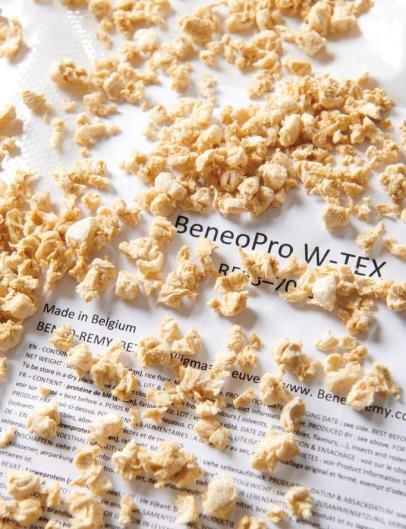
Vision and mission

OUR VISION
Our vision is a climate friendly world in which
renewable resources are key to ensuring the welfare
of today‘s and future generations.

OUR MISSION
Our mission is to be the most trusted partner for our
customers delivering sustainable products made out
of biomass.

Our new appearance:

CropEnergies AG, August 2021                            3
Investors Presentation - August 2021 Dr Stephan Meeder, CEO/CFO Heike Baumbach, Head of Investor Relations - CropEnergies AG
Ethanol
Important element to decarbonize the transport sector

                                                        High-quality fuel
  Domestic
                                                         which can be
renewable raw
                                                         used in petrol
   materials
                                                            engines

                                Climate-friendly fuel
                               produced sustainably

CropEnergies AG, August 2021                                                4
Investors Presentation - August 2021 Dr Stephan Meeder, CEO/CFO Heike Baumbach, Head of Investor Relations - CropEnergies AG
Ethanol
>70% less GHG emissions compared to fossil fuels*

• The GHG values of all elements in the value-added chain are added up
• The emissions from ethanol when used in combustion engines is zero
• European ethanol reduces annual GHG emissions by >10 Mt**

   Cultivation             Transport    Ethanol      Ethanol           CO2
     Grain                   Grain     Production   Transport      Liquefaction

CropEnergies AG, August 2021                                                      5
Investors Presentation - August 2021 Dr Stephan Meeder, CEO/CFO Heike Baumbach, Head of Investor Relations - CropEnergies AG
Renewable ethanol
Advantages

• Ethanol…
    • As direct blend to petrol (e.g. E5, E10, E85)                          Blending
    • As component in ETBE (octane booster)
                                                                              Ethanol

• E10 reduces CO2, NOx and particulate matter                                  Petrol
    • WLTP* benchmark, label in tank flap of all new cars
    • Potential savings (EU): >20 Mt CO2eq (8 million less cars on the     E5 E10 E20 E85
       road)

• Potential for 20% ethanol blending (Super E20)
    • Potential savings: >40 Mt CO2eq (16 million less cars on the road)
    • Successful racing results (Porsche/Nürburgring)
    • Technical analysis for standardisation initiated

*Worldwide harmonized light-duty vehicle test
CropEnergies AG, August 2021                                                       6
Investors Presentation - August 2021 Dr Stephan Meeder, CEO/CFO Heike Baumbach, Head of Investor Relations - CropEnergies AG
Our co-products
Food and Fuel

• Raw materials are utilized completely
• Concept of co-production

                Vital Wheat Gluten                    ProtiGrain® – DDGS
                       Valuable protein product for      High protein animal feed
                       food and animal feed              from dried stillage
                       industry

                Food-grade liquefied CO2              ProtiWanze® – CDS
                       For food and beverages            Liquid protein animal feed
                       industries                        from stillage

CropEnergies AG, August 2021                                                          7
Investors Presentation - August 2021 Dr Stephan Meeder, CEO/CFO Heike Baumbach, Head of Investor Relations - CropEnergies AG
The ethanol markets
EU & UK production

• World production                                                                    • EU & UK production
   • 2021e: 122 million m3 (+3%)                                                          • 2021e: 7.7 million m3 (+3%)
         o Fuel applications: 102 million m³ (+3%)                                            o Fuel applications: 5.3 million m³ (+5%)
   • 2022e: 128 million m3 (+5%)                                                          • 2022e: 8.1 million m3 (+5%)
         o Fuel applications: 107 million m³ (+5%)                                            o Fuel applications: 5.8 million m³ (+8%)

              World production of ethanol [M m3]                                                     EU production of ethanol [M m3]
150                                                                                      9

100                                                                                      6

                                                                                                                                                Source: FO Licht (2021)
                                                            Source: FO Licht (2021)

 50                                                                                      3

       2017      2018     2019      2020    2021e   2022e                                    2016   2017   2018      2019    2020   2021e   2022e
                 USA    Brasil   EU & UK   other                                                              fuel    non-fuel
CropEnergies AG, August 2021                                                                                                                8
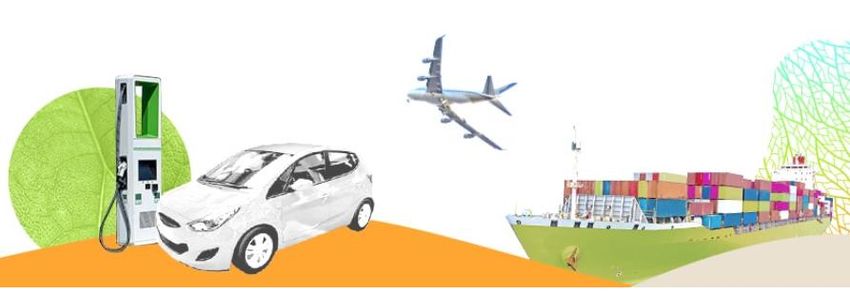
Investors Presentation - August 2021 Dr Stephan Meeder, CEO/CFO Heike Baumbach, Head of Investor Relations - CropEnergies AG
Market development
Volumes

• Ethanol market in the EU27 & UK in 2021 (in million m³)                                  EU27 & UK: ethanol sales [1,000 m3]
• Consumption:             8.5   +2%    (5.7 fuel | 2.9 non-fuel)                      8,599                                     8,520               8,951

                                                                                                                                                                     Source: IHS Markit (2021)
                                                                             ,
                                                                            9.000                              8,317
                                                                                        982                                       965                 965
                                                                                                                955
• Production:              7.7   +3%    (5.3 fuel | 2.4 non-fuel)                      1,618                   1,950             1,890               1,860

• 2021 only slight recovery in fuel ethanol sales expected                   ,
                                                                            4.500
                                                                                       5,999                   5,412             5,665               6,162
• Non-fuel expected to remain stable in 2021
• Outlook: Strong increase in fuel ethanol expected in 2022                    0
                                                                                           2019                2020              2021                2022
                                                                                     Fuel            Industrial            Potable

• Premium E10 continues to be on the rise in Europe                                    E10 shares in selected countries

                                                                                                                                                                            Source: ePURE (2021)
                                                                            100%
• E10 already established as #1 petrol in many European countries

                                                                                    100%
                                                                                            100%
                                                                                                   98%
                                                                                                         95%
                                                                                                               95%
                                                                                                                     95%
                                                                                                                           90%
                                                                                                                                 80%
• Will be launched in Sweden and UK in August and September, respectively

                                                                                                                                       72%
                                                                                                                                             70%
                                                                             50%

                                                                                                                                                               16%
                                                                                                                                                   47%
                                                                                                                                                         45%
                                                                              0%

CropEnergies AG, August 2021                                                                                                9
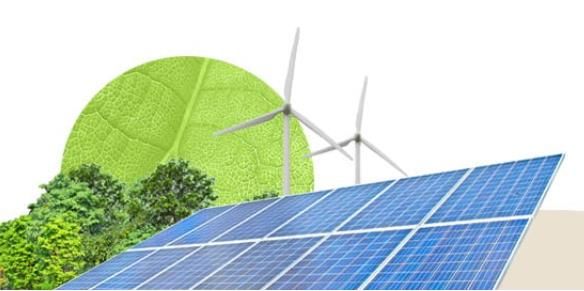
Investors Presentation - August 2021 Dr Stephan Meeder, CEO/CFO Heike Baumbach, Head of Investor Relations - CropEnergies AG
Market development
Prices and feedstock market
                                                                                     European ethanol prices [€/m3]
                                                                               850
• European ethanol price* recovery in course of first quarter
    • Due to increased mobility in many countries​
        o But also reflects higher global energy and grain prices​             600
    • Average ethanol price € 590 (492) /m³​ in Q1
                                                                                     FY 19/20   FY 20/21    FY 21/22
                                                                               350
• Feedstock market 2021/22
    • Grain prices**: € 225 (191) /t ​in Q1
    • EU grain harvest: 292 Mt (+5%) exceeds consumption of 263 Mt​                    Euronext Paris Wheat [€/t]
                                                                               275
    • World grain harvest***: 2.261 Mt (+3%) with constant stocks (590 Mt)
    • Still high price level despite promising harvest estimations
                                                                               200

                                                                                     FY 19/20   FY 20/21    FY 21/22
                                                                               125

* T2 FOB Rdam ** Wheat (Euronext), next expiry   *** all types, without rice

CropEnergies AG, August 2021                                                                       10
Renewable Energy Directive-II
The “toolbox“

  Arable crops                    Annex IX-A                Annex IX-B                Electricity

• 2020 level, max. 7%          • Min. 0.2% in 2022       • Max. 1.7%, but still   • Important component
• Local, sustainable           • Min. 1.0 % in 2025        x2 versus today          in the future

• Proteins                     • At least 3.5% in 2030   • UCO imports: 10x       • But: discretionary
                                                           within last 10 years     multiplier (x4) does not
• Commitment to 1G             • Strong market                                      save a single gram of
  as reliable basis for          potential               • Compatibility with
                                                                                    CO2
  low-emission                                             law on waste needs
                               • Very capital intense      to be ensured          • Extension only
  transport sector
  necessary                                                                         reasonable if
                               • Investment security                                additional green
                                 and investment                                     electricity will be
                                 incentives decisive                                produced

CropEnergies AG, August 2021                                                                                   11
Climate protection for Germany

• National implementation of RED-II
                                                                                                                    DE: GHG reduction quota
          • Overall GHG quota from currently 6% to 25% in 2030​​                                                          2020-2030
                                                                                                                                                    25%
                    o      Penalty for non-compliance increases to € 600/t CO2äq from 2022 on​           25%
                    o      GHG quota will be further increased depending on the growth in e-mobility​​
                                                                                                         20%
                    o      Recognition of Upstream Emission Reductions will cease after 2026​                                               17.5%

                    o      Introduction of special blending quota for synthetic jet fuels from 2026 on   15%
                                                                                                                                      12%
          • Phase-out of high ILUC fuels (palm oil) from 2023 on*                                                             9.25%
                                                                                                         10%             8%
          • Biofuels from arable crops: max. 4.4% (2018: 3.2%)*                                                6%
                                                                                                                    7%

          • Advanced biofuels from residues min. 2.6% in 2030*​​                                         5%

          • Multiple counting schemes for electromobility, advanced/synthetic fuels​*                    0%

* Further regulations to be laid down at ordinance level

CropEnergies AG, August 2021                                                                                                  12
More climate protection for Europe
EU taxonomy regulation

• Classification system to promote sustainable investments
• Application on EU environmental targets
      • From 2022: climate change mitigation and adaptation on climate change
      • From 2023: Protection of water und maritime resources, transition to circular
        economy, no/less environmental pollution and protection of
        biodiversity/ecosystems
• Evaluation
      • Positive: basic idea and recognition of the contribution of biofuels to climate
        protection and the adaptation to climate change
      • But: exclusion of crop-based biofuels for climate change mitigation measures is
        arbitrary and in contradiction to the Renewable Energy Directive

CropEnergies AG, June 2021                                                                13
EU: Fit for 55 package
Renewable Energy Directive (RED-II) - overview on proposed revision

Overall ambition
• Overall RES target increase from 32% to 40%
RES-Transport target
• GHG intensity reduction of 13% by 2030 (replacing RES-T of 14% by energy)
• Crop-based biofuels: 2020 share of transport energy plus 1%, within 7% limit
• Annex IX Part A: at least 0.2% in 2022, 0.5% in 2025, and 2.2% in 2030
• Annex IX Part B: up to 1.7% (no increase upon request anymore)
• RFNBOs*: 2.6% by 2030
• No multiple counting, except adv. Biofuels/RFNBOs in aviation/maritime (x1.2)
• Stricter sustainability criteria

* Renewable liquid and gaseous transport fuels of non-biological origin
                                                                                  14
CropEnergies
Innovation from Biomass

For our future:
Sustainability and climate neutrality
•   in its traditional core business of mobility - with
    sustainable and climate-friendly fuels
•   in a completely new business area based on
    ethanol derivatives as an alternative to fossil
    raw materials
•   with biogenic CO2 as the raw material of the
    future and as capital for the company's further
    development
•   to serve a clear growth market with protein
    products for the food and animal feed industry
    and to deepen the value chain

CropEnergies AG, August 2021                              15
Our contribution: CE Green Deal
-35% until 2030 versus 2018
We invest 75 M€ in new energy sources and savings until 2025

                                                                                    347                  342
                                                                            .
                                                                           0,8                   333                              350
 Site                   Projects
                                                                                   0.73                                           300
                                                                                                        0.69
                                                                                                 0.63                             250
 Loon-Plage (FR)        Usage of waste heat as process energy
                                                                                                                                  200
                                                                                                                       0.47
                                                                            .
                                                                           0,4
 Zeitz (DE)             Transition to low CO2 / renewable energy sources
                                                                                                                                  150

 Wanze (BE)             Construction of an additional biomass boiler                                                              100

                                                                                                                                  50
 Wilton (UK)            Reduction of process energy (energy efficiency)
                                                                            0                                                     0
                                                                                 2018 basis      2019   2020        2030 target

                                                                                     Total in Mt CO2    kg CO2 per t of product
               Savings: >265.000 t CO2eq./year

CropEnergies AG, August 2021                                                                                   16
Appendix
Wheat proteins as meat alternative

• BeneoPro W-Tex as meat alternative
    • Investment in the amount of € 4.3 million by sister company Beneo
    • Start of operation: 1st March 2019
    • Replacement of meat in products such as burgers, nuggets and bolognese
    • Facility is operated by BioWanze
    • Sales are concluded by Beneo

• Trend: meat replacement
    • Growing demand for plant-based proteins worldwide
    • Average annual growth rate of 5.5%* expected in Europe in the next 5 years

 *Global Data Market Analyzer
CropEnergies AG, August 2021                                                       18
The production sites of CropEnergies AG

                                                                       CropEnergies AG
                                                                        Mannheim - Germany

       Zeitz – Germany                                 Wanze – Belgium                       Loon-Plage – France                             Wilton – UK
 CropEnergies Bioethanol GmbH                           BioWanze SA                           Ryssen Alcools SAS                             Ensus UK Ltd.

Annual capacity:                              Annual capacity:                        Annual capacity:                            Annual capacity:

400,000 m³ ethanol                            300,000 m³ ethanol                      >100,000 m³ ethanol for fuel applications   400,000 m³ ethanol
thereof up to 60,000 m3 neutral alcohol       >60,000 t wheat gluten                   90,000 m³ ethanol for traditional and      350,000 t DDGS
>300,000 t ProtiGrain® (DDGS)                 >400,000 t ProtiWanze®                  technical applications
100,000 t liquefied CO2

Raw materials: grain and sugar syrups         Raw materials: wheat and sugar syrups   Raw material: raw alcohol                   Raw material: grain

                                                                                      Ethanol for traditional &
       ProtiGrain®                        Gluten                 Ethanol as Fuel                                           ProtiWanze®               Liquefied carbon
                                                                                       technical applications                                            dioxide

   Capacity: more than 1.3 million m³ ethanol and more than 1 million tonnes food and animal feed per year
 CropEnergies AG, August 2021
Q1 2021/22 &
Outlook
Overview 1st quarter 2021/22

 • Ethanol production                                                               235 (208) ,000 m³             + 13%
 • Revenues                                                                         € 214 (171) million           + 25%

 • EBITDA                                                                          € 25.5 (18.2) million   + € 7 million
 • Operating profit                                                                 € 15.1 (8.1) million   + € 7 million
 • Net earnings                                                                     € 10.1 (7.9) million   + € 2 million

 • Net financial assets (vs. 28.02.2021)                                         € 182.6 (154.6) million + € 28 million

   Note: Figures in parentheses relate to the corresponding prior-year period.

CropEnergies AG, August 2021                                                                                 21
Operating profit

                                                                                            Revenues / Production
                                                                                               [M€ / 1,000 m3]
                                                                                    400
 (in € million)                                  Q1 2021/22   Q1 2020/21    Δ
                                                                                    300               272
                                                                                                255         251
 Revenues                                            214.1        170.7    + 25%                                  235
                                                                                          208
 Overall performance                                 210.5        169.6    + 24%    200         229   226
                                                                                                            208   214
 Cost of materials*                                  -163.0       -131.3   - 24%          171
                                                                                    100
 Spread (gross)                                       47.5         38.3    + 24%

    in % of overall performance                     22.6%        22.6%          -     0
                                                                                           Q1    Q2    Q3    Q4    Q1
 Further
*without    operating
         restructuring    expenses/income*
                       costs and special items        -22.0        -20.1   - 10%          20/21 20/21 20/21 20/21 21/22
                                                                                             Operating profit [M€]
 EBITDA*                                              25.5         18.2    + 40%     50
  Margin                                            11.9%        10.7%          -                43
                                                                                     40
 Depreciation*                                        -10.4        -10.1    - 3%
                                                                                                       29    28
                                                                                     30
 Operating profit                                     15.1          8.1    + 86%
*without restructuring costs and special items                                       20                            15
• Significant increase in sales prices and quantities                                10    8

• Higher specific raw material and energy costs                                       0
                                                                                           Q1    Q2    Q3    Q4    Q1
                                                                                          20/21 20/21 20/21 20/21 21/22

CropEnergies AG, August 2021                                                                    22
Net earnings

                                                                                    Net earnings [Mio. €]
                                                                             50
 (in € million)                        Q1 2021/22    Q1 2020/21      Δ
                                                                             40
 Operating profit                           15.1              8.1   + 86%                32
                                                                             30
 Restructuring costs / special items         0.0              0.0        -                           24
                                                                                               22
 At-equity result                            -0.1             0.1        -   20
                                                                                                            10
 Income from operations                     15.0              8.2   + 83%    10     8

 Financial result                            -0.9             2.3        -    0
                                                                                   Q1    Q2    Q3    Q4    Q1
 Earnings before income taxes               14.1             10.5   + 34%         20/21 20/21 20/21 20/21 21/22
 Taxes on income                             -3.9            -2.6   - 50%

 Net earnings for the period                10.1              7.9   + 28%

 Earnings per share (in €)                  0.12             0.09   + 28%

• Unrealised currency effects included in financial result
• EPS increased to € 0.12 (0.09)

CropEnergies AG, August 2021                                                            23
Cash flow

                                                                                           Cash flow (+) / Investments* (-)
                                                                                                        [M€]
                                                                                      50                              *in PPE

(in € million)                                     2020/21      2019/20        Δ      40

Cash flow                                             21.2         15.5      + 5.7    30
Change in net working capital                         12.9         18.5      - 5.6                              21
                                                                                      20      16
Net cash flow from operating activities               34.1         34.0      + 0.1    10
Investments in property, plant et al.                 -4.7        -10.1      + 5.4
                                                                                       0
Cash received on divestments                           0.0          0.0      + 0.0
                                                                                     -10                              -5
Payments into financial receivables                  -18.1        -16.9      - 1.2
                                                                                                   Q1             Q1
Payments into current financial investments            0.1          0.0      + 0.1                20/21          21/22
                                                                                              Net financial asset [M€]
Cash flow from investing activities                  -22.6        -26.9      + 4.3   250
Cash flow from financing activities                   -1.4         -0.9      - 0.5
                                                                                     200                               183
Changes in exchange rates / consolidation basis        0.0         -0.1      + 0.1                        165
                                                                                                                155
                                                                                     150    130
Change in cash and cash equivalents                   10.1          6.1      + 4.0
                                                                                     100            92
                                                  31/05/2021   31/05/2020      Δ
                                                                                      50
Net financial assets                                 182.6        130.2     + 52.4
                                                                                       0

• Significant increase in net financial assets
CropEnergies AG, August 2021                                                                        24
Outlook 2021/22

• High raw material and energy costs with higher ethanol revenues
• Revenues between € 925 and 975 million
• EBITDA in a range of € 90 to 125 million
• Operating profit between € 50 and 80 million

CropEnergies AG, August 2021                                        25
Financial Calender
13 October 2021:                       Report for the 1st half of 2021/22
                                                                                                                                 Contakt
12 January 2022:                       Statement for the 1st-3rd quarter of 2021/22                                              CropEnergies AG
18 May 2022:                           Annual report and press and analysts‘ conference FY 2021/22                               Maximilianstraße 10
6 July 2022:                           Statement for the 1st quarter of 2022/23                                                  68165 Mannheim

12 July 2021:                          Annual General Meeting 2022                                                               www.cropenergies.com

Stock Information                                                                                                                Investor Relations                                            Public Relations / Marketing

ISIN:                                 DE000A0LAUP1                                                                               Heike Baumbach                                                Nadine Dejung-Custance
Symbol:                               CE2                                                                                        Phone: +49 (621) 71 41 90-30                                  Phone: +49 (621) 71 41 90-65
Bloomberg / Reuters:                  CE2 GY / CE2G.DE
                                                                                                                                 ir@cropenergies.de                                            presse@cropenergies.de
Transparency standard:                Prime Standard

Disclaimer

This presentation contains forward looking statements. The statements are based on current assumptions and estimates made by the executive board and information currently available to its members. The forward looking
statements are not to be viewed as guarantees of the future developments and results presented therein. Future developments and results are in fact dependent on a variety of factors and are subject to various risks and
imponderables. They are based on assumptions that could in fact prove to be invalid. The risk management report in the current annual report presents an overview of the risks. We assume no obligation to update the forward-
looking statements made in this presentation. In addition, all disclaimers published on the CropEnergies website apply.
This presentation includes percentage and number rounding. Typing and printing errors reserved.
Written and visual value statements are standardized as follows:

± 1% - stable                           ± 1 – 4% - slight                                                                                                                                                   26
± 4 – 10% - moderate                    > ± 10% - significant
You can also read