FIRST SOLAR
INVESTOR OVERVIEW
←
→
Page content transcription
If your browser does not render page correctly, please read the page content below
FIRST SOLAR INVESTOR OVERVIEW
IMPORTANT INFORMATION
Cautionary Note Regarding Forward Looking Statements
This presentation contains forward-looking statements which are made pursuant to safe harbor provisions of the Private Securities Litigation Reform Act of 1995. These
forward-looking statements include, but are not limited to, statements concerning: effects resulting from certain module manufacturing changes and associated restructuring
activities; our business strategy, including anticipated trends and developments in and management plans for our business and the markets in which we operate; future
financial results, operating results, revenues, gross margin, operating expenses, products, projected costs (including estimated future module collection and recycling costs),
warranties, solar module technology and cost reduction roadmaps, restructuring, product reliability, investments in unconsolidated affiliates, and capital expenditures; our
ability to continue to reduce the cost per watt of our solar modules; the impact of public policies, such as tariffs or other trade remedies imposed on solar cells and modules;
our ability to expand manufacturing capacity worldwide; our ability to reduce the costs to construct photovoltaic (“PV”) solar power systems; research and development (“R&D”)
programs and our ability to improve the conversion efficiency of our solar modules; sales and marketing initiatives; the impact of U.S. tax reform; and competition. These
forward-looking statements are often characterized by the use of words such as “estimate,” “expect,” “anticipate,” “project,” “plan,” “intend,” “seek,” “believe,” “forecast,”
“foresee,” “likely,” “may,” “should,” “goal,” “target,” “might,” “will,” “could,” “predict,” “continue” and the negative or plural of these words and other comparable terminology.
Forward-looking statements are only predictions based on our current expectations and our projections about future events and therefore speak only as of the date of this
presentation. You should not place undue reliance on these forward-looking statements. We undertake no obligation to update any of these forward-looking statements for any
reason, whether as a result of new information, future developments or otherwise. These forward-looking statements involve known and unknown risks, uncertainties and other
factors that may cause our actual results, levels of activity, performance or achievements to differ materially from those expressed or implied by these statements. These
factors include, but are not limited to: structural imbalances in global supply and demand for PV solar modules; the market for renewable energy, including solar energy; our
competitive position and other key competitive factors; reduction, elimination, or expiration of government subsidies, policies, and support programs for solar energy projects;
our ability to execute on our long-term strategic plans; our ability to execute on our solar module technology and cost reduction roadmaps; interest rate fluctuations and both
our and our customers' ability to secure financing; our ability to attract new customers and to develop and maintain existing customer and supplier relationships; our ability to
successfully develop and complete our systems business projects; our ability to convert existing production facilities to support new product lines, such as Series 6 module

                                                                                                                                                                                      4 January 2019 © Copyright First Solar, Inc.
manufacturing; general economic and business conditions, including those influenced by U.S., international, and geopolitical events; environmental responsibility, including
with respect to cadmium telluride (“CdTe”) and other semiconductor materials; claims under our limited warranty obligations; changes in, or the failure to comply with,
government regulations and environmental, health, and safety requirements; effects resulting from pending litigation; future collection and recycling costs for solar modules
covered by our module collection and recycling program; our ability to protect our intellectual property; our ability to prevent and/or minimize the impact of cyber-attacks or
other breaches of our information systems; our continued investment in R&D; the supply and price of components and raw materials, including CdTe; our ability to attract and
retain key executive officers and associates; and the matters discussed under the captions “Risk Factors” and “Management's Discussion and Analysis of Financial Conditions
and Results of Operations” of our most recent Annual Report on Form 10-K and our subsequently filed Quarterly Reports on Form 10-Q, as supplemented by our other filings
with the Securities and Exchange Commission.

                                                                                                                                                                                               2
INVESTMENT THESIS
Solar Market
• Global Solar Demand Continues to Be Strong
• 2019 Expected Demand of ~100 to 120 GWs*
• Cost of Solar Competitive with Traditional Generation Sources
  In Many Markets (With No Fuel Price Risk)

First Solar Advantage
• Differentiated Thin Film Technology
    — Combines Low Cost and High Efficiency

                                                                                4 January 2019 © Copyright First Solar, Inc.
• Proven Track Record with >17 GWs of Modules Sold Globally
• Industry Leading Balance Sheet
    — Allows for Investment in Disruptive Technology Roadmap

* Estimates from IHS PV Installations Tracker Q4 2018 & GTM PV Pulse Nov 2018            3
CORPORATE OVERVIEW

SOLAR ENERGY IS COMPETITIVE TODAY ON AN UNSUBSIDIZED BASIS
$0.30
$0.25
$0.20
$0.15
$0.10
4 January 2019 © Copyright First Solar, Inc.
$0.05
$-
Coal Nuclear Gas CC Gas Peaking Diesel First Solar
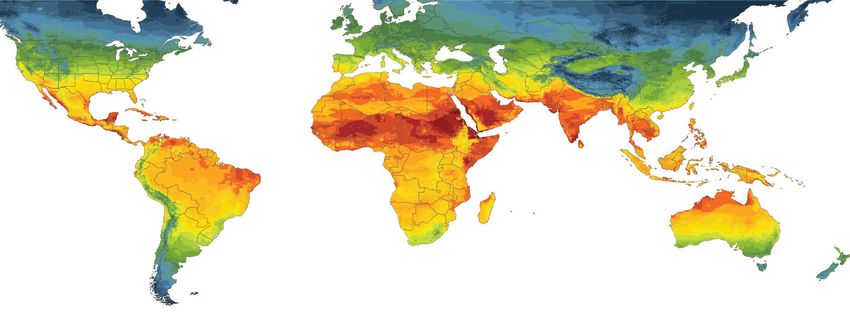
Source: Lazard Levelized Cost of Energy Analysis – Version 12. First Solar LCOE excludes ITC benefit and assumes a 50MW system in a high insolation region, such as the Southwest U.S. 5
FIRST SOLAR AT A GLANCE

     Over 17GW sold worldwide and
     over $14.5B in project financing facilitated

     Partner of choice for leading utilities
     and global power buyers since 2006

     Solar energy that is economically
     competitive with fossil fuel

                                                    4 January 2019 © Copyright First Solar, Inc.
     Strongest financial stability &
     bankability in the industry

                                                             6
TRUSTED PARTNER

                  “We create enduring
                  value for our customers
                  by powering their worlds

                                                 4 January 2019 © Copyright First Solar, Inc.
                  through clean and
                  affordable energy.”
                               — Mark Widmar
                               First Solar CEO
                                                          7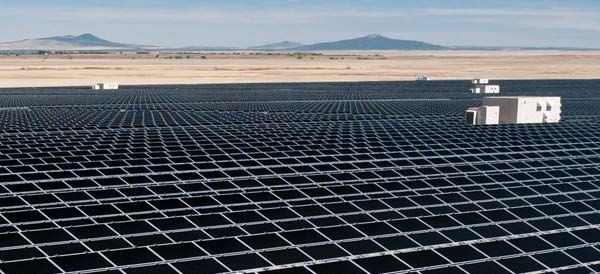
TECHNOLOGY & MANUFACTURING ADVANTAGE
FIRST SOLAR MANUFACTURING ADVANTAGE
              First Solar Fully Integrated, Automated and Continuous Thin Film Process

                           < 3.5                                       •   Large glass substrate vs. individual Si wafers
                           HRS           1 Factory                     •   Fully integrated, continuous process
              Semi-                       Final        First Solar     •   98% less semiconductor material vs Si
 GLASS        conductor     Cell          Assembly      MODULE             Quality controlled under one roof
              Deposition    Definition    & Test
                                                                       •

                      Output                  Output                  Output                    Output
Polysilicon

                                                                                                                            4 January 2019 © Copyright First Solar, Inc.
                       Ingot                  Wafer                  Solar Cell                 Module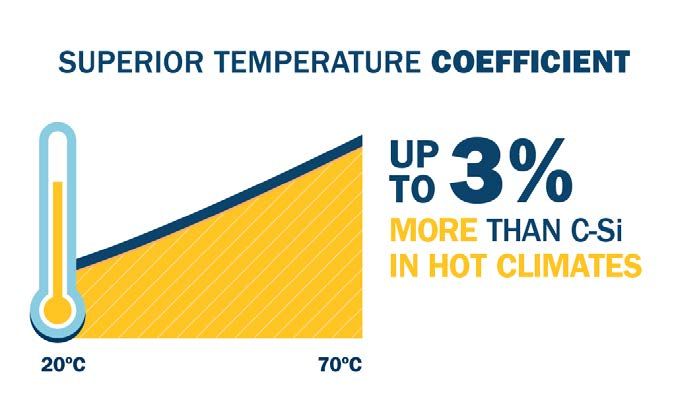
SPECIFIC ANNUAL ENERGY YIELD ADVANTAGE
(RELATIVE TO FRAMED BSF AND PERC, MULTI AND MONO)

                                                    4 January 2019 © Copyright First Solar, Inc.
                                                    10
ENERGY YIELD ADVANTAGE VS. C-SI
4 January 2019 © Copyright First Solar, Inc.
Powered by:
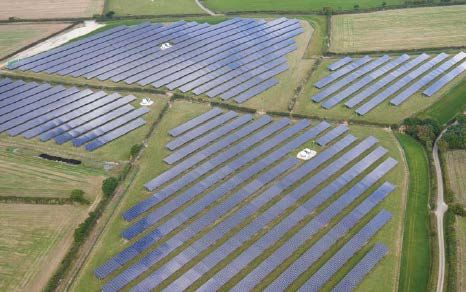
11PROVIDING THE LEADING ECO-EFFICIENT PV TECHNOLOGY
proven energy • Validated by 3rd party research and global peer
advantage reviews
• Higher energy yields at a competitive cost
economically
competitive • Fastest energy payback time < 1 year
with fossil fuel
• Smallest carbon footprint and air pollutants
lowest • Lowest life cycle water use
environmental
4 January 2019 © Copyright First Solar, Inc.
impacts • Industry leading PV recycling program
Creating MORE VALUE with LESS ENVIRONMENTAL IMPACT.
Seitz et al., Eco-Efficiency Analysis of Photovoltaic Modules, Bavarian State Ministry of Environment and Health, 2013. 12PRODUCT ROADMAP & SERIES 6 ADVANTAGE
CORPORATE STRATEGY

                           MODULES                           SYSTEMS                     SALES & DEVELOPMENT

                  • Series 4: Ramping down         • Structures: Internal Tracker       • Module Sales: Reduced direct
2016 and 2017
 Repositioning

                                                     and Fixed Tilt discontinued          sales presence in markets
                  • Series 5: Discontinued                                                serviced via partnerships
                                                   • EPC: Capabilities right-sized to
                  • TetraSun: Discontinued           development portfolio              • Development: Refocus on
                                                                                          core and scalable markets
                  • Module Plus: Discontinued      • OM: Exited Skytron (Europe)

                  • Series 4: Through 2020, 1GW    • Structures: 3rd party suppliers    • Module sales: Direct presence
2018 and beyond

                    optionality thereafter                                                in US, Western Europe, India
                                                   • EPC: US only

                                                                                                                          4 January 2019 © Copyright First Solar, Inc.
                                                                                          Middle East, Japan, Australia
     Focus

                  • Series 6: 6.6 GW by year-end
                    2020, across US, Malaysia      • OM: US, Japan, Australia           • Development: Multi-gigawatt
                    and Vietnam                                                           pipeline across US, Japan,
                                                                                          Australia, India

                                                                                                                          14
SERIES 6 MODULE GROSS MARGIN
Indicative / Not To Scale
>20%**
15-20%
~12%*UPDATED CAPACITY ROADMAP AS OF DEC 11, 2018
MALAYSIA S4 FACTORY 1 – 1000MW NAMEPLATE S6 CONVERSION TBD
MALAYSIA S4 FACTORY 2 – 1000MW NAMEPLATE MALAYSIA S6 FACTORY 2 – 1200MW NAMEPLATE
OHIO S6 FACTORY – 600MW NAMEPLATE
MALAYSIA S6 FACTORY 1 – 1200MW NAMEPLATE
VIETNAM S6 FACTORY 1 – 1200MW NAMEPLATE
VIETNAM S6 FACTORY 2 – 1200MW NAMEPLATE
4 January 2019 © Copyright First Solar, Inc.
OHIO S6 FACTORY 2 – 1200MW NAMEPLATE
2018 2019 2020
Q1 Q2 Q3 Q4 Q1 Q2 Q3 Q4 Q1 Q2 Q3 Q4
*Diamonds indicate actual or expected start of production 16MODULE PRODUCTION VOLUME AS OF DEC 11, 2018
GW
6.0 5.2 – 5.5GW 5.0 – 5.5GW
2019-2020
5.0 Series 4 ~2GW
Series 6 ~8GW to ~9GW
4.0
Total ~10GW to ~11GW
3.0
2.0
1.0
4 January 2019 © Copyright First Solar, Inc.
0.0
2018 2019 2020
Series 4 Series 6 Series 6 upside
Series 6 Production Growing to >5GW by 2020
17BOOKINGS, FINANCIALS & GUIDANCE
EXPECTED MODULE SHIPMENTS(1) SYSTEMS + THIRD-PARTY MODULE
GWDC
                                                                                                             0.8 GW
12
                                                                             4.4 GW                                                        11.3 GW
10
               7.8 GW
 8

 6
                                             (1.7) GW
 4

 2

            Dec 31, 2017                   YTD Shipments                   YTD Bookings                   QTD Bookings                    Oct 25, 2018 (3)
                                         as of Sep 30, 2018             as of Sep 30, 2018                   Q4'18 (2)
The above table presents the actual module shipments for 2018 through Sep 30, 2018, new module volume bookings through Oct 25, 2018, and the expected

                                                                                                                                                                 4 January 2019 © Copyright First Solar, Inc.
module shipments beyond Oct 25, 2018. A module is considered to be shipped when it leaves one of our manufacturing plants. Expected module shipments do not
have a direct correlation to expected revenues as expected module shipments do not represent total systems revenues and do not consider the timing of when all
revenue recognition criteria are met, including timing of module installation.
(1) Expected Module Shipments includes systems projects and contracted 3rd party module-only sales. Systems projects include (a) under sales agreement, (b)
    executed PPA not under sales agreement and (c) no PPA and not under sales agreement, but electricity to be sold on an open contract basis.
(2) Reflects new bookings from Oct 1, 2018 to Oct 25, 2018. Q4 QTD bookings of 0.9GW, reduced by 0.1GW of de-bookings.
(3) Balance includes remaining shipment volumes as of Sep 30, 2018 and bookings through Oct 25, 2018. Shipments from Oct 1 to Oct 25, 2018 not deducted.
                                                                                                                                                                 19
EXPECTED MODULE SHIPMENTS TO SYSTEMS PROJECTS AS OF DEC 11, 2018
GWDC Booked Systems Shipments + Mid-to-Late Stage Opportunities
1.6
1.4
1.2
1.0
0.8
0.6
0.4
0.2
4 January 2019 © Copyright First Solar, Inc.
0.0
2018 * 2019 2020 2021
Booked / Signed (Development) Booked (EPC) Opportunity (Development) Average Annual Bookings Target
Total Systems Pipeline of 4GWDC ; Including 2.4GWDC Booked or Signed
*Includes year-to-date shipments and forecasted remaining shipments for 2018. 20INDUSTRY LEADING BALANCE SHEET
3,000 Net Cash Position
Net (Debt)/Cash in $ millions
2,000
1,000
0
Defaulted
(1,000)
(2,000)
Net Debt Position
(3,000)
4 January 2019 © Copyright First Solar, Inc.
First Solar Competitor A Competitor B Competitor C Competitor D Competitor E
Net Interest
$36M ($78M) ($29M) ($100M) ($42M) ($104M)
Income (Exp)
Source: Net cash/debt based on Q2 & Q3 2018 public filings. Net interest expense is last 12 months as reported in company filings. 21EFFECTIVE OPEX MANAGEMENT
$M $/W
400 386 387 0.20
305
291
300 0.15
260
255 262
200 200 0.10
203
175
100 0.05
131 125
89 85 105
4 January 2019 © Copyright First Solar, Inc.
0 0.00
2015 2016 2017 2018E 2019E
R&D SG&A OpEx per Watt produced
Lowering Operating Expense Per Watt and Increasing Investment in R&D
*2018 and 2019 operating expense based on mid-point of guidance range. Excludes restructuring and plant start-up. 222019 GUIDANCE: CERTAIN ASSUMPTIONS AS OF DECEMBER 11, 2018
PRODUCTION • 5.2 – 5.5GWDC
VOLUME: • Series 6: 3.2 – 3.5GW; Series 4: ~2GW
VOLUME • >5GWDC
SOLD: • Module: ~4GW; Systems: >1GW
NET SALES • ~40 - 45% module
MIX: • ~55 - 60% systems
SERIES 6 • Ramp Cost (COGS): $20 - $30M
EXPANSION:
4 January 2019 © Copyright First Solar, Inc.
• Plant Start-Up (OPEX): $90 - $100M
SAFE • $325 to $375M of investment
HARBOR: • Preserves 30% ITC for ~5 gigawatts of projects
232019 GUIDANCE AS OF DECEMBER 11, 2018
2019 Guidance
Net Sales $3.25B to $3.45B
Gross Margin (%)1 20% to 21%
Operating Expenses2 $390M to $410M
Operating Income $260M to $310M
Earnings Per Share $2.25 to $2.75 SERIES 6
Net Cash Balance3 $1.6B to $1.8B
Capital Expenditures $650M to $750M
4 January 2019 © Copyright First Solar, Inc.
Shipments 5.4GW to 5.6GW
• $20M to $30M of ramp impact included in COGS
• $90M to $100M of plant start-up included in Operating Expenses
1 – Includes $20 to $30M of ramp cost. 2 – Includes $90 to $100M of plant start-up expense. 3 – Cash, marketable securities and restricted cash less expected debt at the end of 2019. 24You can also read