HTA Market Update
JANUARY 2021
←
→
Page content transcription
If your browser does not render page correctly, please read the page content below

HTA Market Update JANUARY 2021

Contents
3.   Overview: the story this month
4.   Garden centre sales 2020 – a summary
5.   Garden centre sales: December
6.   Garden centre sales: detailed December breakdown
7.   Garden centre sales: December Average Transaction Values
8.   Consumer confidence: financial
9.   HTA Member Business Confidence – Q4 2020
10. HTA Member Business Confidence – Q4 2020 - continued
11. The UK Economy – inflation & pay growth
12. Vehicle fuel prices – petrol & diesel
13. Water – river flows
14. Water – groundwater levels
15. Weather
16. Closing comments

                                                                2
Overview: the story this month
       The overall picture for garden centre sales saw a 13% drop on December 2019 nationally, amidst
       tougher coronavirus restrictions across much of the UK and particularly in Wales, Scotland and
       Northern Ireland.
       However, garden and gardening categories continue to thrive, with the standout growth in sales of
       plant care products, for which sales were 45% higher than the same month in 2019. Bedding plant
       sales increased by 13% on December 2019 levels, and hardy plants, shrubs and trees were also up
       11% from December 2019 levels.
       Unsurprisingly, catering continued to suffer and was down 64% compared to December 2019, but
       this does suggest some outlets may have compensated for cafe closures by offering takeaway
       options.
       After a strong November, Christmas categories recorded sales 19% below those in December 2019.
       However, Christmas sales for the year are up by 7%, implying that October and November saw
       Christmas sales that might normally have been in December.
       Encouragingly, average transaction values were up 33% in the garden store for December,
       compared with December 2019.
       December showed a promising rise in consumer confidence, possibly due to the rollout of the
       national vaccination programme. The Major Purchase Index also rose by 6 points. It should be
       noted that this data predates the announcement of the January lockdown in England.
       In this edition we have produced an updated Business Confidence Index, assessing members’
       confidence in sales and a range of areas of investment over the next 12 months. This will be
       reported on a quarterly basis via HTA Market Update. The HTA member business outlook in Q4 2020
       shows a drop in business confidence from 0.18 in Q3, to 0.02 in Q4, on the scale where -1 is 100%
       negative and 1 is 100% positive.

HTA Market Update January 2021 > JANUARY EDITION OVERVIEW                                                  3
Garden centre sales 2020 – a summary
2020 began strongly, with garden centre sales nationally up 9% in January
compared with January 2019. February sales were down 7% on February of last        2020      Vs. same month   Calendar year to
year, which was exceptionally warm for the time of year. In the second half of
March, the lockdown measures imposed to fight the spread of coronavirus led
                                                                                                   2019       month vs. 2019
sales 20% lower than March 2019. Whilst in April, nationally sales were 83%
down on April 2019, as some retailers turned to the online channel.
                                                                                  January         +9%               +9%
On May 11th, garden centres in Wales were given the go ahead to reopen; whilst   February         -7%                =
England, Northern Ireland and Scotland and followed suit on May 13th, 18th and
28th respectively. Sales within garden/gardening categories performed
exceptionally well, finishing May only 1% down nationally on May 2019 which        March         -20%              -10%
comparatively featured a full month of trading.
                                                                                   April         -83%              -39%
Sales throughout June, July and August continued to recover well with
particularly strong sales of garden/gardening ranges; reducing the gap
between calendar year comparisons. In September, non-garden/gardening              May           -22%              -35%
categories also showed sign of recovery.
                                                                                   June          +34%              -25%
This continued into October with overall sales up 17% compared with October
2019. Strong garden/gardening category sales were again largely responsible
and non-garden/gardening ranges showed positive signs of recovery.                 July          +17%              -20%
In November, overall sales were 11% up on the same month of last year, largely    August         +19%              -17%
driven by strong garden/gardening sales (+60%) and increased average
transaction values (+51%).
                                                                                 September       +25%              -13%
December saw variations across the UK in restrictions, and despite continued
strong garden category sales, nationally sales were -13% on December 2019.        October        +17%              -12%
Despite many fewer weeks trading time due to lockdowns, national garden
centre sales finished 2020 -10% down on the 2019 calendar year.
                                                                                 November        +11%              -10%
A full breakdown of December garden centre sales follows on the next few
pages.
                                                                                 December        -13%              -10%

HTA Market Update January 2021 > GARDEN CENTRE SALES                                                                     4
Garden centre sales: December
  In December, garden and gardening categories again performed strongly, whilst the continued closure of
  cafes/restaurants across majority of the UK impacted non-garden/gardening category figures to record December
  2020 sales 13% below December 2019 nationally. Despite restricted and much fewer trading time, the calendar year
  2020 finished 10% down overall on 2019. However, notably garden and gardening categories finished the year % up on
  2019 as a whole.

                                Overall                                               How are these figures calculated?
                                                  Garden / Non-garden /
                                                 gardening gardening                  The national sales figures we report each month
                                                                                      come from the HTA Garden Retail Monitor (GRM)
 Dec 2020 vs Dec 2019
                                                                                      system. We’ve now moved over to a newer GRM
                                  13%               21%              20%              system where sales data from submitting garden
                                                                                      centres is automatically uploaded to a secure
                                                                                      server via the EPOS system. These garden centres
                                                                                      can then login to the portal to benchmark their
                                                                                      sales against regional and national averages for a
                                                                                      variety of sales metrics. We’re looking to sign up
                                                                                      more garden centres to the system, allowing us to
                                                  Garden / Non-garden /               include more reliable detailed breakdowns of
                                                                                      trends in sales in these Market Update reports.
  Calendar year to end of                        gardening gardening
        December                  10%                                                 If you’re interested or for more information visit:
                                                                     25%              hta.org.uk/grm
       2020 vs 2019                                  3%

                                                                                                             Source: HTA Garden Retail Monitor

HTA Market Update January 2021 > GARDEN CENTRE SALES                                                                                5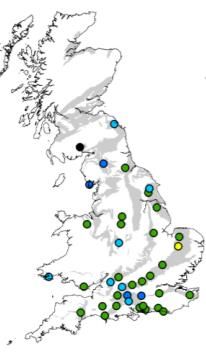
Garden centre sales: detailed December breakdown
     Category            December 2020 vs 2019   Calendar year 2020 vs 2019
   Bedding plants               +13%                       -11%
Hardy plants, shrubs &                                                        Strong sales of plants, plant care
        trees                   +11%                        1%                products and equipment, continued
                                                                              into December as tougher restrictions
    Houseplants                  +6%                       +9%                were placed across much of the UK and
                                                                              the stay at home message introduced
        Seeds                   +73%                      +17%                once again.
 Plant care products            +45%                      +15%                Christmas category sales were down in
   Garden tools &                                                             December on December of 2019,
    equipment                    +4%                       +1%                following strong 45% growth in
                                                                              November on the same month of 2019.
        Bulbs                   -19%                       +7%                This is likely to be as a result of tougher
                                                                              restrictions on parts of the UK (Wales,
      Christmas                 -19%                       +7%                Northern Ireland and Scotland in
                                                                              particular) but also suggests consumers
  Food & farm shop               -3%                      +10%                may have started their Christmas
                                                                              festivities and shopping earlier than
    Wild bird care               -5%                       -6%                usual in 2020, to ensure preparedness
                                                                              or extend the feel-good time of year; as
   Indoor living &                                                            the Christmas category finished 2020
     homewares                    =                        -5%                7% up on the 2019 calendar year.
       Gifting                   -5%                       -15%
        Pets                      =                        -13%
                                                                                           Source: HTA Garden Retail Monitor
      Catering                  -64%                       -57%
HTA Market Update January 2021 > GARDEN CENTRE SALES DECEMBER BREAKDOWN                                             6
Garden centre sales: December Average
Transaction Values (ATVs)
The average garden store transaction value was up by 33% in December 2020 to £25.98, compared with
December 2019.
Garden store
25.98 (EXC. VAT)
DEC 2020
VS DEC 2019
+33%
Source: HTA Garden Retail Monitor
HTA Market Update January 2021 > GARDEN CENTRE SALES ATV 7Consumer confidence: financial
Consumer confidence shows a positive end to 2020 (although this data does predate the third lockdown). The
national vaccination programme may have lifted spirits and inspired hope. The 15-point leap in consumer views on
the future economy stands out: a change of that magnitude for that measure has not been measured since April/May
Click to view the
2011. The renewed expectations on personal finances looking ahead are also welcome, while the six-point uptick in
full summary
the Major Purchase Index is good news for online retailers and garden centres which are deemed ‘essential’ in
10 England and can remain open during the third national lockdown, as consumers feel more confident to make larger
ticket purchases. Overall
0 index
Jul-18
Jul-13
Jul-15
Jul-16
Jul-17
Jul-19
Jul-20
Nov-20
Jan-13
Nov-13
Jan-14
May-14
Jul-14
Nov-14
Jan-15
Nov-15
Jan-16
Nov-16
Jan-17
Nov-17
Jan-18
Nov-18
Jan-19
Nov-19
Jan-20
Mar-13
May-13
Mar-14
Mar-15
May-15
Mar-16
May-16
Mar-17
May-17
Mar-18
May-18
Mar-19
May-19
Mar-20
May-20
Sep-13
Sep-16
Sep-14
Sep-15
Sep-17
Sep-18
Sep-19
Sep-20
score:
*
-10
-20 -26
Overall consumer confidence index score (see purple line for trendline)
-30 *this is 15 points lower
than December 2019
Measure Relative score vs. December
-40 Consumers are asked how the financial position of
2019
their household has changed over the last year and
Personal financial situation: is expected to change in the next year, as well as
during last 12 months -9 6 points lower that of the general economy. They’re also asked if
over next 12 months 3 = they believe ‘now’ is a good time to make major
General economic situation: purchases or to be saving money. The first three
during last 12 months -65 34 points lower measures in the table make up the overall index
over next 12 months -35 8 points lower score. Whilst the Savings Index indicates whether
consumers are looking to save rather than spend
Major Purchase Index -22 25 points lower their money. Relative scores are given as a
comparative to when records began in 1974.
Savings Index 17 1 point lower
Source: GfK
HTA Market Update January 2021 > CONSUMER CONFIDENCE: FINANCIAL 8HTA Member Business Confidence – Q4 2020
Every quarter, members are asked how positive or negative they feel about the outlook for their business for the next 3 and 12
months respectively. We’ve tracked this since 2012, and outlook generally remains very stable over time. As shown in the graph
above, business outlook crashed in Q1 2020 when the impacts of COVID-19 began to take affect. However, both short- and
longer-term business outlook have steadily increased in Q2 and Q3 2020. The long-term business outlook continued to improve
in Q4 2020, though the short-term outlook experienced a slight drop on Q3 2020 levels.
HTA member business outlook
(1 = very negative, 7 = very positive)
7
6
5
4
3
2
1
Short term business outlook (next 3 months) Long term business outlook (next 12 months)
Source: HTA Member Voice Survey
HTA Market Update January 2021 > HTA MEMBER BUSINESS CONFIDENCE Q4 2020 9HTA Member Business Confidence – Q4 2020
How the index score works
Each quarter, members are asked about their expectations for the next 12 months in terms of sales, staff and investments – these
measures constitute the overall index score. The responses are weighted to ensure they are representative of HTA membership
overall; and an index score is generated for each measure by subtracting the proportion of responses towards the negative end of the
scale from the those at the positive end to produce a score between -1 and 1. An average of these scores is then calculated to
produce an overall index score that can be tracked over time and reported on a quarterly basis. So, the closer the score is to 1, the
more positive and confident HTA members are feeling.
Index
Overall *This is 0.16
In the next 12 months… Negative Positive score
index lower than
(positives – negatives)
What do you expect will happen to your score: Q3 2020
business’…
Volume of sales -64% 20% -0.45 0.02
Number of employees -34% 7% -0.27
Each measure used in the index score uses a 5-point scale allowing
Do you expect your business will invest in… clear positive and negative ends of the spectrum to be identified (as
Skills & staff training -33% 58% 0.25 shown on the graph to the left). These scales are:
(Expected sales/staff): Decrease a lot, decrease a little, stay the
same, increase a little, increase a lot
New tech/IT infrastructure -35% 49% 0.14 (Expected investments): No, probably not, unsure, probably yes,
definitely
New products/services -32% 51% 0.18 The main change from the previous quarter is in expectations of
future sales volumes, which, in Q3, 1 in 2 members thought would
increase. However, in Q4 this figure drops to just 1 in 5, and 64%
New infrastructure/buildings/premises -37% 51% 0.14 indicate will decrease. The percentage of members expecting that
the number of employees in the next 12 months would increase also
Targeting new customers -27% 45% 0.18 dropped from 28% in Q3 to 7% in Q4. Two measures that have
become more positive are those believing they will invest in skills
and staff training (from 48% to 58%), and in new infrastructure,
-100% 0% 100% buildings and premises (46% to 51%).
Source: HTA Member Voice Survey
HTA Market Update January 2021 > HTA MEMBER BUSINESS CONFIDENCE Q4 2020 10The UK Economy
10%
9%
8% RPI inflation
7%
6% Ave. total pay growth
5%
4%
3%
2%
1%
0%
Aug 2011
Dec 2011
Feb 2012
Aug 2012
Dec 2012
Feb 2013
Aug 2013
Dec 2013
Feb 2014
Aug 2014
Dec 2014
Feb 2015
Aug 2015
Dec 2015
Feb 2016
Aug 2016
Dec 2016
Feb 2017
Aug 2017
Dec 2017
Feb 2018
Aug 2018
Dec 2018
Feb 2019
Aug 2019
Dec 2019
Feb 2020
Aug 2020
Jun 2015
Jun 2016
Jun 2017
Jun 2018
Jun 2019
Apr 2019
Oct 2011
June 2012
June 2013
Apr 2014
June 2014
Oct 2016
June 2020
Apr 2012
Oct 2012
Apr 2013
Oct 2013
Oct 2014
Apr 2015
Oct 2015
Apr 2016
Apr 2017
Oct 2017
Apr 2018
Oct 2018
Oct 2019
Apr 2020
Oct 2020
-1%
We take a look at some key indicators of the position of the UK economy to gauge the
situation for consumers as well as member businesses. Both inflation and average
RPI pay growth (excl. bonuses) are measured as a percentage change over a 12 month Average
inflation:
period. pay
growth:
0.9%
In November, the rate of inflation dropped to 0.9%, whilst average pay growth in
2.8%*
October increased to 2.8%. The data on pay growth continues to be affected by the
distorting impacts of the Covid-19 crisis on the UK employment market. Much of the
apparent pay growth to October 2020 when compared with a year ago is influenced
by the fact that large numbers of lower-paid jobs across the economy have been lost
or furloughed when compared with the same time in 2019; other factors such as a fall *Note: this is
in employees entering the job market have also inflated the pay growth measure. October’s figure –
More detailed context on interpreting this measure is available the latest release
on http://bit.ly/2XuMcBX Source: ONS
HTA Market Update January 2021 > THE UK ECONOMY 11Vehicle fuel prices
Pence per litre (ppl)
160
150 Unleaded petrol in PPL
Diesel in PPL
140
130
120
Click to view the full
110 summary report and
regional breakdowns
100
90
Jan-10
Jan-11
Jan-12
Jan-13
Jan-14
Jan-15
Jan-16
Jan-17
Jan-18
Jan-19
Jan-20
Jul-10
Jul-11
Jul-12
Jul-13
Jul-14
Jul-15
Jul-16
Jul-17
Jul-18
Jul-19
Jul-20
Mar-10
May-10
Mar-11
May-11
Mar-12
May-12
Mar-13
May-13
Mar-14
May-14
Mar-15
May-15
Mar-16
May-16
Mar-17
May-17
Mar-18
May-18
Mar-19
May-19
Mar-20
May-20
Nov-11
Nov-15
Sep-17
Sep-10
Nov-10
Sep-11
Sep-12
Nov-12
Sep-13
Nov-13
Sep-14
Nov-14
Sep-15
Sep-16
Nov-16
Nov-17
Sep-18
Nov-18
Sep-19
Nov-19
Sep-20
Nov-20
We also monitor vehicle fuel prices to gauge the situation for consumers and
businesses alike. Figures reported are national averages, measured in price per
Petrol litre. For regional breakdowns click or tap here to view the AA’s fuel reports. Diesel
(ppl): (ppl):
In November, fuel prices remained stable, despite dropping during the first
114 national lockdown in March. Since the announcement of a third national
lockdown, delivery services are likely to be busy once again.
117
Source: AA
HTA Market Update January 2021 > VEHICLE FUEL PRICES 12Water – River flows
The charts show the expected probabilities of above or below average river flow levels in the coming months.
Essentially, the more yellow, orange or red that appears in a chart, the greater the probability of below normal levels in
the area and an increased probability of water shortages. The HTA will continue to monitor and update you on the
water situation via the website hta.org.uk.
The full reports contain a
much more
comprehensive picture
of the forecast water
situation, including
rainfall required to
overcome below normal
conditions.
For the full
reports
click here
River flows were normal in December, and although over the next 3 months river flows across England and Wales are most
likely to be in the Normal range to Above normal, flows across Scotland and the North East are likely to be Above normal or
higher.
Source: Centre for Ecology and Hydrology
HTA Market Update January 2021 > WATER 13Water – Groundwater levels
The charts show the expected probabilities of above or below average groundwater levels in the coming months.
Essentially, the more yellow, orange or red that appears in a chart, the greater the probability of below normal levels in
the area and an increased probability of water shortages. The HTA will continue to monitor and update you on the
water situation via the website hta.org.uk.
1 month outlook 3 month outlook The full reports contain a
much more
comprehensive picture
of the forecast water
situation, including
rainfall required to
overcome below normal
conditions.
For the full
reports
click here
The short term outlook predicts largely normal groundwater levels across the UK, with some areas of the North and South
experiencing above normal levels. Over the next three months, normal to notably high groundwater levels are predicted.
Source: Centre for Ecology and Hydrology
HTA Market Update January 2021 > WATER 14Weather
December 2020 was both the wettest month in 5 years, and had the highest number of rainy days!
Dec Dec Dec Dec
The figures reported are
2020 2019 2020 2019 national averages for
the UK. To view the
figures on a regional
38 48 162 119 basis: click or tap here
Hours of to visit the MET Office
sunshine Rainfall (mm)
website and view the
year ordered stats by
month.
Dec Dec Dec Dec
2020 2019 2020 2019
21 17 4 5
Mean temperature
No. of rain days
(Celsius)
Source: MET Office
HTA Market Update January 2021 > WEATHER 15Closing comments
We hope you enjoyed the format and content of
this Market Update.
If you have any questions or would like to see
something else included, please don’t hesitate to
contact marketinfo@hta.org.uk
16You can also read