STRONG RECOVERY IN H2 WITH RECORD MARGIN AND EXCELLENT CASH CONVERSION - 2020 FULL YEAR RESULTS PRESENTATION

Page created by Elaine Simon
 
CONTINUE READING
STRONG RECOVERY IN H2 WITH RECORD MARGIN AND EXCELLENT CASH CONVERSION - 2020 FULL YEAR RESULTS PRESENTATION
STRONG RECOVERY IN H2
WITH RECORD MARGIN AND
EXCELLENT CASH CONVERSION
2020 FULL YEAR RESULTS PRESENTATION
2 March 2021
STRONG RECOVERY IN H2 WITH RECORD MARGIN AND EXCELLENT CASH CONVERSION - 2020 FULL YEAR RESULTS PRESENTATION
CAUTIONARY STATEMENT REGARDING
FORWARD-LOOKING STATEMENTS

This presentation contains certain forward-looking statements with respect to the
financial condition, results, operations and business of Intertek Group plc.
These statements and forecasts involve risk and uncertainty because they relate to
events and depend upon circumstances that will occur in the future.
There are a number of factors that could cause actual results or developments to differ
materially from those expressed or implied by these forward-looking statements and
forecasts.
Nothing in this presentation should be construed as a profit forecast.

2 March 2021
STRONG RECOVERY IN H2 WITH RECORD MARGIN AND EXCELLENT CASH CONVERSION - 2020 FULL YEAR RESULTS PRESENTATION
01             02                03                 04            05
Performance   2020 Financial   Divisional Review     Growth        2021 Outlook
 Highlights      Results                           Opportunities
STRONG RECOVERY IN H2 WITH RECORD MARGIN AND EXCELLENT CASH CONVERSION - 2020 FULL YEAR RESULTS PRESENTATION
LASER FOCUSED OPERATIONAL DISCIPLINE
STRONG RECOVERY IN H2 WITH RECORD MARGIN AND EXCELLENT CASH CONVERSION - 2020 FULL YEAR RESULTS PRESENTATION
INTERTEK’S HEROES MADE A BIG DIFFERENCE IN 2020

    Blood Donations                                                                     Medical Beds                                                                      Community Support
               Intertek Taiwan                                                     Chirag Parikh, Production Engineer,                                                             Azer Sanili, IT Manager
  70 colleagues responded to the Taiwan                                                     Intertek Electrical                                                                       Intertek Azerbaijan
   Blood Services Foundation’s ‘red alert’                                         Worked long hours and weekends to                                                         Set up local donation initiative called
  calling for volunteers to donate blood in                                        complete urgent project on medical                                                     “Bigane Qalma”, that provided 45 families
            the wake of Covid-19.                                                    beds built for those with severe                                                          affected by the pandemic with
                                                                                             lung congestion.                                                                           relief packages.

                                               Hand Sanitiser                                                                       Face Masks
                                                                                                                                Ludwig Laibahas, HR Manager
                                                Analytical & Textiles labs
                                                                                                                                       Intertek Indonesia
                                                   Intertek Bangladesh
                                                                                                                         Provided face masks to colleagues in countries
                                        Produced hand sanitizer and set up a ‘virtual
                                                                                                                         greatly affected by Covid-19, sending 154k to
                                            hospital’ with oxygen tanks to help
                                                                                                                             HK, Taiwan, Korea, Philippines, China,
                                              colleagues and their families .
                                                                                                                                    Singapore and Malaysia.

                                                                                                                                                                                                                       5
STRONG RECOVERY IN H2 WITH RECORD MARGIN AND EXCELLENT CASH CONVERSION - 2020 FULL YEAR RESULTS PRESENTATION
GLOBAL INNOVATIONS SUPPORTING THE NEEDS OF OUR CLIENTS

Insert Footer Here                                           6
                                                         1
0
STRONG RECOVERY IN H2 WITH RECORD MARGIN AND EXCELLENT CASH CONVERSION - 2020 FULL YEAR RESULTS PRESENTATION
PERFORMANCE AHEAD OF EXPECTATIONS IN EARNINGS AND CASH

                                                                                                                                  YoY                             YoY
                                                                   2020​                          2019​
                                                                                                                             (Actual rates)                 (Constant rates)
 Revenue                                                      £2,741.7m                      £2,987.0m                             (8.2%)                            (6.7%)

 Like-for-like revenue1                                       £2,735.9m                      £2,983.3m                             (8.3%)                            (6.8%)

 Operating Profit2                                              £427.7m                        £524.2m​                           (18.4%)                           (17.0%)

 Adjusted Operating Margin2                                       15.6%                          17.5%​                          (190bps)                          (190bps)

 Adjusted diluted EPS2                                           170.9p                          212.5p                           (19.6%)                           (18.1%)

 Adjusted FCF2                                                  £435.6m                        £395.3m                             10.2%

 Financial net debt                                             £419.9m                        £629.4m                            (33.3%)
 Financial Net debt / Adjusted
                                                                    0.7x                           0.9x
 EBITDA 2
 ROIC                                                             21.6%                          23.7%                           (210bps)                          (190bps)
                                                                                                                                                                                                             7
Notes: (1) Like-for-like revenue includes acquisitions following their 12 month anniversary of ownership and removes the historical contribution of any business disposals/closures; (2) Before separately
disclosed items; (3) Guidance as at November IMS
STRONG RECOVERY IN H2 WITH RECORD MARGIN AND EXCELLENT CASH CONVERSION - 2020 FULL YEAR RESULTS PRESENTATION
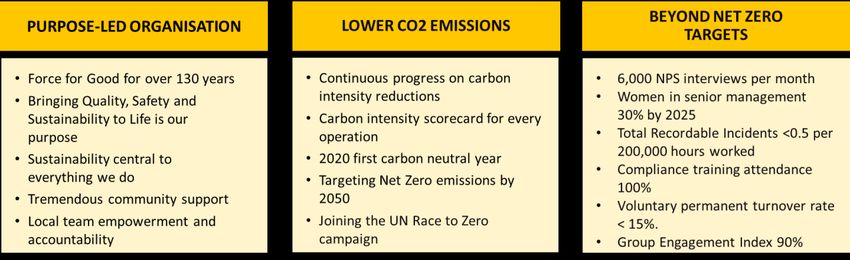
STRONG H2 RECOVERY WITH RECORD MARGIN
                                              Revenue                        Operating Profit1
                                                 +8%             1,411              +56%         260
                                 1,331

                                                                           168

                                 H1 20                           H2 20   H1 20                  H2 20

                                  Operating Profit Margin1                       Diluted EPS1
                                                 +570
                                                                 18.4%              +73%        107.8p
                                                  bps
                                12.6%
                                                                         63.1p

                                 H1 20                           H2 20   H1 20                  H2 20

Note: Growth rates and bps movement at constant currency; (1) Adjusted                                   8
STRONG RECOVERY IN H2 WITH RECORD MARGIN AND EXCELLENT CASH CONVERSION - 2020 FULL YEAR RESULTS PRESENTATION
BROAD BASED RECOVERY IN H2
                                       Revenue (£m)                      Operating profit (£m) 1   Operating Profit Margin1
                                                          881                                               +760
                                                +12%                              +61%   216                        24.5%
                                                                                                             bps
                                      800
                                                                                                    16.9%
 Products                                                                 136

                                     H1 20              H2 20             H1 20          H2 20      H1 20          H2 20
                                                                                                            +240
                                                +4%
                                                          298                     +40%    27                 bps
                                                                                                                   9.1%
                                      295
                                                                                                    6.8%
                                                                           20
    Trade

                                     H1 20              H2 20             H1 20          H2 20      H1 20          H2 20
                                                                                                            +160
                                                         232
                                                                                  +28%                             7.1%
                                      236                                                 16                 bps
                                                                                                    5.3%
                                                                           13
Resources

                                     H1 20              H2 20             H1 20          H2 20      H1 20          H2 20

Note: Growth rates and bps movement at constant currency; (1) Adjusted
                                                                                                                              9
STRONG RECOVERY IN H2 WITH RECORD MARGIN AND EXCELLENT CASH CONVERSION - 2020 FULL YEAR RESULTS PRESENTATION
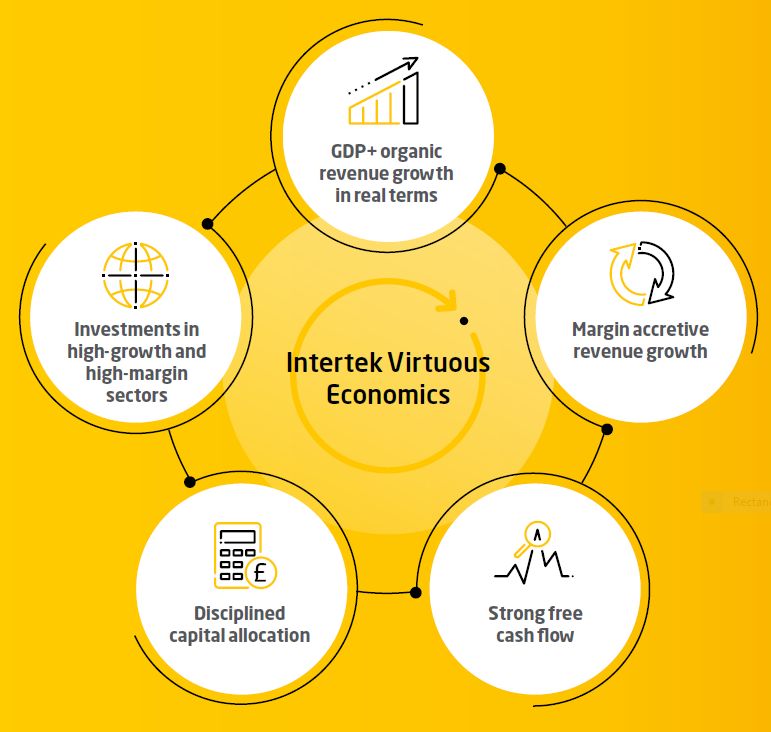
HIGHLY CASH GENERATIVE EARNINGS MODEL DELIVERS
01             02                03                 04            05
Performance   2020 Financial   Divisional Review     Growth        2021 Outlook
 Highlights      Results                           Opportunities
KEY P&L FINANCIALS

                                                                                                                                                                 YoY %

                                                                                                 2020                                 Actual Rates                              Constant Rates

      Revenue                                                                                 £2,741.7m                                     (8.2%)                                      (6.7%)

      Like-for-like revenue1                                                                  £2,735.9m                                     (8.3%)                                      (6.8%)

      Operating profit2                                                                        £427.7m                                     (18.4%)                                     (17.0%)

      Operating profit margin2                                                                   15.6%                                    (190bps)                                    (190bps)

      Diluted earnings per share2                                                               170.9p                                     (19.6%)                                     (18.1%)

Notes: (1) Like-for-like revenue includes acquisitions following their 12-month anniversary of ownership and removes the historical contribution of any business disposals/closures; (2) Before separately disclosed items

                                                                                                                                                                                                                             12
OPERATING MARGIN BRIDGE

      18.0%
                       17.5%               (90bps)

      17.0%
                                                                (100bps)

      16.0%                                                                                               10bps                15.7%
                                                                                       0bps                                                       (10bps)                0bps    15.6%

      15.0%                                                    (180bps) at constant rates

      14.0%

      13.0%

                                                                                                             Divisional mix

                                                                                                                                                                          FX
                                                                    Trade

                                                                                        Resources
                           FY 2019

                                                                                                                                                                                  FY 2020
                                               Products

                                                                                                                              Excluding FX and

                                                                                                                                                    Acquisitions
                                                                                                                                                    & Disposals
                                                                                                                                Acquisitions
                                                                                                                                & Disposals
                                                                                                                                                                                            13
Note: Like-for-like revenue includes acquisitions following their 12-month anniversary of ownership and removes the historical contribution of any business disposals/closures
CASH FLOW & NET DEBT
                         £m @ actual exchange rates                                                                      2020                 2019
                         Adjusted operating profit1                                                                     427.7                524.2
                         Depreciation/amortisation                                                                      174.0                171.5
                         Change in working capital                                                                       88.6                 15.9
                         Other2                                                                                          14.8                 19.0
                         Adjusted cash flow from operations                                                             705.1                730.6

                         Net capex                                                                                      (72.2)              (114.3)
                         Other3                                                                                        (197.3)              (221.0)
                         Adjusted free cash flow                                                                        435.6                395.3            +10.2% YoY

                         Cash conversion %4                                                                             149%                  126%

                         Acquisitions                                                                                       -                (16.9)
                         Financial net debt                                                                             419.9                629.4
                         Financial net debt/Adjusted EBITDA (rolling 12 months)                                           0.7x                 0.9x
Notes:
(1) Before separately disclosed items; (2) Comprises: special pension payments, add back equity settled transactions and other non-cash items; (3) Comprises: interest paid/received and tax, lease liability repayment;
                                                                                                                                                                                                                           14
(4) Adjusted operating cash flow as % of adjusted operating profit. Adjusted operating cash flow comprises: adjusted cash flow from operations less the lease liability repayment and after adding back the special
pension payments
FINANCIAL GUIDANCE

                                                                                         FY 2021 Guidance

                      Net finance cost (pre-fx)                                              £29-33m

                      Effective tax rate                                                    26.5-27.0%

                      Minority interest                                                      £17-19m

                      Diluted shares (as at 31 December 2020)                                162.3m

                      Capex                                                                £110-120m

                      Financial Net Debt                                                   £350-400m

 Note: Net debt guidance before any material change in FX rates and any additional M&A                      15
01             02                03                 04            05
Performance   2020 Financial   Divisional Review     Growth        2021 Outlook
 Highlights      Results                           Opportunities
PRODUCTS BENEFITTED FROM A STRONG REBOUND IN H2
       Revenue (£m)                             Operating profit (£m)1                   Operating Profit Margin1                                          FY20​      FY19      Growth
            +12%          881                                                                                   24.5%                                       £m        £m          CCY
                                                                         216                       +760
      800                                                  +61%                                     bps                            Revenue                1,681.6    1,796.7     (5.7%)
                                                                                          16.9%
                                                                                                                                   Like-for-like
                                                                                                                                                          1,676.2    1,794.5     (5.9%)
                                                   136                                                                             Revenue
                                                                                                                                   Adjusted Operating
                                                                                                                                                           351.6     405.4      (12.4%)
                                                                                                                                   Profit
                                                                                                                                   Adjusted Operating
                                                                                                                                                           20.9%     22.6%      (160bps)
                                                   H1 20                 H2 20             H1 20                H2 20              Margin
     H1 20              H2 20

                                   H1 20 Actuals             H2 20 Actuals                                     Growth Drivers                                           FY20 Actuals
                                                                                                                  Supply chain
                                      Double-digit            Mid-single-digit   Increased number of                                          Increased demand in          Double-digit
            Softlines                                                                                           expansion in new
                                       negative                  negative           Brands & SKUs                                               chemical testing            negative
                                                                                                                    markets

                                                                                 Innovation from our
                                      Double-digit            Low-single-digit                                Increased demand for           Innovative inspection      Mid-single-digit
           Hardlines                                                             customers leveraging
                                       negative                  negative                                        chemical testing                 technology               negative
                                                                                  wireless technology

                                                                                  Electrical appliance innovations to
   Electrical & Connected           Low-single-digit                                                                       Increased demand for IoT Assurance
                                                                   Robust            provide better efficiency and                                                             Solid
            World                      negative                                                                              services, including cyber security
                                                                                              connectivity

Note: Growth rates and bps movement at constant currency; (1) Adjusted                                                                                                                     17
PRODUCTS BENEFITTED FROM A STRONG REBOUND IN H2
                      H1 20 Actuals       H2 20 Actuals                                       Growth Drivers                                          FY20 Actuals
                                                                  Increased focus of                 ISO                 Increased consumer and
                      High-single-digit                                                                                                               Mid-single-digit
 Business Assurance                            Solid         corporations on supply chain         standards            government focus on ethical
                          negative                                                                                                                       negative
                                                                and risk management               upgrades                and sustainable supply

     Building &                           Mid-single-digit   Growing demand for greener, safer and              Increased investment in large         Low-single-digit
                           Stable
    Construction                             negative         higher quality commercial buildings                   infrastructure projects              negative

                                                              Continued investment of our                                               Increased
   Transportation     High-single-digit    Double-digit                                                Growth in the hybrid /                           Double-digit
                                                             clients in new models and new                                             scrutiny on
     Technology           negative          negative                                                  electric engine segment                            negative
                                                                  fuel efficient engines                                                emissions

                                                                                                                              Growth in the food
                      Mid-single-digit                         Continuous food              Increased focus on the
       Food                                    Good                                                                            service assurance           Solid
                         negative                                innovation                 safety of supply chains
                                                                                                                                   business

   Chemicals and        Double-digit      Mid-single-digit   Growth of      Expansion of the supply base              Increased concerns on product   High-single-digit
      Pharma             negative            negative          SKUs             in emerging markets                       safety and traceability         negative

INNOVATIONS
                                                                                                                      2.0
                                                                                                                                                                   18
                                                                                                                                                                       18
H2 PERFORMANCE IMPROVEMENT IN TRADE
          Revenue (£m)                                 Operating Profit (£m)1                         Operating Margin1                                          FY20​   FY19       Growth
                                                                                                                                                                 £m       £m          CCY
              +4%
       295                 298                                                                               +240         9.1%
                                                               +40%
                                                                              27                                                           Revenue              592.6    679.4       (9.9%)
                                                                                                              bps
                                                                                                     6.8%
                                                        20                                                                                 Like for like
                                                                                                                                                                592.6    679.4       (9.9%)
                                                                                                                                           Revenue
                                                                                                                                           Adjusted
                                                                                                                                                                 47.1    86.6       (42.6%)
      H1 20              H2 20                         H1 20               H2 20                     H1 20               H2 20             Operating Profit
                                                                                                                                           Adjusted
                                                                                                                                                                 7.9%    12.7%      (460bps)
                                                                                                                                           Operating Margin

                                   H1 20 Actuals             H2 20 Actuals                                           Growth Drivers                                             FY20 Actuals
                                  High-single-digit          High-single-digit          Global and regional trade structural                                                High-single-digit
        Caleb Brett                                                                                                                 Increased transport infrastructure
                                      negative                   negative                         growth drivers                                                                negative

  Government & Trade                 Double-digit              Double-digit                                                                                                      Double-digit
                                                                                      Award of new contracts             GDP growth                 Population growth
       Services                       negative                  negative                                                                                                          negative

                                                                                        The expansion of our clients’ supply
         AgriWorld                      Stable                    Robust                                                                   New customer wins                        Solid
                                                                                          chains in fast growing markets

                                                                                 FUEL TESTING TECHNOLOGY:                      BLOCKCHAIN
 INNOVATIONS                                                                     NEW CETANE RATING UNIT                        POWERED POST-TRADE
                                                                                 IN SHANGHAI                                   MANAGEMENT
                                                                                                                                                                                              19
Note: Growth rates and bps movement at constant currency; (1) Adjusted                                                                                                                          19
H2 PROFIT AND MARGIN PROGRESSION IN RESOURCES
             Revenue (£m)                               Operating Profit (£m)1                            Operating Margin1
                                                                                                                +160         7.1%                                          FY20​   FY19      Growth
          236                    232                               +28%           16                    5.3%     bps                                                       £m       £m          CCY
                                                           13
                                                                                                                                             Revenue                   467.5       510.9       (6.3%)

                                                                                                                                             Like for like
                                                                                                                                                                       467.1       509.4       (6.1%)
                                                                                                                                             Revenue
                                                                                                                                             Adjusted Operating
        H1 20                  H2 20                      H1 20                  H2 20                 H1 20                H2 20                                          29.0     32.2       (8.2%)
                                                                                                                                             Profit
                                                                                                                                             Adjusted Operating
                                                                                                                                                                           6.2%    6.3%        (10bps)
                                                                                                                                             Margin

                                   H1 20 Actuals             H2 20 Actuals                                              Growth Drivers                                                FY20 Actuals
                                                             High-single-digit                                                                           Technological                Low-single-digit
     Capex Inspection                     Good                                           Demand for energy              Asset productivity
                                                                 negative                                                                                 innovation                     negative

                                       Double-digit             Double-digit                                                                                                             Double-digit
      Opex Inspection                                                                    Capacity utilisation          Ageing of equipment            Asset productivity
                                        negative                 negative                                                                                                                 negative

                                                                                                                          Technological
          Minerals                       Robust                    Good                  Minerals demand                                                     Outsourcing                   Robust
                                                                                                                           innovation

                                                                                                                                                                                   XRD BATCH
 INNOVATIONS                                                                                                                                                                       FOR IRON
                                                                                                                                                                                   ORES
                                                                                                                                                                                                   20
Note: Growth rates and bps movement at constant currency; (1) Adjusted                                                                                                                                20
01             02                03                 04            05
Performance   2020 Financial   Divisional Review     Growth        2021 Outlook
 Highlights      Results                           Opportunities
INTERTEK IS A FORCE FOR GOOD

                OUR PURPOSE
Bringing Quality, Safety and Sustainability to Life

                  OUR VISION
    To be the world’s most trusted partner for
               Quality Assurance

                 OUR VALUES
•   We are a global family that values diversity
•   We always do the right thing. With precision,
    pace and passion
•   We trust each other and have fun winning
    together
•   We own and shape our future
•   We create sustainable growth. For all
                                                      Insert Footer Here   22
COVID-19 HAS MADE THE CASE FOR TOTAL QUALITY ASSURANCE STRONGER
                     TESTING, INSPECTION & CERTIFICATION PROVIDES QUALITY & SAFETY CONTROLS

                                SUPPLY                 PRODUCTION                    DISTRIBUTION                             RETAIL
                       TIER 3   TIER 2   TIER 1   3RD PARTY     OWNED     TRANSPORTATION   DISTRIBUTION CENTRES   IN-STORE   ONLINE    CONSUMER
                                                                                                                                                     ASSURANCE

  TESTING                                                                                                                                              TESTING

                                                              RISK BASED QUALITY ASSURANCE

 INSPECTION                                                                                                                                          INSPECTION

CERTIFICATION                                                                                                                                       CERTIFICATION

                ASSURANCE PROVIDES AN END-TO-END ASSESSMENT OF QUALITY & SAFETY PROCESSES
                                                                                                                                                  ©Intertek Group
INCREASED CORPORATE FOCUS ON RISK POST COVID-19

SAFER SUPPLY                                                       LOW CARBON SOCIETY                         BETTER PERSONAL SAFETY

• Increased supply resilience                                      • Mandatory ESG disclosures
                                                                                                             • Higher health, safety, well-being
• Faster access to critical supplies                               • Carbon emission reductions                standards everywhere
• Improved supply intelligence                                     • Infrastructure and corporate            • Increased usage of PPE
• Higher focus on operational                                        investments to deliver Net Zero
                                                                                                             • Increased investment in health & safety
  sustainability                                                   • E-commerce                                at the workplace and public spaces
• End-to-end traceability                                          • Working remotely                        • Increased investment in pharma
                                                                                                               industry
                                                                                                             • Better safety risk management locally &
                                                                                                               globally

                                 87%             of Companies will invest within two years to make their supply chain more resilient

Source: 2020 Gartner Supply Chain Survey of 528 supply chain professionals
THE ATIC INDUSTRY WILL GROW FASTER POST COVID-19

            GLOBAL ATIC MARKET            GROWTH OPPORTUNITY
                                                       01
                                                   CUSTOMER
                                                   RETENTION

                 $50BN
                   Currently                           02
                  outsourced                        CUSTOMER
                                                   PENETRATION

                                                       03

                 $200bn                            ATIC CROSS-
                                                     SELLING

                Currently in-house
                                                       04
                                                       NEW
                                                    CUSTOMER
                                                      WINS

                 Untapped                              05
                 potential                          CUSTOMER
                                                   OUTSOURCING

                                                                 25
WELL POSITIONED TO BENEFIT FROM FASTER ATIC GROWTH
                                           Systemic approach to Quality and Safety
    43,800 EMPLOYEES
    GLOBAL MARKET              ASSURANCE              TESTING           INSPECTION     CERTIFICATION
    LEADER IN ASSURANCE

    3,000 AUDITORS
    90,000+ AUDITS
    100+ COUNTRIES
    GLOBAL MARKET
    LEADER IN TIC

   1,000+ LABS & OFFICES                                     Our Sectors

    80+ LANGUAGES
                                           Products      |      Trade      |   Resources
©Intertek Group
GDP+ GROWTH OUTLOOK

PRODUCTS ATIC                                                       TRADE ATIC                                                            RESOURCES ATIC
61% OFREVENUE                                                       22% OFREVENUE                                                         17% OFREVENUE
82% OFPROFIT                                                        11% OFPROFIT                                                          7% OFPROFIT

                              GDP+                                                      GDP GROWTH                                                         LONG-TERM GROWTH

     Growth in Brands,                     Faster                       Population Growth                                                        Population Growth             Investment in E&P,
                                                                                                             GDP growth
    SKUs & e-Commerce                  innovationcycle                   & social mobility                                                        & social mobility         Storage & Transportation

 Increased focus on safety,      Increased demand for                    Development of            Improvements in transport                      Total Energy with         Accelerated transition to
  performance and quality           Smart products                        regional trade                infrastructure                           diversified portfolio        renewable energies

Higher demand for healthy &           Emerging Markets                  Increased need for               Increased Focus on                     Increased Focus on            Digital Supply chain
sustainably sourced products         growing Middle Class             end to end traceability          Operational Sustainability             Operational Sustainability         management

                                                                             CORPORATE ASSURANCE
     ATIC Risk-based                 Increased              Health, Safety                  People                      Supply Intelligence                 Corporate               Enterprise
    quality assurance                regulation             and Wellbeing                  Assurance                       & Resiliency                    Sustainability         Cyber-security

                                GROWTH OUTLOOK: GDP+ LIKE FOR LIKE REVENUE GROWTH IN REAL TERMS
                                                                                                                                                                                                        27
SUSTAINABLE VALUE CREATION FOR ALL STAKEHOLDERS
                                                                                                         Intertek high quality
                                                                                                                                 2020
                                                                                                            earnings model
                                                                                                               Revenue           £2.7bn

                                                                                                           EBITDA margin 1        22%

                                                                                                          Cash Conversion 2      149%

                                                                                                                Capex            £80m

                                                                                                           Dividend Payout       105.8p

                                                                                                                 FCF             £436m
                                                                                                         Financial net debt to    0.7x
                                                                                                               EBITDA 1
                                                                                                                ROIC 1           21.6%

                                                                                                          Co2t / employee         4.3

Notes: (1) Adjusted; (2) Cash flow for cash conversion (includes IFRS 16 repayment of lease liability)                                    28
SUPPORTING OUR CLIENTS DELIVER THEIR SUSTAINABILITY AGENDA

                                                   Systemic End-to-End Sustainability Solutions

    INTERTEK OPERATIONAL SUSTAINABILITY                                                         INTERTEK CORPORATE SUSTAINABILITY
                                                                  Intertek ESG Audit
                SOLUTIONS                                                                                 CERTIFICATION
 Helping organizations                                           Independent audit of
 achieve sustainability excellence                               sustainability disclosures
                                                                 and reporting

             Life Cycle                      Value Chain
             Assessment                      Resilience
                                                                         Independent
             Product & Packaging             Sustainability               verification
             Stewardship                     Auditing

                                                                                              Certify corporate sustainability programmes
             Circular Economy                Substance                     Insights
                                             Disclosure                    Analysis           Quality & Safety            Compliance
                                                                                              People & Culture            Financial
             Eco-Claims &                    Environmental                                    Communities                 Environment
             Certification                   solutions
                                                                             Risk             Governance                  Enterprise Security
                                                                          Assessment          Risk Management             Communication & Disclosures
                                     Safety. Everywhere.
                                     Every day.

                                                                                                                                                        29
DELIVERING SUSTAINABILITY EXCELLENCE ACROSS ALL OPERATIONS
  SUSTAINABILITY CENTRAL TO OUR
  5X5 STRATEGY

                        END-TO-END SYSTEMIC SUSTAINABILITY APPROACH

                                                                      30
01             02                03                 04            05
Performance   2020 Financial   Divisional Review     Growth        2021 Outlook
 Highlights      Results                           Opportunities
LIKE-FOR-LIKE REVENUE TRAJECTORY
                             2020 Group YoY %                                 2020 Products YoY %
          Jan-Apr
           Jan-Apr         May-Jun
                                May-Jun Jul-Oct
                                          Jul-Oct   Nov-Dec
                                                       Nov-Dec    Jan-Apr
                                                                   Jan-Apr   May-Jun
                                                                                May-Jun Jul-Oct
                                                                                          Jul-Oct    Nov-Dec
                                                                                                        Nov-Dec

                                                                                                     (1.4%)
        (4.9%)                                      (4.6%)                                (4.0%)
                                         (6.3%)                  (6.6%)

                             (13.4%)                                          (12.4%)

                                                                             2020 Resources YoY %
                            2020 Trade YoY %
                                                                 Jan-Apr
                                                                   Jan-Apr   May-Jun
                                                                                May-Jun Jul-Oct
                                                                                         Jul-Oct    Nov-Dec
                                                                                                      Nov-Dec
            Jan-Apr          May-Jun    Jul-Oct     Nov-Dec       2.4%
            Jan-Apr             May-Jun Jul-Oct       Nov-Dec

         (5.9%)
                                          (10.1%)   (8.5%)
                                                                                          (9.6%)
                                                                                                    (10.6%)
                                                                             (10.7%)
                              (18.1%)

Note: At constant currency rates                                                                                  32
GLOBAL MOBILITY SLOWED AS A THIRD WAVE EMERGED
                                            Global                                                                                       Greater China                                                                                               Asia Pacific
            0%
       -                                                                                                       -                                                                                                       -
                                                                                                                                                                     (3%)                                                  (2%)
 (20%)                                                                                                     (20%)                           (6%) (9%)       (7%) (4%)      (8%) (12%) (12%)                         (20%)
                                                                               (13%)                               (12%) (11%) (15%) (10%)           (13%)
                                                 (17%) (17%) (14%) (14%) (16%)                                                                                                                                                    (17%)
                                                                                                                                                                                                                                                                  (21%) (21%) (19%) (19%) (18%)
                                                                                                                                                                                                                                                                                                  (16%)
                 (19%)                   (21%)                                               (21%) (19%)                                                                                                                                                  (25%)                                           (24%) (21%)
 (40%)                           (34%)
                                                                                                           (40%)                                                                                                   (40%)
                                                                                                                                                                                                                                                  (38%)
 (60%)                   (48%)                                                                             (60%)                                                                                                   (60%)                  (46%)

 (80%)                                                                                                     (80%)                                                                                                   (80%)
           Feb Mar Apr May Jun Jul Aug Sep Oct Nov Dec Jan Feb                                                     Feb Mar Apr May Jun Jul Aug Sep Oct Nov Dec Jan Feb                                                     Feb Mar Apr May Jun Jul Aug Sep Oct Nov Dec Jan Feb

                                     South Asia                                                                                                   MENAP                                                                                    Sub-Saharan Africa
            2%                                                                                      5%
                                                                                                                    1%
       -                                                                                                       -                                                                                                       -
                                                                                     (1%) (1%)                                                                                                                             (0%)
                                                                              (5%)
 (20%)                                                                 (9%)                                (20%)                                                             (13%)   (13%) (11%) (15%) (13%)       (20%)          (14%)
                                                               (16%)                                                                                                                                                                                                                  (16%) (14%) (14%)
                 (19%)                                                                                                   (21%)                                   (21%) (17%)
                                                 (28%) (24%)
                                                                                                                                                         (22%)                                                                                                          (25%) (21%)                               (22%)
 (40%)                                   (33%)                                                             (40%)                                 (31%)                                                             (40%)                                  (31%) (29%)                                     (30%)
                                                                                                                                         (44%)                                                                                                    (44%)
 (60%)                           (49%)                                                                     (60%)                 (51%)                                                                             (60%)
                         (64%)                                                                                                                                                                                                            (65%)
 (80%)                                                                                                     (80%)                                                                                                   (80%)
           Feb Mar Apr May Jun Jul Aug Sep Oct Nov Dec Jan Feb                                                     Feb Mar Apr May Jun Jul Aug Sep Oct Nov Dec Jan Feb                                                     Feb Mar Apr May Jun Jul Aug Sep Oct Nov Dec Jan Feb

                                 North America                                                                                            Latin America                                                                            Europe and Central Asia
            1%                                                                                                      1%
       -                                                                                                       -                                                                                                       -
                                                                                                                                                                                                                           (0%)
 (20%)                                                                                                     (20%)                                                                                                   (20%)                                                      (12%) (15%)
                 (17%)                                                                                                                                                                       (15%)                                                        (16%) (13%) (13%)
                                         (22%) (20%) (20%) (20%) (21%) (24%)                                                                                                   (25%) (21%)
 (40%)                                                                               (27%)                 (40%)
                                                                                                                         (24%)                                                                       (27%) (24%)   (40%)          (28%)                                                     (24%) (27%)           (28%)
                                 (32%)                                                       (34%) (32%)                                                         (34%) (30%)                                                                      (34%)                                                   (34%)
                         (44%)                                                                                                                   (42%) (38%)
 (60%)                                                                                                     (60%)                         (51%)                                                                     (60%)                  (49%)
                                                                                                                                 (58%)
 (80%)                                                                                                     (80%)                                                                                                   (80%)
           Feb Mar Apr May Jun Jul Aug Sep Oct Nov Dec Jan Feb                                                     Feb Mar Apr May Jun Jul Aug Sep Oct Nov Dec Jan Feb                                                     Feb Mar Apr May Jun Jul Aug Sep Oct Nov Dec Jan Feb

Sources: Google. Baseline is measured as the 5-week period Jan 3 – Feb 6 2020.
GROUP OUTLOOK 2021

• Good like-for-like revenue growth at
  constant currency

• Margin progression year-on-year

• Strong free cash flow performance

• Capex: £110-120m

• Financial net debt: £350-400m

                                         34
INTERTEK IS A FORCE FOR GOOD DELIVERING VALUE FOR ALL

•   The agility and energy of our customer centric organisation has
    made a huge difference to deliver a resilient 2020 performance
    with Earnings and Cash ahead of expectations.
•   We have benefited from a broad-based recovery in H2 with a
    record operating margin and cash conversion delivering double
    digit free cashflow growth.
•   We are well positioned to benefit from exciting growth
    opportunity driven by the Covid-19 recovery, increased corporate
    needs for TQA and M&A growth opportunities.
•   We will capitalise on our High-Quality Earnings model to seize
    these exciting growth opportunities and deliver sustainable value
    creation for all.
•   Intertek is a Force for Good in society helping our clients to deliver
    their sustainability agendas and leading by example focussed
    internally on sustainability excellence.
GROUP PERFORMANCE (2015 – 2020)
                        Revenue (£m)                                            Adjusted Operating Profit (£m) 1                                    Adjusted Operating Margin (%) 1

                                                  £2,987m                                                           £482m £524m                                                           17.5%
                          £2,769m £2,801m                                                              £468m                                                                   17.2%
                                                              £2,742m                                                                       £428m
              £2,567m                                                                      £410m                                                                       16.9%
  £2,166m                                                                       £343m
                             59%         60%          60%                                                                        77%
                 57%                                             61%                                     75%         77%
     51%                                                                                     73%                                                    15.9%     16.0%
                                                                                                                                            82%
                                                                                 68%                                                                                                              15.6%

     25%         23%         23%         23%          23%        22%
                                                                                 22%         20%         19%         17%         17%
     24%         20%         18%         17%          17%        17%                                                                        11%
                                                                                 10%         7%          6%          6%          6%         7%
    FY 15       FY 16       FY 17       FY 18       FY 19       FY20            FY 15       FY 16       FY 17       FY 18       FY 19       FY20    FY 15     FY 16    FY 17   FY 18      FY 19   FY20

                                       Adjusted Operating Margin                                                                                    Key Metrics 2020
                FY 15          FY 16          FY 17           FY 18           FY 19           FY20                                                                        Like-for-like Revenue
                                                                                                                              % Group Revenue         % Group Profit
                                                                                                                                                                                 Growth2
Products        21.1%          20.3%          21.6%          22.1%           22.6%           20.9%                                    61%                   82%                  (5.9%)
Trade           14.1%          14.0%          13.7%          13.0%           12.7%            7.9%                                    22%                   11%                  (9.9%)
Resources       6.5%            5.8%           5.7%           5.7%            6.3%            6.2%                                    17%                   7%                   (6.1%)
Group           15.9%          16.0%          16.9%          17.2%           17.5%           15.6%                                   100%                   100%                 (6.8%)
                                                                                                                                                                                                      37

Notes: (1) IFRS 16 was adopted on 1 Jan 19 and as such results prior to 2019 are on an IAS 17 basis; (2) At 2020 constant currency rates
ADJUSTED EPS

               £m @ actual exchange rates    FY 20     FY 19

               Adjusted operating profit    427.7     524.2     (18.4%)

               Net interest expense         (34.9)    (39.4)

               Profit before tax            392.8     484.8

               Tax                          (100.2)   (118.8)

               Profit after tax             292.6     366.0

               Minority interest            (15.3)    (20.5)

               Net profit                   277.3     345.5

               Fully diluted shares (m)     162.3     162.6

               Earnings per share (p)       170.9     212.5     (19.6%)

               Dividend (p)                 105.8     105.8        -
                                                                          38
You can also read