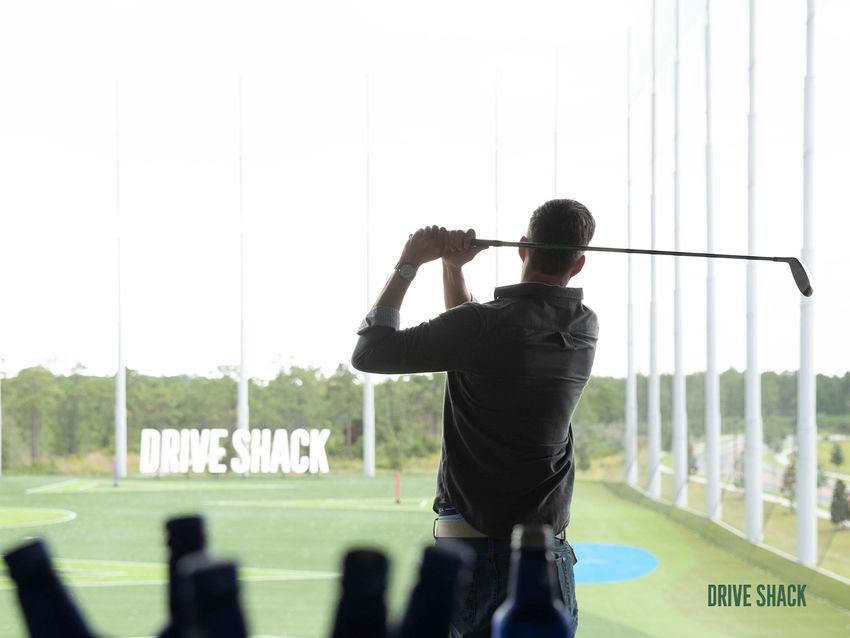
Drive Shack Inc. Earnings Presentation - First Quarter 2021
←
→
Page content transcription
If your browser does not render page correctly, please read the page content below
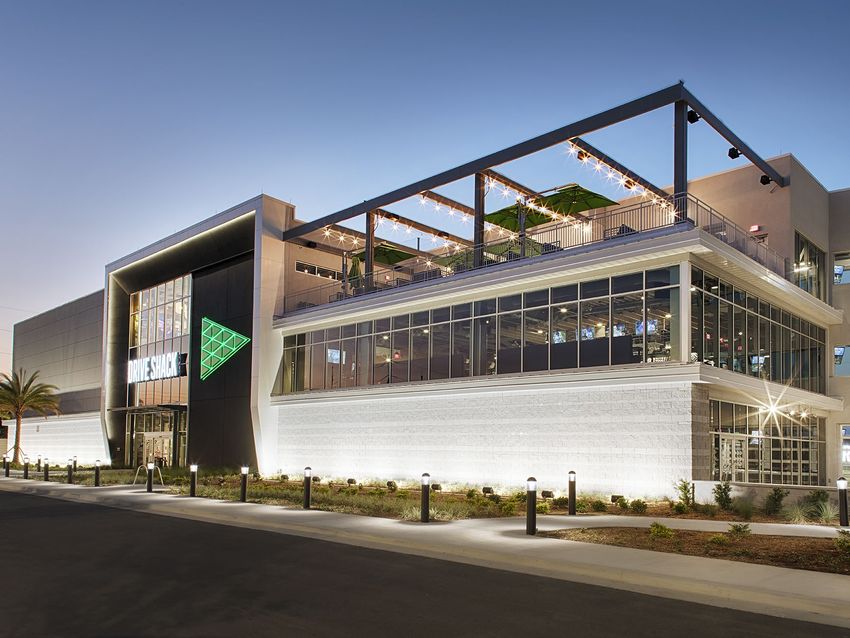
Drive Shack Inc.
Earnings Presentation – First Quarter 2021
Cautionary Note on Forward-Looking Statements
This disclaimer applies to this document and the verbal or written comments of any person presenting it. This document, taken
                 together with any such verbal or written comments, is referred to herein as the “Presentation.”

This presentation contains forward-looking statements, within the meaning of the Private Securities Litigation Reform Act of 1995, which are subject
to known and unknown risks, uncertainties and other important factors that may cause actual results to be materially different.

All statements other than statements of historical fact included in this presentation are forward-looking statements, including, but not limited to,
timing of new venue openings, expected financial outlook for fiscal 2021, expected operating performance, time of construction start dates and
milestones, expected sales and trends in Drive Shack Inc.’s (the "Company's") operations including statements relating to the effects of COVID-19
and the Company’s mitigationefforts and our ability to achieve our growth plans and goals.

Forward-looking statements discuss the Company's current expectations and projections relating to its financial position, results of operations,
plans, objectives, future performance and business. You can identify forward-looking statements by the fact that they do not relate strictly to
historical or current facts. These statements may include words such as "aim," "anticipate," "believe," "estimate," "expect," "forecast," "outlook,"
"potential," "project," "projection," "plan," "intend," "seek," "may," "could," "would," "will," "should," "can," "can have," "likely," the negatives thereof
and other similar expressions.

Without limiting the generality of the foregoing, targeted returns and growth, including with respect to the number and timing of new venue
openings, are forward-looking statements, represent management’s view and are estimated based on current and projected future operating
performance of our locations, comparable companies in our industry and a variety of other assumptions, many of which are beyond our control,
that could prove incorrect. As a result, actual results may vary materially with changes in our liquidity or ability to obtain financing, changes in
market conditions and additional factors described in our reports filed with the Securities and Exchange Commission (“SEC”), which we
encourage you to review. We undertake no obligation to update these estimates.

For a discussion of some of the risks and important factors that could cause actual results to differ materially from such forward-looking
statements, see the sections entitled “Risk Factors” and “Management’s Discussion and Analysis of Financial Condition and Results of Operations”
in the Company’s periodic reports filed with the SEC, which are available on the Company’s website (www.http://ir.driveshack.com). Forward-
looking statements speak only as of May 7, 2021. We expressly disclaim any obligation to release publicly any updates or revisions to any forward-
looking statements contained herein to reflect any change in expectations with regard thereto or change in events, conditions or circumstances
on which any statement is based.

This Presentation includes forward-looking financial measures that are not recognized under generally accepted accounting principles (“GAAP”),
including EBITDA and SG&A excluding certain compensation expenses. This non-GAAP financial information does not speak to historical financial
results and is an estimate of what could occur in the future and is not an alternative to financial information prepared in accordance with GAAP,
which is included in the Company’s filings with the SEC. The Company has not reconciled its EBITDA expectations set forth in this presentation, as
items that impact such expectations are out of the Company’s control and/or cannot be reasonably predicted. Accordingly, a reconciliation is
not available without unreasonable effort.

                                                                                                                                                                1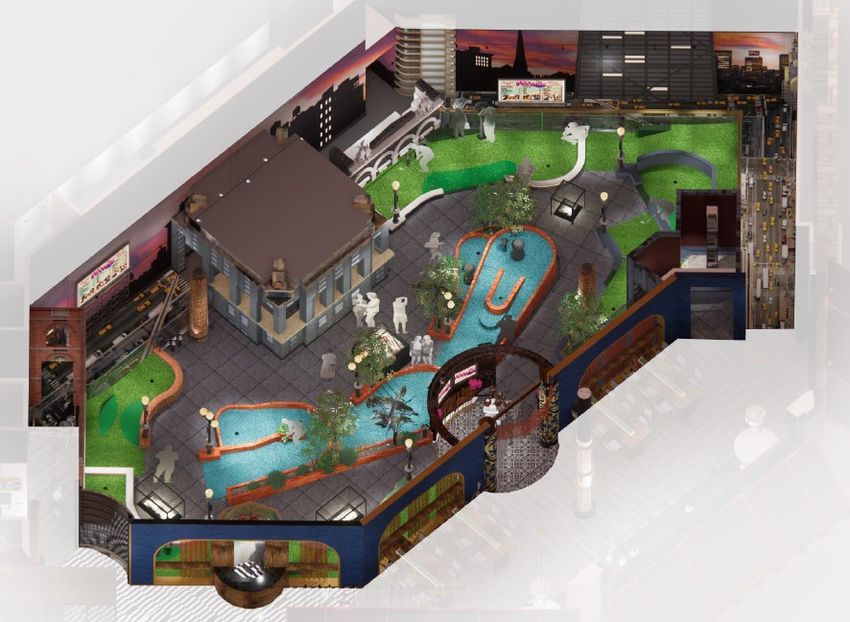
1. Executive Summary
2. Operations Update
3. Development Update
4. Financials
Executive Summary
                    Drive Shack Inc.

Drive Shack Inc. is                Our Mission
a publicly traded leisure
and entertainment                  To become the largest
company focused on                 venue-based
bringing people together           competitive socializing
through technology driven          and entertainment
competitive socializing            platform in the country
experiences.

                                                             3
Executive Summary
First Quarter 2021 Update
Q1 Total Company Revenue of $61.1M, flat vs. Q1 2020
Drive Shack total revenue of $8.2M, down ($1.9M) vs. Q1 2020
Q1 Results AGC total revenue of $52.9M, up $1.9M vs. Q1 2020
(1)
Total Company Adj. EBITDA of $2.7M, +7.4M vs. Q1 2020 of ($4.7M)
Continued focus on Puttery expansion
Dallas and Charlotte on track to open Summer 2021
Puttery Announced Washington DC/Penn Quarter
Actively engaged with landlords and brokers in several prospective markets
We have $81.5M of unrestricted cash on hand as of April 30, 2021
Liquidity &
Paid $1.4M preferred cash dividends on April 30th
Funding Continue to enforce strong capital allocation discipline and expense control
We have a relatively unlevered balance sheet providing us with a solid financial foundation to pursue growth
1) Adjusted EBITDA is a Non-GAAP financial metric. See Adjusted EBITDA Non-GAAP Reconciliation on page 20.
4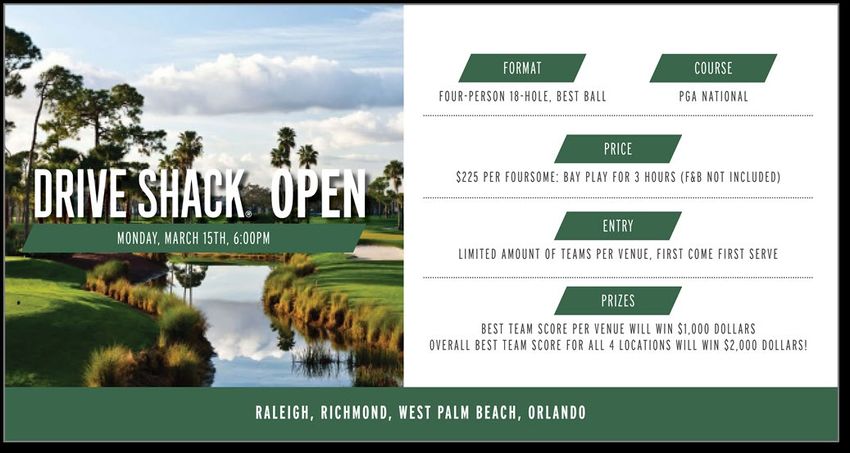
Executive Summary
                                           Our Courses and Venues                                                                   (1)

   AGC             OWNED                                     LEASED                                      MANAGED
  GOLF            1 Course                                 34 Courses                                    25 Courses
COURSES

                       CURRENT VENUES                                                                                        COMMITTED VENUES
                         Orlando, FL                              Raleigh, NC                                         New Orleans, LA            Manhattan, NY
  DRIVE                  Opened Q2
                         (Beta Site)
                                                                  Opened Q3                                           On Hold (2)                (Randall's Island)
                                                                  Richmond, VA
 SHACK                                                            Opened Q3
 VENUES                                                           West Palm, FL
                                                                  Opened Q4

               2018                                    2019                                                2021                               2022
 PUTTERY
                                                                                                                      Dallas, TX                 Robust Pipeline in 24
 VENUES                                                                                                               Charlotte, NC              Prioritized Markets for
                                                                                                                      Washington DC              Opening in 2022+
                                                                                                                      +4 Additional Targets

           1) As of 3/31/2021.
           2) Drive Shack is committed to 1 lease in New Orleans. The venue’s development status remains “on hold”.
                                                                                                                                                                           5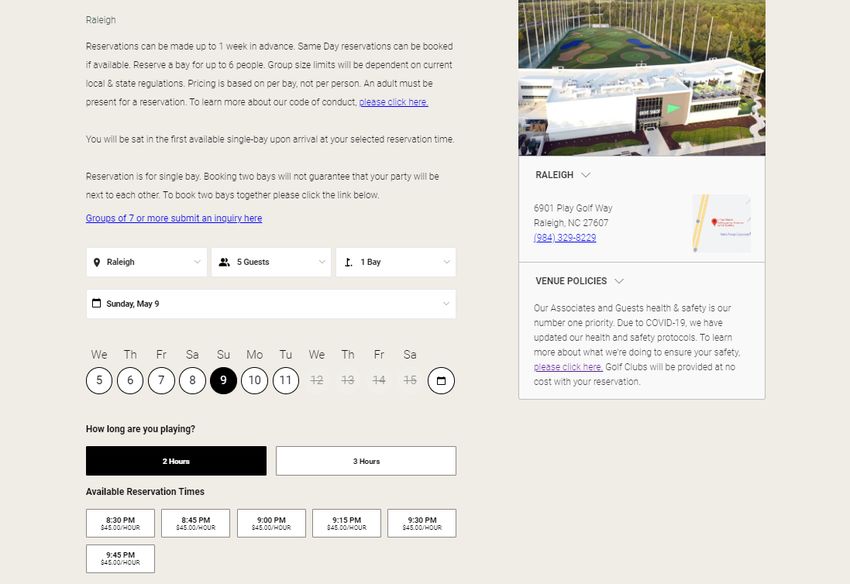
1. Executive Summary
2. Operations Update
3. Development Update
4. Financials
Operations Update
Drive Shack Venues– Q1 2021 Results
Total Revenue of $8.2M – Walk-in revenue of $7.4M | Events revenue of $0.8M
Total venue revenue averaged 81% of Q1 2020 levels
Total venue walk-in revenue averaged 96% of Q1 2020 levels
Drive Shack Venues: Revenue by Quarter
($ in 000's)
Walk-In Event
$3,560 $3,541
$3,310
$2,751
$2,591
$2,375
$2,192 $2,111
$1,860 $1,877
$1,679
$1,515
$1,175 $1,202
$1,022
$550
$63 $144
$0 $0
Q1-20 Q2-20 Q3-20 Q4-20 Q1-21 Q1-20 Q2-20 Q3-20 Q4-20 Q1-21 Q1-20 Q2-20 Q3-20 Q4-20 Q1-21 Q1-20 Q2-20 Q3-20 Q4-20 Q1-21
West Palm Richmond Raleigh Orlando
7Operations Update
Driving Event Revenue: 2-Bay Package
Launched 2-Bay Package in mid-September to encourage small event bookings across our DS venues
2-Bay Package remains strong, with event revenue up 4x than pre-launch levels
$35,000 Event Revenue (8/21-9/10) Events/2-Bay Pkg (9/11-12/31)
Events/2-Bay Pkg (1/1/-4/30) Online Reservations (1/1-4/30)
$30,000
Revenue (weekly Average $'s)
$25,000
$20,000
$15,000
$10,000
$5,000
-
Raleigh Richmond West Palm
The 2-Bay promotional package allows for groups of 10 people or less to reserve 2 bays
and includes a $200 food and beverage credit and 2 hours of play for $400-$500
8Operations Update
Online Reservations
Launched online platform for single-bay reservations in all four DS venues – December 28th
Over 20,500 total reservations since launch, generating revenue over $1.5M(1)
Single-Bay Online Reservation Platform
9
1) From 1/1/2021 to 4/30/2021.Operations Update
Driving Revenue: Game Innovation
Drive Shack Open
Geared towards more competitive, avid golfer
First DS Open tournament debuted December 2020
Second DS Open held March 2021
Future tournaments to run quarterly
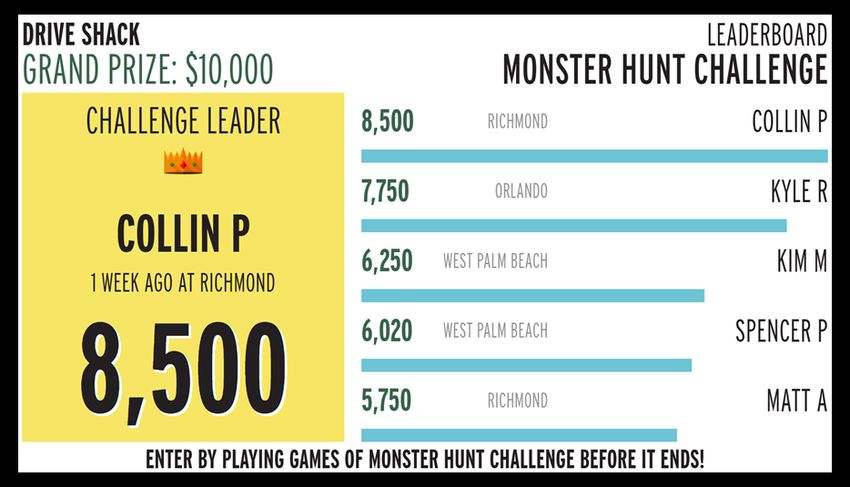
Monster Hunt Challenge
Geared towards casual players and non-golfers
Increases engagement and spend per visit
Flexible game program allows for future enhancements
1
First tournament planned to debut Q2 2021
Social Leagues
Casual, social, less-competitive league play
Re-launched on May 3rd
Runs every Monday for 8 weeks through June 28th
F&B specials, themed nights, prizes, weekly contests
10Operations Update
Strong Demand Continues for Traditional Golf (1)
American Golf’s exceptional results highlight the unwavering demand for traditional golf, reinforcing
it as a top leisure activity in the current environment
Public Courses Private Courses
+46%
Revenue from
+33%
Daily fee rounds
+30%
Member sales
+29%
(2)
Total rounds
green & cart fees vs. Q1 2020 vs. Q1 2020 vs. Q1 2020
vs. Q1 2020 641K
$20.5M
506K
$16.7M 455K 113K
180
$14.3M 98K 97K
88K
342K
296K 118
$9.8M 68K
$9.5M 107
91
74
Q1-20 Q2-20 Q3-20 Q4-20 Q1-21 Q1-20 Q2-20 Q3-20 Q4-20 Q1-21 Q1-20 Q2-20 Q3-20 Q4-20 Q1-21 Q1-20 Q2-20 Q3-20 Q4-20 Q1-21
Revenue from green/cart fees Daily Fee Rounds Member sales Total rounds
1) Comparisons are based on our 30 public and 5 private owned and leased properties as of 3/31/2021.
11
2) Member sales represent Full Golf memberships only.1. Executive Summary 2. Operations Update 3. Development Update 4. Financials
Development Update
Portfolio of High-Quality Locations with Growing Pipeline
Dallas and Charlotte opening summer 2021
Washington DC and 4 additional locations to open or be near complete by end of 2021
Expect to open 10 additional Puttery venues in 2022
Pursuing pipeline of Puttery sites in prioritized and future markets to complement our portfolio of DS venues
Believe current market allows for numerous Puttery locations across the U.S.
MANHATTAN, NY
WASHINGTON D.C.
RICHMOND, VA
RALEIGH, NC
CHARLOTTE, NC
ORLANDO, FL
Drive Shack
(Open venues in black) WEST PALM BEACH, FL
NEW ORLEANS, LA
Puttery (On Hold)
DALLAS, TX
Prioritized & Future Markets
Based on management’s current views and estimates. See “Disclaimers” at the beginning of this Presentation for more information on forward-looking statements.
13Development Update
Puttery Progress
Using state-of-the-art mini golf, Puttery combines
competitive socializing, food & beverage and technology
to create one remarkable experience, featuring:
An adult-focused, modern spin on the classic game
of mini golf, using innovative auto-scoring technology
A high energy atmosphere anchored by multiple
bars, lounges and rotating DJs
Curated culinary offerings alongside inventive craft
cocktails
Dallas/The Colony Puttery
In summer 2021, we will debut our first 2 Puttery venues in
Dallas and Charlotte
Dallas construction continues, including buildout on
the four golf courses, kitchen and bars
Charlotte permitting was approved; construction
has commenced
Executed Washington DC/Penn Quarter lease in March; design
process is underway
We expect to open or nearly complete 4 additional
Drive Shack Venues Puttery locations in 2021 and 10 venues in 2022
Based on management’s current views and estimates. See “Disclaimers” at the beginning of this Presentation for more information on forward-looking statements.
14Development Update
Attractive Unit Economics – Puttery (1)
The Puttery presents the best path forward for near-term growth
Our goal is to build 17 Puttery venues and DS Manhattan by the end of 2022(2)
Target Puttery venue EBITDA is $2 to $3 million and DS venue EBITDA is $4 to $6 million
Illustrative Venue-Level Economics(1)
DS Venues Puttery Venues
$ in millions
72 to 90+ Bays Indoor, Mini Golf
Size (sq. ft.) 50K - 60K+ 15K - 20K
Development Time 18 - 24 mo. 6 - 9 mo.
Development Cost(3) $25 - $40 $7 - $11
Total Revenue $15 - $25 $7 - $11
Site-level EBITDA $4 - $6 $2 - $3
As we continue to open
Puttery venues, yields may
Development Yields 10 – 20% 25 – 40% be even higher
1) Represents illustrative economics of Puttery and Drive Shack venues, including Total Revenue and Site-level EBITDA, without restrictions or impact due to COVID-19.
2) Drive Shack is committed to the lease in New Orleans. The venue’s development status remains “on hold” and is therefore excluded from future venue counts.
3) Development cost target is inclusive of all construction costs, soft costs, and pre-opening expenses. 15
Based on management’s current views and estimates. See “Disclaimers” at the beginning of this Presentation for more information on forward-looking statements.1. Executive Summary 2. Operations 3. Development | Puttery Update 4. Financials
First Quarter 2021 Financial Results

                                                                                                       Three Months Ended
                                                                                                                  March 31,

$ in millions, except per share data
                                                                                                       2021                            2020         $ Variance   % Variance

Drive Shack Revenue                                                                                     $8.2                         $10.1           ($1.9)        (19%)

American Golf Revenue                                                                                 $52.9                          $51.0            $1.9           4%

Total Company Revenue                                                                                 $61.1                          $61.1            Flat          Flat

Operating Loss                                                                                       ($7.9)                         ($14.8)           $6.9         47%

Net Loss                                                                                            ($10.9)                         ($17.4)           $6.5         37%

Adjusted EBITDA(1)                                                                                     $2.7                          ($4.7)           $7.4         158%
Net Loss Applicable to Common Stock,
                                                                                                    ($0.15)                         ($0.28)           $0.13        46%
per share(2)

                       1) Adjusted EBITDA is a Non-GAAP financial metric. See Adjusted EBITDA Non-GAAP Reconciliation on page 20.                                             17
                       2) Amounts shown are for both Basic and Diluted per share results for the periods ended March 31, 2021 and March 31, 2020.
Consolidated Statement of Operations (Unaudited)
($ in thousands, except per share data) Three Months Ended March 31,
2021 2020
Revenues
Golf operations $53,161 $48,625
Sales of food and beverages 7,930 12,510
Total revenues $61,091 $61,135
Operating costs
Operating expenses 48,870 54,367
Cost of sales – food and beverages 2,104 3,655
General and administrative expense 7,982 9,818
Depreciation and amortization 6,245 6,794
Pre-opening costs 556 552
Loss on lease terminations and impairment 3,209 792
Total operating costs $68,966 $75,978
Operating Loss ($7,875) ($14,843)
Other income (expenses)
Interest and investment income $153 $130
Interest expense, net (2,626) (2,745)
Other income (loss), net (61) 367
Total other income (expenses) ($2,534) ($2,248)
Loss before income tax ($10,409) ($17,091)
Income tax expense 495 271
Net loss ($10,904) ($17,362)
Preferred dividends ($1,395) ($1,395)
Net Loss Applicable to Common Stockholders ($12,299) ($18,757)
Per WA Basic Share ($0.15) ($0.28)
18Consolidated Balance Sheet (Condensed)
($ in thousands) As of 3/31/2021 As of 12/31/2020
Assets (Unaudited)
Current Assets:
Cash and cash equivalents $85,936 $47,786
Restricted cash 2,852 2,252
Accounts receivable, net 5,143 4,446
Real estate securities, available-for-sale 3,271 3,223
Other current assets 17,754 14,410
Total Current Assets $114,956 $72,117
Restricted cash, noncurrent 795 795
Property and equipment, net of accumulated depreciation 167,663 169,425
Operating lease right-of-use assets 195,280 192,828
Intangibles, net of accumulated amortization 14,574 15,124
Other assets 6,593 6,765
Total Assets $499,861 $457,054
Liabilities
Current Liabilities:
Obligations under finance leases $6,180 $6,470
Membership deposit liabilities 14,748 14,692
Accounts payable and accrued expenses 26,308 29,596
Deferred revenue 20,079 23,010
Other current liabilities 27,504 28,217
Total Current Liabilities $94,819 $101,985
Credit facilities and obligations under finance leases - noncurrent 11,653 12,751
Operating lease liabilities - noncurrent 173,528 167,837
Junior subordinated notes payable 51,180 51,182
Membership deposit liabilities, noncurrent 101,853 99,862
Deferred revenue, noncurrent 10,983 9,953
Other liabilities 3,463 3,447
Total Liabilities $447,479 $447,017
Stockholders' Equity
Preferred Stock $61,583 $61,583
Common Equity (9,201) (51,546)
Total Stockholders' Equity $52,382 $10,037
Total Liabilities & Stockholders' Equity $499,861 $457,054
19Adjusted EBITDA Non-GAAP Reconciliation
Three Months Ended
March 31,
($ in thousands) 2021 2020
Net Loss ($10,904) ($17,362)
Income tax expense 495 271
Other (income) loss, net 61 (367)
Net interest expense 2,473 2,615
Operating Loss ($7,875) ($14,843)
Depreciation and amortization 6,245 6,794
Loss on lease terminations and impairment 3,209 792
Pre-opening costs 556 552
Other items(1) 596 2,008
Adjusted EBITDA $2,731 ($4,697)
(1)For the three months ended March 31, 2021 and 2020, other items include (i)corporate severance of $130 and $693, respectively; (ii) transactional G&A of $196 and $1,178, respectively; 20
and (iii) employee stock-based compensation of $270 and $137, respectively.You can also read