Institutional Presentation - JBS S.A - A GLOBAL FOOD COMPANY JBS S.A - UMA COMPANHIA GLOBAL DE ALIMENTOS JBS S.A - A GLOBAL FOOD COMPANY
←
→
Page content transcription
If your browser does not render page correctly, please read the page content below
JBS S.A. – UMA COMPANHIA GLOBAL DE ALIMENTOS

Apresentação              dos
   JBS S.A. – A GLOBAL FOOD    Resultados
                            COMPANY
JBS S.A. – A GLOBAL FOOD COMPANY
   Institutional
2T19
2Q19         Earnings   Presentation
                            Presentation
  Including 2Q19 Results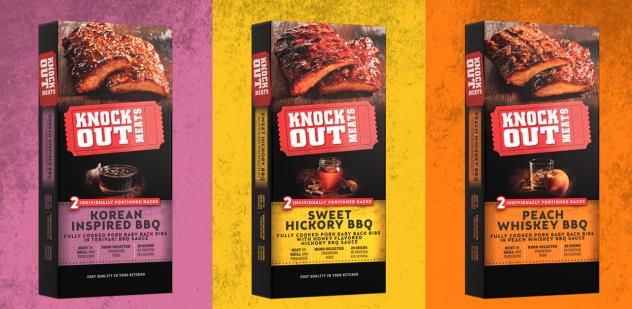
A UNIQUE GLOBAL LEADER
    Global platform present in over 15 countries and with over 400 facilities¹ and offices

    #1                                          CANADA      3%
    in global beef production
    in global chicken production
                                                                                               EUROPE   5%
    in global leather processing
                                                             USA   51%                                                      ASIA   16%
                                                                                                               AFRICA &

    #2                                                                                                        MIDDLE EAST
                                                                                                                 3%
     in global pork production                                  MEXICO       4%
     In global lamb production
                                                                                                                                         AUSTRALIA &
                                                                                               BRAZIL   13%                              NEW ZEALAND

                                                                                  S. AMERICA                                             4%
                                                                                        1%
  +275,000 customers and
  +230,000 team members

Note: % of Consolidated Net Revenue – domestic sales and imports.
¹ Includes production units, feed mills, hatcheries, feed lots and others.
                                                                                                                                                       2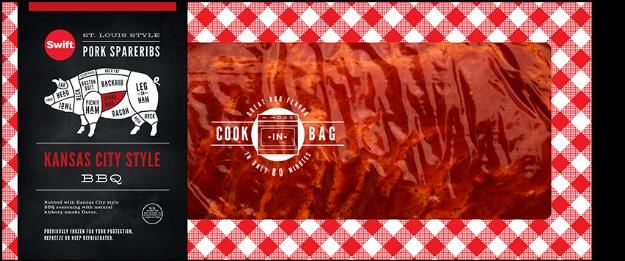
GLOBAL RANKING
     2nd largest food company of the world in revenue

  63.8

               49.6 ¹

                             43.6
                                           41.1

                                                         26.2
                                                                24.8   23.9   23.8

                                                                                     16.8
                                                                                            15.7
                                                                                                   14.5   14.1   13.5
                                                                                                                        12.1   11.8   11.7   11.1   10.9
                                                                                                                                                           9.7   9.0

Source: JBS; Bloomberg, based on net revenue in US$ billion                                                                                                            3
Note1: LTM 2Q19 Net Revenue, including PPC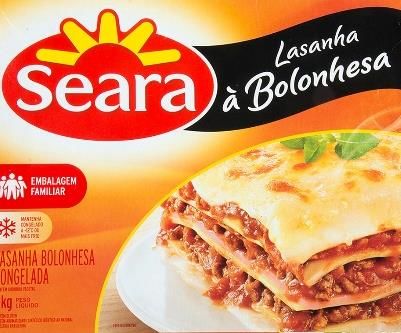
EVOLUTION
  From a Brazilian beef company in 2006 to a GLOBAL FOOD COMPANY

               IPO JBS SA
              Net Revenue                                                                                                                          Net
               R$14.1 Bn                  BERTIN                                                    CARGILL PORK
   19,000                                                                                                             ~235,000
                                                                                                                                                 Revenue
 EMPLOYEES      2007                      2009                              2013                        2015       TEAM MEMBERS      2017       R$181.7 Bn
   2006                       2008                        2010                            2014                        2016        Net Revenue      2018
                                                                                                                                   R$163.2 Bn
Net Revenue                 Net Revenue            EXPANSION IN USA AND            ACQUISITIONS: TYSON IN
  R$3.9 Bn                   R$30.3 Bn                  AUSTRALIA                   BRAZIL AND MEXICO
                                                   Net Revenue: R$54.7 Bn

                                                                                                                                                          4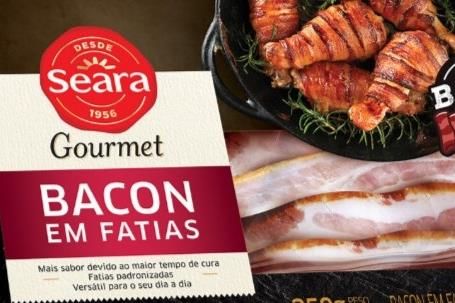
DIVERSIFIED BUSINESS MODEL
Diversified business model eliminates volatility that comes from single protein or single geography
Customer
Product Geography
and Channel
Balanced global portfolio Established presence +275,000 customers
across beef, chicken, pork, lamb in +15 countries in 190 countries
and prepared foods
Opportunity to cross-sell to Reduces exposure to any single Reduces JBS’ dependence on
customers market’s macro environment any one market or customer
Diversifies risk against:
Industry cycles Ability to capitalize on fluctuations Exposure to both traditional and
in worldwide demand and prices high-growth channels
Impact of species-based
diseases and outbreaks
Exports to 190 countries
Changes in consumer on six continents
preferences
Increases access to the market
Diversification Delivers Long-Term Growth and Reduces Volatility
5
OPERATIONAL STRATEGY
Global and diversified production and distribution platform evolving towards value added products
with brands

                                                                     Recognized Brand portfolio, with high value
                                                                     added products and convenience

                            Value added
                            products and
                               Brands

                                      $

                            Profitability                            +275,000 customers and sales to
                                                                     + 190 countries

      Production platform                   Sales and distribution
                                                  platform
                                                                     +400 units in +15 countries

                                                                                                                   6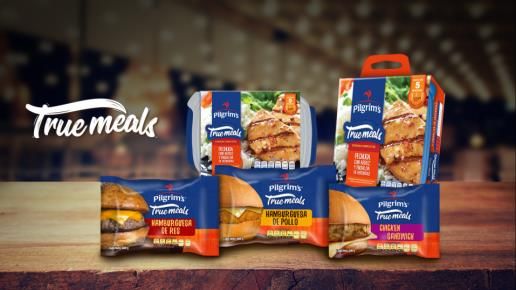
CONSOLIDATED EXPORTS
       JBS exports destinations

                                                                                      Greater China¹        24.0%
                                                                                      Africa & Middle East 13.0%

                                                                                      Japan                 12.7%
                                              3.0%          24.0%                     South Korea            9.9%
                                                  6.6%
                                                                              12.7%   USA                    9.5%

                                       9.5%                                           E.U.                   6.6%

                                                                       9.9%           Mexico                 5.7%
                                5.7%
                                                                                      South America          3.4%
                                                           13.0%                      Canada                 3.0%

                                                                                      Others                12.2%
                                               3.4%
                                                                                             Asia corresponded to

                                                                                               46.6%
                                                                                                of total exports

                                         LTM 2Q19 total exports: US$12.9Bn

                                                                                                                    7
Note 1: Consider China and Hong Kong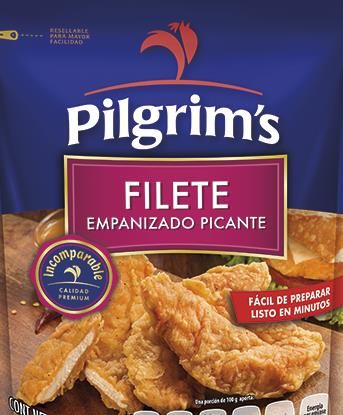
Business Units
JBS USA BEEF
Beef production in the United States, Canada and Australia
Lamb production in Australia USA
Canada
Strategic Initiatives WI
■ Strengthen and expand business with key customers
NE
MI
■ Increase production of higher value-added products UT
CO
PA
■ Continued expansion of more profitable product mix in
domestic markets and exports
AZ
■ Increase operating efficiency
■
GA
In Australia and New Zealand, investments in innovation and TX
in the Primo and Hans brands ~35,500 team members
Recent Performance 18 beef processing facilities
Net Revenue (billion) 42,500 head of cattle per day
06 feedlots
5,6 5,4 5,4
5,0
5,6
US$21.5Bn 06 in Australia
Australia & NZ
43% of LTM 2Q19 02 leather/hides facilities
Revenue 12,900 hides per day
08 carrier units
2Q18 3Q18 4Q18 1Q19 2Q19 08 in the US
09 PFP facilities
EBITDA (million) and %
08 distribution centers
10,2% 8,2% 7,3%
5,0%
8,9%
US$1.6Bn | 7.4% 07 DCs in Australia and 01 in New Zealand
39% of LTM 2Q19 02 lamb facilities
570,1
446,7 393,7 503,1
EBITDA
251,4
01 hog processing facility (Primo)
2Q18 3Q18 4Q18 1Q19 2Q19 9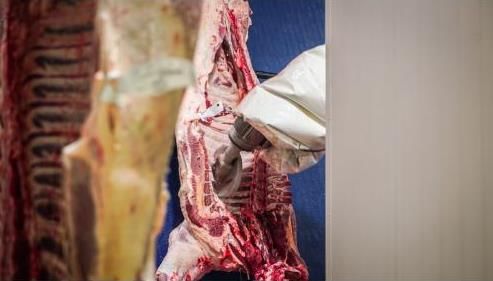
JBS USA PORK
Pork and value added production in the United States
Strategic Initiatives
■ Increase domestic and international commercial partnerships MN
■ Expansion of value-added volume and product mix VT
■
IA
Investments in R&D, prepared products and bacon
IN
■
IL
Continued focus on operational excellence
■ Acquisition of Plumrose in 2017, further enhancing
CA KY
participation in value-added products OK
AR
NC
Recent Performance
MS
Net Revenue (billion)
1,4 1,4 1,4 1,3
1,6 US$5.7Bn
11% of LTM 2Q19 ~11,000 team members
Revenue
2Q18 3Q18 4Q18 1Q19 2Q19
05 hog processing facilities Swift Premium Swift Premium
92,200 hogs per day Rubbed Loin Pork Chops
EBITDA (million) and % Fillet
02 genetic units
7,2% 9,9% 8,4% 7,9% 8,2%
US$488Mn | 8.6% 02 distribution centers
13% of LTM 2Q19 Plumrose
103,4 138,4 117,3 105,4 127,2 EBITDA 07 PFP facilities Ham
Plumrose
Bacon
Example of products:
2Q18 3Q18 4Q18 1Q19 2Q19
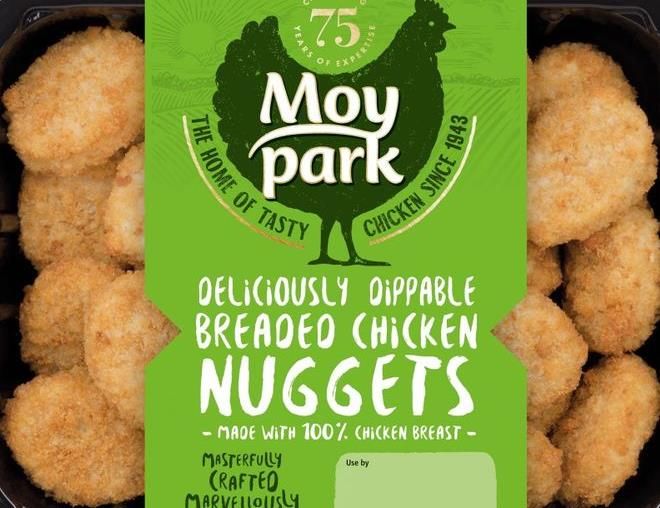
10PILGRIM’S PRIDE
Poultry production in the United States, Mexico, Puerto Rico and Europe
Strategic Initiatives US and Puerto Rico
■ Relentless pursuit of operational excellence
MN
■ Tailored products to help key customers grow WI
■ Develop online channel
■ Growing in Mexico through acquisitions, Greenfields and
brands WA
■ Leveraging Moy Park prepared foods platform KY
VA
■ Investments in value-added and branded products AR TN NC Mexico
AL GA SC
TX
Recent Performance
LA
FL
Net Revenue¹ (billion)
2,8
2,7 2,7 2,7
2,8
US$10.9Bn
22% of LTM 2Q19
Revenue
~55,000 team members
Europe
2Q18 3Q18 4Q18 1Q19 2Q19
EBITDA² (million) and %
36 poultry processing facilities
8.7 million birds per day
10,0%
5,8% 4,2% 7,5%
12,3%
16 PFP facilities
US$821Mn | 7.5% 40,000 tons per month
22 distribution centers
282,5 349,3
27% of LTM 2Q19 21 in Mexico and 01 in Puerto Rico
156,0 111,0 204,4 EBITDA
2Q18 3Q18 4Q18 1Q19 2Q19
11
Note 1: includes Moy Park results in all quarters; Note 2: Adjusted EBITDA in accordance with PPC earnings releaseSEARA
Production of prepared foods and fresh poultry and pork products in Brazil
Strategic Initiatives
■ Increase value-added product mix
■ Focus on small retail and increase sales through distributors to broaden
presence
■ Develop Seara Gourmet as a premium brand CE
■ Expand export market opportunity with an enhanced go-to market strategy
PE
through partnerships with importers / distributors in key destination markets
■ Increase distribution in the Middle East and China BA
MT
DF
Recent Performance
Net Revenue (billion) MS MG
5,0 5,1
4,6
4,1 4,2
R$18.9Bn RJ
~73,000 team members SP
9% of LTM 2Q19 PR
Revenue SC
30 poultry processing facilities
2Q18 3Q18 4Q18 1Q19 2Q19 5.2 million birds per day RS
EBITDA (million) and % 08 hog processing facilities
26,450 hogs per day
10,3% 10,3% 11,1%
5,5% 6,6%
R$1.8Bn | 9.7% 19 PFP facilities
115,000 tons per month
512,1 474,2 563,4 11% of LTM 2Q19
226,7 278,0
EBITDA 18 distribution centers
2Q18¹ 3Q18 4Q18 1Q19 2Q19
12
Note 1: Adjusted EBITDA excluding the R$112.9 million impact from the truckers strike in Brazil at Seara.JBS BRAZIL
Beef production in Brazil, in addition to leather and other Related Businesses
Strategic Initiatives
■ Diversified production base across 15 Brazilian states
■ Continued diversification of products and brands
PA CE
■ Further strengthen strategic partnerships with key customers in
domestic and export markets to improve product mix
AC TO PE
■ Relentless pursuit of operational excellence
RO
BA
MT
Recent Performance GO
MG
Net Revenue (billion) ~50,900 team members
MS
7,6 7,5
6,8
7,2 R$29Bn RJ
6,2
35 beef processing facilities
15% of LTM 2Q19 34,200 head of cattle per day PR SP
Revenue
03 feedlots
2Q18 3Q18 4Q18 1Q19 2Q19 16 leather/hides facilities¹ RS
49,000 hides per day
EBITDA (million) and %
26 distribution centers
9,3%
5,6% 3,9% 2,9% 4,7%
07 PFP facilities
R$1.5Bn | 5.3% 19,000 tons per month
350,0
706,5
335,8
10% of LTM 2Q19 11 Related businesses
293,1
195,0 EBITDA
2Q18 3Q18 4Q18 1Q19 2Q19
13
Note 1: Does not consider facilities outside Brazil2Q19 Consolidated Results
2Q19 HIGHLIGHTS
Record EBITDA of R$5.1Bn, with a 10.0% EBITDA margin
Net revenue increased by 12.5%, from R$45.2Bn to R$50.8Bn
Consolidated gross profit grew by 13.6% to R$7.9Bn, with a 15.6% gross margin
Net income was R$2.2Bn, an EPS of R$0.82
Operational cash flow of R$5.2Bn and free cash flow of R$3.7Bn
Leverage in Reais reduced to 2.78x from 3.47x in 2Q18
152Q19 CONSOLIDATED RESULTS
Net Revenue (R$ million) Gross Profit (R$ million) / Gross Margin (%)
191,934 15.5% 15.6%
14.6% 14.6%
27,974
+12.5%
45,176 50,842 49,641 +13.6%
6,987 7,937 7,225
2Q18 2Q19 LTM 2Q19 (R$) LTM 2Q19 (US$) 2Q18 2Q19 LTM 2Q19 (R$) LTM 2Q19 (US$)
EBITDA (R$ million) / EBITDA Margin (%) Net Income/Loss (R$ million)
9.4% 10.0%
8.4% 8.4%
16,114
3,706
+20.3% 2,183
4,238 5,099 4,157
(911) 961
2Q18 2Q19 LTM 2Q19 (R$) LTM 2Q19 (US$) 2Q18 2Q19 LTM 2Q19 (R$) LTM 2Q19 (US$)
162Q19 CONSOLIDATED RESULTS
Operational Cash Flow (R$ million) Net Debt Financial Expense Free Cash Flow (R$ million)
Interest (R$) Interest (US$)
13,695
-8.0% +92,6% 6,884
+46% 882.6 882.3
5,210 3,717
3,568 3,516 1,930 1,755
244.8 225.1
2Q18 2Q19 LTM 2Q19 LTM 2Q19 2Q18 2Q19 2Q18 2Q19 LTM 2Q19 (R$) LTM 2Q19
(R$) (US$) (US$)
Cash flow generated by operational activities In 2Q19, interest in US$ from net Free cash flow in 2Q19 was
R$3.7Bn
increased by 46% in 2Q19, reaching debt reduced by
R$5.2Bn U$19.7Mn
An increase of 92.6% compared to 2Q18
¹ Cash Flow from Operational Activities net of interest
² Free Cash Flow represents Free Cash Flow after Investments
17DEBT PROFILE
Gross Debt Reduction (US$ Bn) Net Debt (Bn)/Leverage
2Q19 ending cash balance
US$3.16 billion/(R$12.1 billion¹) Net Debt (R$) Net Debt (US$)
was R$6.3Bn Leverage (R$) Leverage (US$)
Additionally, JBS USA has
3.47
US$1,919.4 million (R$7.355,5
16.5
million)¹ in fully available
3.20
unencumbered line under
revolving credit facilities
14.4
3.10 2.78
Total liquidity in 2Q19 was 13.3 2.98
R$13.6Bn 50.5 48.7 44.8
2.81
Almost 4.5x higher than short-
term debt 13.1 12.5 11.7
2Q18 1Q19 2Q19 2Q18 1Q19 2Q19
Debt profile ST/LT Source breakdown Region breakdown Currency and cost breakdown
ST Commercial Banks 16.7% 7.94% p.a.
5.9% Reais
International
72.2%
2.9%
LT
94.1% Brazil
27.8% Dollar
97.1%
Capital Markets
83.3%
5.94% p.a. 18
¹ Converted using the prevailing FX rate at the end of the 2Q19 (R$3.8322)LIABILITY MANAGEMENT
Debt Amortization Schedule as of June 30th (in US$ million) Debt Amortization Schedule after LM (US$ million)
Cash Cash
3,561 3,164
2,666 Revolving credit facilities 2,666 Revolving credit facilities
1,919 2,062 1,919 2,062
1,670 1,642
1,455 1,432 1,432
1,306 1,250
836 892 956 920 836
1,642 788 741
1,245
174 205 174
43 43
Caixa Curto
Cash Short 2020 2021 2022 2023 2024 2025 2026 2027 2028 2029 Caixa
Cash Curto
Short 2020 2021 2022 2023 2024 2025 2026 2027 2028 2029 2030
Prazo
Term Prazo
Term
Average term: 5.8 years Average term: 7.0 years
JBS Bond Yield-To-Maturity Evolution (%) Stock Performance JBSS3 (Base 100)
230%
JBSS3 IBOV 222.3%
8.0 YTM reduction of 180.5 bps in the JBS USA 2028 bond
180%
7.5
7.0 130%
6.5
80%
6.0 5.808
5.749
5.5 30% 29.2%
5.656
5.0
-20%
JBS USA 2028 JBS Brazil 2026 JBS USA 2029
19Other Relevant Topics
SUSTAINABILITY HIGHLIGHTS
                                                                                                              There was a 29% reduction in the
            The Company invested around R$300Mn                       More than   135,000 team               number of accidents resulting in lost
                    in the safety of its Team                      members received Occupational              time and 55% reduction in the
                      Members worldwide.                           Health & Safety training worldwide.
                                                                                                             number of lost days JBS worldwide.

                                                                        Over 13.3 Thousand
                    JBS invested R$88.2Mn                                                                   JBS is the world’s Largest
                                                                                                                                Organic
                                                                    Team Members and producers
      to improve animal welfare practices across all its global
                           operations.
                                                                   worldwide received animal welfare               Chicken Producer
                                                                                training.

                                                                                                             In its most recent audit, in 2017, the
  Around 80   thousand registered Brazilian cattle suppliers are   This exclusive JBS monitoring system
                                                                                                             Company obtained the best result
       assessed daily using satellite imagery, farm geo-           covers over 59 million ha in             since auditing began in 2014, with
   referencing data and information from government agencies.              the Amazon region
                                                                                                             99.99% of purchases in compliance

                                                                   81% of the water       captured and       Worldwide, the Company currently
     JBS invested more than R$27Mn on management and                                                           reuses 3.36% of its water,
                                                                    used in JBS’s industrial processes is
   measurement and initiatives to reduce water usage and reuse
                                                                   treated and safely returned to           equivalent to more than 6 billion
                         water worldwide.
                                                                             the environment.                              liters
  JBS has produced an annual inventory of greenhouse gas
                                                                                                              The Company reused  1.2Mn
    emissions in Brazil since 2009, based on the international
                                                                   Globally, more than R$160Mn has             tons of waste in 2018 for
     GHG Protocol methodology. It is also published an annual
                                                                        been invested in energy              composting, recycling, energy reuse
     inventory since 2012, which can be viewed on the Public
                                                                            efficiency projects.            and energy cogeneration, equivalent
     Emissions Records Platform maintained by the Brazil GHG
                         Protocol Program.                                                                    to 53.58% of all waste generated
                                                                                                                                                      21
COMPLIANCE
JBS Compliance Pillars
Whistleblower
channel Controls
JBS has implemented a number of
Polices and Training and
initiatives to strengthen its compliance communication
Procedures
culture, such as the ALWAYS DO IT RIGHT
program, where each employee serves as
a multiplier of best practices.
Risk Due Diligence
JBS received an 8.1 grade on the Third-Parties
Assessment
Transparency International ranking – the
average grade in Brazil is 5.7.
Leadership and EFFECTIVE Assessments,
Governance Supervision and
The company is a signatory of the Business COMPLIANCE Discipline
Integrity and Anticorruption Compact from
the Ethos Institute, and has implemented a
Global Code of Ethics & Integrity.
22INNOVATION
Globally, JBS innovates across four main food product platforms
Healthy and Natural Family and
Choices Connections pleasers
Functional products Easy to cook food for
with high standards of eating with family
traceability and low social and friends
and environmental impact
Indulgence and
Cook, Sensory
Prepare and Eating
High-quality foods that
Products that are quick
enchant the senses
and easy to make and
and provide unique
offer high nutritional
experiences
performance
As part of a strategic partnership that began in 2017, JBS USA contributed US$ 12.5 million (R$ 45.6 million) to the Colorado State
University (CSU) to support education and research. US$ 7.5 million was used to build the JBS Global Food Innovation Center which
was unveiled on the University campus on April 9, 2019.
23INNOVATION
Breakthrough Ideas From the Global Leader in Protein
S e a r a G o u r m e t launched T h e
P i l g r i m ’ s M e x i c o launched T r u e
I n c r e d i b l e B u r g e r , an option for
M e a l s , to deliver a u t h e n t i c meals with
v e g a n s with an unmistakable beef flavor, but
great flavor and c o n v e n i e n c e
with 1 0 0 % v e g e t a b l e i n g r e d i e n t s
P r i m o launched B a l a n c e d B l e n d , a line
P l u m r o s e U S A launched K n o c k O u t
of f r e s h s a u s a g e s with 2 5 %
M e a t s , a line of fully cooked r i b s with high
v e g e t a b l e content for consumers looking to
quality meat and u n i q u e t w i s t s o n
add more veggies in their diets
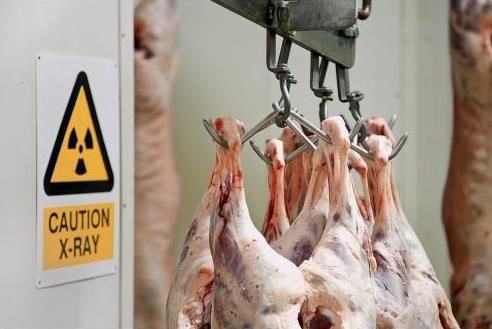
f l a v o r s consumers love 24TECHNOLOGY
Scott is an innovative company with capability and proprietary manufacturing and
production technology servicing key international customers across a range of sectors
including meat and food processing. In the food and meat sectors, Scott is the proven
global leader in robotic and x-ray manufacturing technology
Has been a public company since 1997 and its shares are traded on New Zealand Stock
Exchange
accuracy required to maximize
Provide
yield and remove the risks and loss of
yield associated with the use of unskilled labor
improve safety to the labor and reduce the
risk of serious injuries caused by the handling of the
equipment
25OUR MISSION “To be the best in all that we do, completely focused on our business, ensuring the best products and services to our customers, a relationship of trust with our suppliers, profitability for our shareholders and the opportunity of a better future for all of our team members.”
You can also read