Innovation Matters - Roadshow| November 2019 - Elmos Semiconductor AG
←
→
Page content transcription
If your browser does not render page correctly, please read the page content below
Innovation Matters

Roadshow| November 2019
Expert in analog mixed signal IC solutions
focused on automotive market
35 years experience Worldwide leading products Ready for further growth
Development, production & Elmos serves the megatrends Global player for automotive
marketing of ICs (ASSPs and (ADAS, EV…) & attractive niches ASSPs and ASICs
ASICs) with benchmark innovations Recently significant addition to
Sales (in 2018): ~85% automotive #1 positions: design/application resources
~15% non‐automotive Ultrasonic Parking Assistance Fablite: Flexible production
Main strength: design of Ambient LED Light footprint for Frontend and
innovative products through in‐ Climate Applications soon Backend (Test) guaranties
depth automotive system, competitive cost structure
architecture and application Gesture Control
know how Soon Rear Light LED & more…
From a statistical point of view: ~5 Elmos ICs in every new car now!
IC = Integrated Circuit / ASSP = Application Specific Standard Product / ASIC = Application Specific Integrated Circuit 2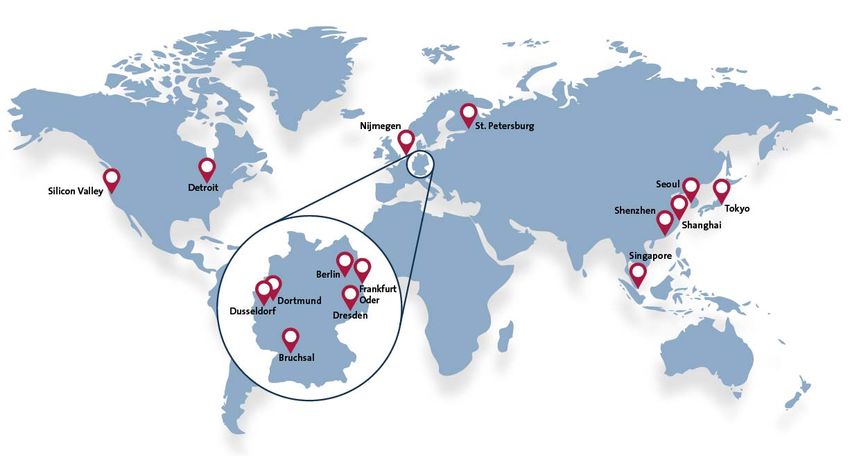
An international company with German roots
Sold
Headquarters in Dortmund, Germany
Worldwide sales offices and application support
~1.300 employees
~350 employees in Product Development
On Sep 30, 2019 Elmos sold SMI (Silicon
Microstructures Inc. / Silicon Valley) for a net debt‐
free enterprise value of USD 95.0 million
3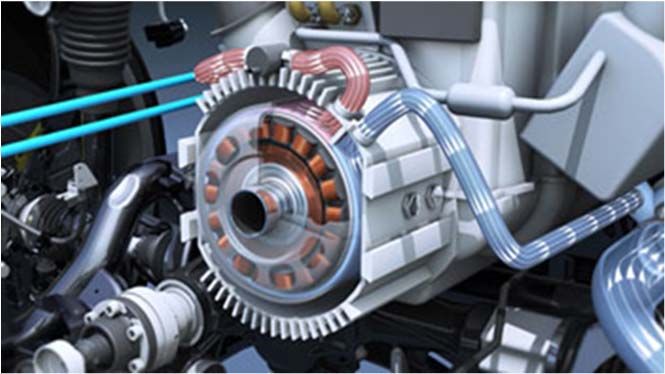
Attractive sale of SMI for a net debt free EV of
USD 95 million to TE Connectivity
Excellent products, few synergies Medical market: expansion ahead Attractive deal conditions
Elmos bought SMI in 2001 New promising SMI product line: Net debt‐free EV value of USD
SMI offers market‐leading IntraSense 95.0 million (3.4x external
MEMS pressure sensors for Smallest in vivo‐sensor system revenue in 2018) / Closing of the
automotive, industrial and for many medical applications be deal only one week after signing
medical applications it diagnosis or therapy Analysts´: “…management can
Limited intercompany IntraSense won the Best of Sensors not only draw its own capacities
synergies Expo Award at the Sensors Expo towards strengthening the
SMI represents ca. 9% of total and Conference in San Jose, CA company’s core business lines,
Elmos group revenue but even more importantly
access a well‐filled war chest.”
Elmos will concentrate on accelerating its core IC‐business
4
We know what the customer needs:
Strong customer base – growing every year
Elmos´ relationship with Tier1s and OEMs Approved partner
>500 million ICs p.a.
delivered to
300++ customers
Elmos ICs are in
Tier1 Elmos ICs OEM almost all cars
worldwide
High product and
Ideas & Ideas & customer
Features Features diversification
5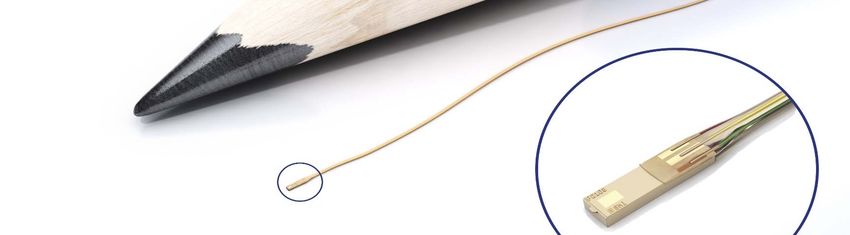
We are an innovative partner for a diversified
customer base
Selected customers

Automotive OEMs

                                            Baojun

                                                     6
Automotive is becoming the next smart device
Elmos is present in the highest growing sub‐segments

   Semi growth rate by application (CAGR 2016‐21)                                                    Elmos ICs for growing segments

                                          EV
                                  (Battery + Plug‐In)

                     Distance Warning
                (Emergency Braking + Parking)

                          Advanced Display / HMI

                        BLDC motors
                (HVAC, pumps, engine cooling)

                                          LED Lighting

                                                   Safety

                                           Rain Sensor

                                                             0%     5% 10% 15% 20% 25% 30% 35% 40%

Source: Strategy Analytics / for BLDC motors: LMCA CAGR 2019‐2024                                                                     7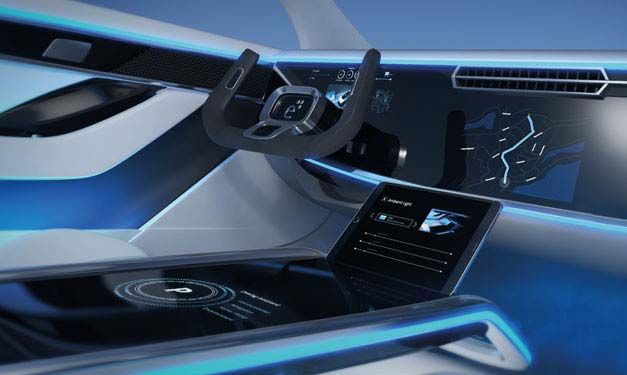
Innovative products and strong market positions
serve the mega trends
Business Line 1 ‐ Sensors
 Ranging                           Sensor ICs                      Optical

Business Line 2 – Smart Control                                   Business Line 3 ‐ Smart Solutions
 Lighting                          Motor Control                   Safety, Power & Custom ICs

            Right products for autonomous driving, electro mobility, safety, comfort...

                                                                                                  8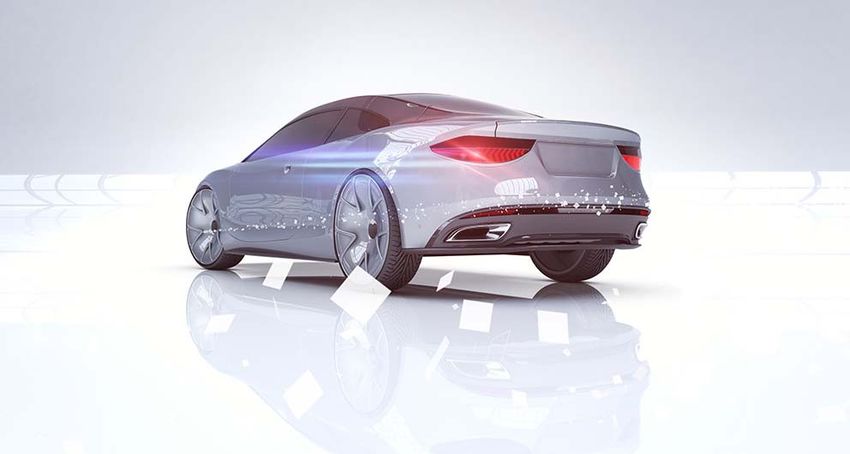
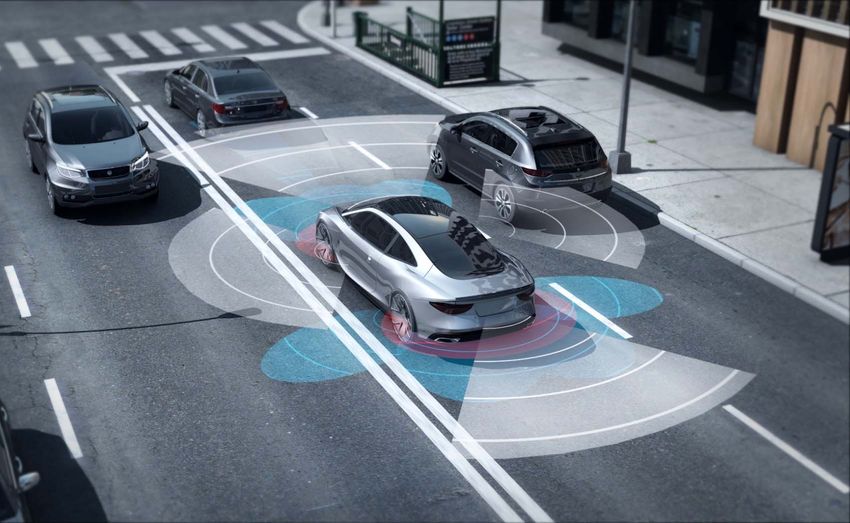
Ranging:
Advanced features for assisted and autonomous driving
Global market leader in Ultrasonic ICs
~1 billon ICs for near field surveillance
delivered
>20 years experience with USPA ICs
>10 ASSPs: Broad product portfolio
from most affordable to highest
performance
Applications e.g. object localization, level
measuring and flow metering
Next IC generations in development
Ultrasonic ICs will be an indispensable part for autonomous driving
9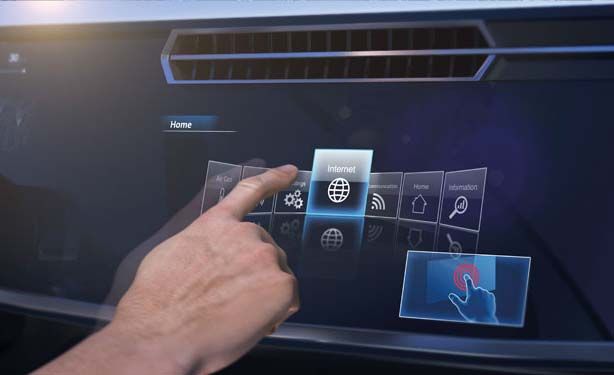
Optical:
Simple & robust user experience in cars
Pioneering in gesture control with
>50 million ICs in the field
Applications e.g. proximity, swipes,
object detection and touchless door
access
2012: Market launch (VW Golf 7)
Today: available in almost all VW group
models – started in BMW models
… more OEMs to come
Technically leading IP protected
Most cost effective solution available
Makes the car more intuitive through less distraction
10Lighting:
We light up the car – inside and outside
>30++ million Ambient Light ICs p.a.
IP protected features (Auto addressing)
Homogeneous light from ‐40°C to
+125°C
Elmos rear lighting solutions set the
standard
Elmos ICs already standard for
two OEMs
Next worldwide #1 position
Constant light intensity even at high
temperatures
Significant cost saving making the best
use of the system architecture
More light quality and higher power efficiency at lower cost
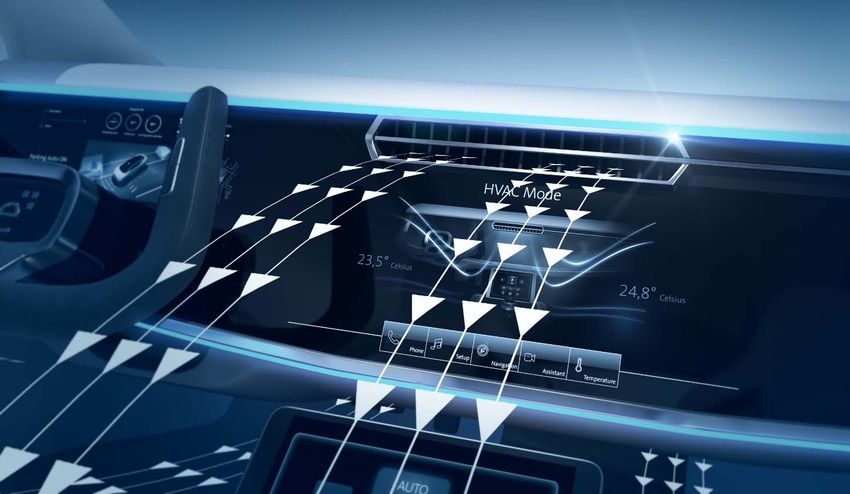
11Motor control:
Highly integrated motor control ICs
>500 million ICs for HVAC flaps and
blowers delivered
Benchmark for low noise and high
efficiency control solutions for HVAC
Serving all motor types
Focus on BLDC motors supporting CO2
reduction
The trend towards BLDC motors is accelerating our growth
12Further milestones of main strategic pillars achieved
Fablite Internationalization ASSPs
~50%
Outsourcing share (wafer) Asian share ASSP share ~45%
~39% ~41% ~40%
~33% ~35% ~35%
~31%
~25% ~27% ~25%
~15% ~15%
~12%
2014 2015 2016 2017 2018 2014 2015 2016 2017 2018 2014 2015 2016 2017 2018
Front‐End: Continuously Successful Asian expansion >140 ASSP products plus many
increasing outsourcing share with disproportionately strong ASICs
while own fabs are fully loaded growth in Asia for >5 years Design Wins
(contract with FhG until 06/2020) 2018: very good year
Back‐End: Second wave of 2019: on the same path as 2018
outsourcing while own test Successful customer and product
capacities are kept diversification
ASSP = Application Specific Standard Product / ASIC = Application Specific Integrated Circuit 13Elmos increases sales and gross margin
Yearly sales (million Euro) & gross margin (%) 9M sales (million Euro) & gross margin (%)
+10.8% +8.5%
219.1
277.6 202.0
250.4
219.6 228.6
209.5 46.7%
45.2% 43.7%
43.6% 43.9%
41.7% 42.3%
2014 2015 2016 2017 2018 9M 2018 9M 2019
Sales growth due to existing products and new Positive sales primarily attributable to the
ramp ups success of our products even in a difficult
Higher gross margin despite more complex market environment
products and numerous new ramp ups Book‐to‐bill ratio was slightly above one at
the end of the period
Sales CAGR 2014‐2018: +7.3% 14Solid earnings development
Yearly EBIT (million Euro) & EBIT margin (%) 9M (op.) EBIT (million Euro) & op. EBIT margin (%)
+32.8% +0.5% Reported EBIT
51.0 34.1 34.3 96.2
million Euro
38.4
22.6 24.5 23.1
18.4% 16.9% 15.6%
15.3%
10.8% 11.2% 10.1%
2014 2015 2016 2017 2018 9M 2018 9M 2019
Five years double‐digit EBIT margin in a row Operational EBIT reflects, among other
EBIT margin achieved mid‐term target level in things, increased R&D expenses as well as
2017 and 2018 consulting costs in the course of the SMI sales
process
EPS increased by 42.0% to 1.79 Euro in 2018 The sale of SMI resulted in an other operating
(2017: 1.26 Euro) income of 61.9 million Euro in
Q3 2019 which led to an increase of the
reported EBIT to 96.2 million Euro in the first
9M 2019
15Investing in further growth:
Capex in line with FY Guidance
Capex (million Euro & % of sales) Operating Cash Flow (million Euro)
41.4
37.2 50,3 48,4
32.7 40,0
29.9 37,9
1 33,5 32,6
23.0 23.2
14.3% 14.9% 14.9%
10.5% 10.1% 14.9%
2014 2015 2016 2017 2018 9M 2019 2014 2015 2016 2017 2018 9M 2019
Adjusted Free Cash Flow (million Euro) Net cash (million Euro)
−
‐76.2 70.3
Supported
Supported by the 53.7 55.4 Supported by the
by tax effects
cash inflow of the 47.0 cash inflow of the
Burdened SMI sale SMI sale
29.7 1 by tax effects 33.2
10.6 9.1 16.9
−5.2 −3.3
2014 2015 2016 2017 2018 9M 2019
2014 2015 2016 2017 2018 9M 2019
Definition of selected financial indicators
‐ Adjusted free cash flow: Cash flow from operating activities less capital expenditures for/plus disposals of intangible assets and property, plant and equipment (Including proceeds from disposals of the consolidation scope)
‐ Capital expenditures: Capital expenditures for intangible assets and property, plant and equipment less capitalized development expenses 16
1 Disregarding one‐off effect from sale and lease back structure of ca. 14 million EuroSolid dividend policy since 2010
Dividend (in Euro) & total payout (in million Euro)
+30%
0.52
11
+14%
7.9* 10
+32% 0.40 10.2
0.35 9
+25% 0.33 0.33
8
0.25 0.25 0.25 6.9
6.5 6.5 7.9 7
0.20
6
4.8 4.8 4.8
5
3.9
4
3
2010 2011 2012 2013 2014 2015 2016 2017 2018
Share buyback
2017: Purchase of 450,000 shares for a total of 9.7 million Euro
2018/2019: Resolution to purchase up to 1 million shares for a total of roughly 21 million Euro and a
maximum of 21 Euro per share
17Investment case:
Sustainable growth profile and profitability
Attractive Market Efficient Competent Solid financial
market fitting ICs production Management profile
Megatrends: Good mix of ASICs Flexible Entire Earnings level higher
ADAS and ASSP products production management than 15% in 2017 and
Electrification footprint with board with 2018
Safety & Growing success in Fablite guarantees extensive
comfort Asian markets competitive cost experience and a Strong financial basis
structure successful track with low leverage and
Semi content is Winning market record net cash position
outperforming share with Access to
car sales innovative ICs e.g. advanced Well balanced Solid dividend policy
LED drivers, HMI, technology nodes semi and
Hybrid and EV sensor solutions automotive
offer additional Upside potential knowledge
potential Increasing number by more
of #1 products outsourcing
18Positive outlook for 2019 ‐ Guidance updated after SMI sale As of September 30, 2019 As of February 14, 2019 As of February 13, 2019 Sales 4%‐8% (yoy) 6%‐10% (yoy) EBIT margin 13%‐17% (operational) 13%‐17% Capex
The Next Smart Device: The Car

                                 Appendix
Elmos shareholder structure set for long‐term perspective
Basic
Event information Date Shareholder structure
Share capital 20,103,513 €/shares
ISIN / WKN DE0005677108 / 5677108
Admission segment Prime Standard, Reg. Market
20.0%
Ticker symbol ELG
Date of formation 1984
Free float
IPO October 11, 1999
48.8%
Analysts‘ Rating 3x Buy / 3x Hold 14.1%
Share chart Xetra 5 years (Nov. 3, 2014 – Oct. 31, 2019)
3.0% 14.8%
28 4.1%
6.6%
24 2.3%
20
Weyer Beteiligungsgesellschaft mbH and related parties
16 ZOE‐VVG GmbH and related parties
Jumakos Beteiligungsgesellschaft mbH
12 Treasury Stock
Free float, thereof:
8 6.57% Teslin Capital Management BV as of May 15, 2019
4.06% JPMorgan Asset Man. (UK) Lim. as of Nov 04, 2019
11/03/2014 01/01/2017 10/31/2019 3.04% WA Holdings Inc. as of Aug 13, 2019
All data as of Nov 06, 2019 21Research Coverage and Elmos Financial Calendar
Institution
Institution Analyst
Analyst Recommendation
Recommendation
Deutsche Bank Johannes Schaller Hold
DZ Bank Harald Schnitzer Hold
Hauck & Aufhäuser Christian Sandherr Hold
NIBC Edwin de Jong Buy
Oddo BHF Stéphane Houri Buy
Warburg Research Malte Schaumann Buy
Event
Event Date
Date
Quarterly Results Q3 2019* November 6, 2019
Equity Forum in Frankfurt November 25‐26, 2019
* The German Securities Trading Act (Wertpapierhandelsgesetz) and the Market Abuse Regulation (EU) oblige issuers to immediately announce any information that may have a substantial price impact,
irrespective of the communicated schedules. Therefore it is possible that we will announce key figures of quarterly and annual results ahead of the dates listed above. As we can never rule out changes of
dates, we recommend checking dates and news ahead of schedule on the Company’s website (www.elmos.com).
As of October 1, 2019 22Elmos Semiconductor AG
Heinrich‐Hertz‐Str. 1 | 44227 Dortmund | Germany
Telephone: + 49 231 75 49 7859 | Telefax: + 49 231 75 49 111
invest@elmos.com | www.elmos.com
DISCLAIMER
This presentation contains forward‐looking statements based on beliefs of Elmos‘ management.
Such statements reflect the company‘s current views with respect to future events and are
subject to risks and uncertainties. Many factors could cause the actual results to be materially
different, including, among others, changes in general economic and business conditions,
changes in currency exchange rates and interest rates, introduction of competing products, lack
of acceptance of new products or services and changes in business strategy. Actual results may
vary materially from those projected here. Elmos does not intend or assume any obligation to
update these forward‐looking statements.
23You can also read