Borr Drilling Limited Company presentation Q4 2018 Results - 28 February 2019

 
CONTINUE READING
Borr Drilling Limited Company presentation Q4 2018 Results - 28 February 2019
Borr Drilling Limited
Company presentation
Q4 2018 Results
28 February 2019

                        |
Borr Drilling Limited Company presentation Q4 2018 Results - 28 February 2019
Important information and disclaimer
This presentation (the “Presentation”) has been prepared by Borr Drilling Limited (the “Company”) and sets forth general background information about the Company's activities current as at the date hereof. Information in this
Presentation, including forecast financial information, should not be considered as advice or a recommendation to investors or potential investors in relation to holding, purchasing or selling securities or other financial products or
instruments and does not take into account your particular investment objectives, financial situation or needs. Before acting on any information you should consider the appropriateness of the information having regard to these
matters, any relevant offer document and in particular, you should seek independent financial advice. All transactions in securities and financial product or instrument involve risks, such risks include (among others) the risk of adverse
or unanticipated market, financial or political developments and, in international transactions, currency risk.
No representation, warranty, or undertaking, express or implied, is made by the Company, its affiliates or representatives, and no reliance should be placed on, the fairness, accuracy, completeness or correctness of the information or
the opinions contained herein, for any purpose whatsoever. Neither the Company nor any of their advisors or representatives shall have any responsibility or liability whatsoever (for negligence or otherwise) for any loss howsoever
arising from any use of this Presentation or its contents or otherwise arising in connection herewith. All information in this Presentation is subject to updating, revision, verification, correction, completion, amendment and may change
materially and without notice. Neither the Company or its affiliates or agents undertake any obligation to provide the recipient with access to any additional information or to update this Presentation or any information or to correct any
inaccuracies in any such information. The information contained in this Presentation should be considered in the context of the circumstances prevailing at the time and has not been, and will not be, updated to reflect material
developments which may occur after the date hereof.
Matters discussed in this Presentation and any materials distributed in connection herewith may constitute or include forward-looking statements. Forward-looking statements are statements that are not historical facts and may be
identified by words such as “believes”, “expects”, “anticipates”, “intends”, “estimates”, “will”, “may”, “continues”, “should” and similar expressions. These forward-looking statements reflect the Company’s beliefs, intentions and current
expectations concerning, among other things, the Company’s results of operations, financial condition, liquidity, prospects, growth and strategies. Forward-looking statements include statements regarding: objectives, goals, strategies,
outlook and growth prospects; future plans, events or performance and potential for future growth; liquidity, capital resources and capital expenditures; economic outlook and industry trends; developments of the Company’s markets;
the impact of regulatory initiatives; and the strength of the Company’s competitors. Forward-looking statements involve risks and uncertainties because they relate to events and depend on circumstances that may or may not occur in
the future. The forward-looking statements in this Presentation are based upon various assumptions, many of which are based, in turn, upon further assumptions, including without limitation, management’s examination of historical
operating trends, data contained in the Company’s records and other data available from third parties. Although the Company believes that these assumptions were reasonable when made, these assumptions are inherently subject to
significant known and unknown risks, uncertainties, contingencies and other important factors which are difficult or impossible to predict and are beyond its control. Forward-looking statements are not guarantees of future performance
and such risks, uncertainties, contingencies and other important factors could cause the actual results of operations, financial condition and liquidity of the Company or the industry to differ materially from those results expressed or
implied in this Presentation by such forward-looking statements. No representation is made that any of these forward-looking statements or forecasts will come to pass or that any forecast result will be achieved and you are cautioned
not to place any undue influence on any forward-looking statement.
This Presentation and the information contained herein does not constitute or form a part of, and should not be construed as, an offer for sale or subscription of or solicitation or invitation of any offer to subscribe for or purchase any
securities of the Company and neither this Presentation nor anything contained herein shall form the basis of, or be relied on in connection with, any offer or commitment whatsoever. By reviewing this Presentation, you acknowledge
that you will be solely responsible for your own assessment of the market position of the Company and that you will conduct your own analysis and be solely responsible for forming your own view of the potential future performance of
the Company’s business.
By reviewing this Presentation, you are deemed to have represented and agreed that you and any persons you represent are located outside of the United States. This Presentation is only addressed to and directed at persons in
member states of the European Economic Area who are “qualified investors” as defined in the Prospectus Directive (Directive 2003/71/EC) (“Qualified Investors”). In addition, in the United Kingdom, this Presentation is being
distributed only to, and is directed only at (i) investment professionals falling within Article 19(5) of the Financial Services and Markets Act 2000 (Financial Promotion) Order 2005 as amended (the “Order”) or (ii) high net worth entities
and other persons to whom it may lawfully be communicated, falling within Article 49(2)(a) to (d) of the Order (all such persons together as amended being referred to as “Relevant Persons”). This Presentation must not be acted on or
relied on (i) in the United Kingdom, by persons who are not Relevant Persons, and (ii) in any member state of the European Economic Area other than the United Kingdom, by persons who are not Qualified Investors. Any investment
or investment activity to which this document relates is available only to Relevant Persons or Qualified Investors or will be engaged in only with Relevant Persons or Qualified Investors.
The information in this Presentation is given in confidence and the recipients of this Presentation should not base any behaviour in relation to qualifying investments or relevant products, as defined in the Financial Services and
Markets Act 2000 (“FSMA”) and the Code of Market Conduct, made pursuant to the FSMA, which would amount to market abuse for the purposes of the FSMA on the information in this Presentation until after the information has
been made generally available. Nor should the recipient use the information in this Presentation in any way that would constitute “market abuse”.
Neither this document nor any copy of it may be taken, released, published, transmitted or distributed, directly or indirectly, in or into the United States, Canada, Australia or Japan. Any failure to comply with this restriction may
constitute a violation of United States, Canadian, Australian or Japanese 4C Securities laws. This document is also not for publication, release or distribution in any other jurisdiction where to do so would constitute a violation of the
relevant laws of such jurisdiction nor should it be taken or transmitted into such jurisdiction and persons into whose possession this document comes should inform themselves about and observe any such relevant laws. No money,
securities or other consideration is being solicited, and, if sent in response to this Presentation or the information contained herein, will not be accepted.

                                                                                                                                                                                                              2|
Highlights

▪ Operating revenues of US$53.5 million, EBITDA of negative US$18.7 million and net loss of US$110.7 million for
  the fourth quarter of 2018

▪ Operating revenues of US$164.9 million, EBITDA of negative US$65.8 million and net loss of US$190.9 million for
  the year ended December 31, 2018

▪ Added total backlog of 108 months in the fourth quarter of 2018 with estimated total revenue of US$257 million

▪ Technical utilisation for the operating rigs was 99.6% in the fourth quarter of 2018

▪ Took delivery of the premium jack-up rig “Natt” in October 2018 from PPL Shipyard

▪ Realised US$16.1 million in cash proceeds from sale of forward contracts in a listed offshore drilling company and
  recorded a mark to market loss on existing position of US$32.2 million in the fourth quarter of 2018. The market
  value of the securities portfolio has increased by US$15 million since the balance sheet date

▪ Secured US$160 million revolving credit and guarantee facility in the first quarter 2019

The Comany uses certain financial information calculated on a basis other than in accordance with accounting principles generally accepted in the United States (US GAAP) including
EBITDA. EBITDA as used herein represent net loss less: depreciation and impairment of non-current assets, amortisation of contract backlog, net financials, gain from bargain purchase and
income tax expense. EBITDA is included as a supplemental disclosure because the Company believes that the measure provides useful information regarding the Company’s operational
performance.
                                                                                                                                                                                             3|
Key Financials Q4 2018
                                                 Income Statement                                               Comments Q4 2018
                                                                                                      ▪ Revenues: on average 8.6 operating rigs
USDm                                                                    FY 2018   Q4 2018   Q3 2018     in the fourth quarter. Mist and Prospector
                                                                                                        1 entered operation in the quarter.
Operating revenues                                                       164.9      53.5      49.7
                                                                                                      ▪ Rig operating and maintenance expenses
Gain on disposals                                                         18.8       1.3        -
                                                                                                        affected by certain one offs in Q4:
Rig operating and maintenance expenses                                  (180.1)    (59.5)    (45.7)      - US$4.6 million release of tax accrual in
Depreciation and impairments                                             (79.5)    (23.8)    (21.5)        Q3 not repeated in Q4.
Amortisation of contract backlog                                         (24.2)     (8.5)     (9.7)      - incremental costs related to software
                                                                                                           licenses of US$2.2 million
G&A                                                                      (38.7)    (10.8)     (9.7)
                                                                                                         - higher operating expenses related to
Restructuring costs                                                      (30.7)     (3.2)     (4.6)        the contract preparation, mobilisation
Total operating expenses                                                (353.2)   (105.8)    (91.2)        and start-up of operations for the “Mist”
Operating loss                                                          (169.5)    (51.0)    (41.5)        in the fourth quarter 2018
                                                                                                      ▪ Net financial items includes:
Net financial items                                                      (57.0)    (59.2)      4.5       - mark-to-market loss on forward
Gain from bargain purchase                                                38.1        -         -
                                                                                                           contracts of US$32.2 million
                                                                                                         - mark-to-market loss on the Call Spread
Loss before tax                                                         (188.4)   (110.2)    (37.0)
                                                                                                           derivative related to the convertible
Tax                                                                       (2.5)     (0.5)     (2.0)        bonds of US$16.9 million
Net (loss) attributable to non-contr. interests                           (0.4)     (0.2)      0.1       - gross interest expense of US$14.8
Net loss for the period attributable to shareholders of Borr Drilling                                      million, offset by capitalised interest of
Limited                                                                 (190.5)   (110.5)    (39.1)        US$6.3 million.
Basic loss per share ($/share)                                          (0.371)   (0.210)   (0.073)
                                                                                                      ▪ Based on signed contracts, the Company
                                                                                                        expects positive cash from operations
                                                                                                        from end Q2 2019

                                                                                                                            4|
Key Financials Q4 2018
                    Balance Sheet Key Numbers                                         Movements from Q3 2018

USDm                                   Q4 2018 Q3 2018 Q4 2017
                                                                  ▪ Total assets increased by US$123.2 primarily due to
                                                                     - delivery of the newbuilding “Natt”,
Total assets
                                        2,913.7 2,790.5 1,672.3      - capital expenditures from the activation of the “Gerd” and
Total liabilities                                                      “Groa” and the reactivation of “Odin” and “Ran”.
                                        1,380.2 1,138.5   179.4
Total equity
                                        1,533.5 1,652.0 1,492.9   ▪ Total liabilities increased by US$241.7 million, mainly
Cash and cash equivalents                                           attributable to
                                         27.9    40.6     164.0
                                                                     - US$87.0 million in long-term debt related to the delivery
Restricted cash                                                        financing for the newbuilding “Natt”,
                                         63.4    21.2     39.1
                                                                     - US$100.0 million drawdown on the revolving credit facility
                                                                       with DNB
                                                                     - US$ 35.1 million liability related to unrealised loss on
                                                                       forward contracts
                                                                     - increase in accrued expenses and other current liabilities.

                                                                  ▪ Total available free liquidity at the end of the fourth quarter was
                                                                    US$97.9 million, incl. undrawn amounts under the revolving
                                                                    credit facility of US$70 million. This compares to US$210.6
                                                                    million in Q3 2018.

                                                                                                                  5|
Fleet Status Report February 2019
                                                                      Fleet Summary

                                                          Operating /                                              Under
                                                                             Available      Cold Stack
                                                          Committed                                              Construction
            Premium Jack-Ups               29                    9              10                2                    8
            Standard Jack-Ups               6                    4                                2
                Total Jack-Ups             35
            Semi - Submersible              1                    1
                     Total Fleet           36                    14             10                4                    8

                  Contractual Developments                                                            Other Fleet Updates
o Gerd:     Firm contract for 2yr program starting in March 19                o Gerd:    Activation completed successfully and rig undergoing
o Groa:     Firm contract for 2yr program starting in April 19                           preparations to commence contract

o Natt:     Firm contract for 2yr program starting in March 19
                                                                              o Natt:    Activation completed successfully and rig in transit to Nigeria
o Mist:     Firm contract for ~4 months starting in Nov 18
o Norve:    Firm contract for ~11 months program starting in late June 19
                                                                              o Odin:    Activation completed successfully and in transit to Mexico
o C20051:   Exercised 2 optional wells (~60 days)
o MSS1:     Secured ~60 days extension                                        o Njord:   Took delivery from yard
o P5:       Secured LOI for ~180 days program starting in April 19
o Frigg:    Secured 10 months extension
o Odin:     Firm contract for ~9 months program starting in March 19

                                                                                                                                 6|
Fleet Update
                                                                                 Contracted and Future Contracted Rigs (14)

                                                                                 2018                                                     2019                                                  2020                                2021
       Rig Name                 Location
                                                            Q1           Q2             Q3             Q4           Q1               Q2          Q3           Q4             Q1            Q2          Q3   Q4   Q1           Q2            Q3         Q4

                                                                                                                    Premium Jack-Ups

          Odin              In Transit / Mexico                                                             Mobilization PanAmerican
                 1
         Frigg                    Nigeria             Total                                                     Total         Shell (via Assignment)          Option

      Prospector 1 1           Netherlands                                                                  Tulip

      Prospector 5 1   United Kingdom / Netherlands                                     Nexen                                 LOI - Undisclosed
                                                      Un
          Gerd                    Nigeria                                                    Mobilization                 Exxon                                                                                       2 x 1 Year Optional Period
                                                      der
          Groa              Singapore / Nigeria                                              Activation & Mobilization        Exxon                                                                                       2 x 1 Year Optional Period
                 1
          Ran          Netherlands / United Kingdom                                          Activation & Mobilization        Spirit Energy

          Norve             Gabon / Cameron           BW Energy Dussafu                      Perenco                                 Available BW  Energy
                                                                                                                                               - Warm      Dussafu
                                                                                                                                                      Stacked

          Natt              In Transit / Nigeria                                                 Mobilization             First E&P                                                                                   1 Year Optional Period

                                                                                                                    Standard Jack-Ups

         C20051                Netherlands                           Perenco                 Total

         Dhabi II         United Arab Emirates        NDC (ADOC)

          B152            United Arab Emirates        NDC (ADOC)

           B391              United Kingdom                      Spirit Energy                                                                                           Up to 13 option wells (425 days)

                                                                                                                         Semi-Submersible

          MSS1               United Kingdom                      TAQA                                                                                                Up to 5 option wells (375 days)

                                                                  Contract                                                  Option                                                 Available                           Under Construction

1   HD/HE Capability

                                                                                                                                                                                                                        7|
Fleet Update continued
                                                          Available (10), Under Construction (8) and Cold Stacked (4)
                                                                             2018                                             2019                               2020                               2021
          Rig Name                Location
                                                           Q1           Q2            Q3   Q4            Q1              Q2          Q3   Q4   Q1           Q2          Q3   Q4   Q1          Q2            Q3   Q4

                                                                                                         Premium Jack-Ups

             Galar                Singapore            Available - Warm Stacked

           Gersemi                Singapore            Available - Warm Stacked

             Grid                 Singapore            Available - Warm Stacked

           Gunnlod                Singapore            Available - Warm Stacked

            Gyme                  Singapore            Available - Warm Stacked

             Idun                 Singapore            Available - Warm Stacked

             Saga                 Singapore            Available - Warm Stacked

             Skald                Singapore            Available - Warm Stacked

             Njord                Singapore            Available - Warm Stacked

             Mist                 Singapore                                                Kris Energy        Available - Warm Stacked

                                                                                                 Jack-Ups Under Construction

             Hild          KFELS shipyard, Singapore   Rig Delivery in October - 2019

           Heimdal         KFELS shipyard, Singapore   Rig Delivery in January - 2020

            Hermod         KFELS shipyard, Singapore   Rig Delivery in April - 2020

            Huldra         KFELS shipyard, Singapore   Rig Delivery in July - 2020

             Tivar         KFELS shipyard, Singapore   Rig Delivery in July - 2020

           Heidrun         KFELS shipyard, Singapore   Rig Delivery in October - 2020

             Vale          KFELS shipyard, Singapore   Rig Delivery in October - 2020

              Var          KFELS shipyard, Singapore   Rig Delivery in December - 2020

                                                                                                    Cold Stacked Jack-Ups

             Atla            United Arab Emirates

            Balder                 Cameron
                       1
            Baug                United Kingdom         Not Marketed
                   1
             Eir                United Kingdom         Not Marketed

                                                                 Contract                                       Option                              Available                          Under Construction

1   HD/HE Capability

                                                                                                                                                                                         8|
Market Update
                                                                                                                         Shorter fall and stronger rebound
                                 Marketed Utilisation continues to trend upwards…                                                 for modern rigs

                                                                                                                                    Modern        Standard

                                                                                                               82%
                                                                                                         81%
    80%

                                                                                                               79%

                                                                                                         78%
                                                                                                                      Marketed
                                                                                                                     Utilization     82%           73%
    75%

                                                                                                               73%                    +3
                                                                                                                         Q-o-Q                       -1
                                                                                                                                      p.p.          p.p.

                                                                                                         71%
                                                                                                                          Y-o-Y
                                                                                                                                      +9            +2
    70%
                                                                                                                                      p.p.          p.p.

                                                                                                                            From     +13            +6
                                                                                                                          trough      p.p.          p.p.

    65%
          Dec 2017                    Mar 2018           Jun 2018            Sep 2018              Dec 2018

                                                 Total              Modern              Standard

                                      …and utilisation even higher for rigs built after 2010

Source: IHS Petrodata
Modern rigs = built between 2000 or after
Includes Independent Leg Cantilever units only
                                                                                                                                         9|
Why modern assets?
                                        Large part of the fleet is old - Old rigs are not qualified for key tenders
70
                                                                                                                                                    Able to tender for Mexico

60
                                                                                                                                                         Able to tender for Qatar

50

40

30

20

10

-
                                                      1981

                                                                                                              2000

                                                                                                                                                                        2019
     1963
     1964
            1965
            1966
                   1967
                   1968
                   1969
                          1970
                          1971
                                 1972
                                 1973
                                        1974
                                        1975
                                        1976
                                               1977
                                               1978
                                                      1979
                                                      1980

                                                             1982
                                                             1983
                                                                    1984
                                                                    1985
                                                                           1986
                                                                           1987
                                                                           1988
                                                                                  1989
                                                                                  1990
                                                                                         1991
                                                                                         1992
                                                                                                1993
                                                                                                1994
                                                                                                1995
                                                                                                       1996
                                                                                                       1997
                                                                                                              1998
                                                                                                              1999

                                                                                                                     2001
                                                                                                                     2002
                                                                                                                            2003
                                                                                                                            2004
                                                                                                                                   2005
                                                                                                                                   2006
                                                                                                                                   2007
                                                                                                                                          2008
                                                                                                                                          2009
                                                                                                                                                 2010
                                                                                                                                                 2011
                                                                                                                                                        2012
                                                                                                                                                        2013
                                                                                                                                                        2014
                                                                                                                                                                 2015
                                                                                                                                                                 2016
                                                                                                                                                                        2017
                                                                                                                                                                        2018

                                                                                                                                                                                    2020
                                                                             Delivered     Newbuilds

                                               “Modern rigs are 15-25% more efficient
                                                        than standard rigs”                                                                             10 |
Marketed Utilization and Fleet Size in key jack-up markets

                                                                            NW Europe
                                                                           Modern    Std
                                                                            (97%)   (86%)

                                                                            30       7

                                                    Mexico
                                                 Modern    Std
                                                  (60%)   (22%)                             ME and India
                                                                                            Modern    Std    Asia Pacific
                                                                                             (89%)   (77%)
                                                                                                             Modern    Std
                                                  32       9                                                  (75%)   (76%)
    Global Utilization                                             W Africa
                                                                  Modern    Std              96      97
 Modern (82%)              Std (73%)                              (100%)   (75%)                              76      17
                                                                   10        8

      269                    160

                Mkt Rig Count

Source: IHS Petrodata
Modern rigs = built between 2000 or after
Includes Independent Leg Cantilever units only
                                                                                                              11 |
Offshore spending is recovering
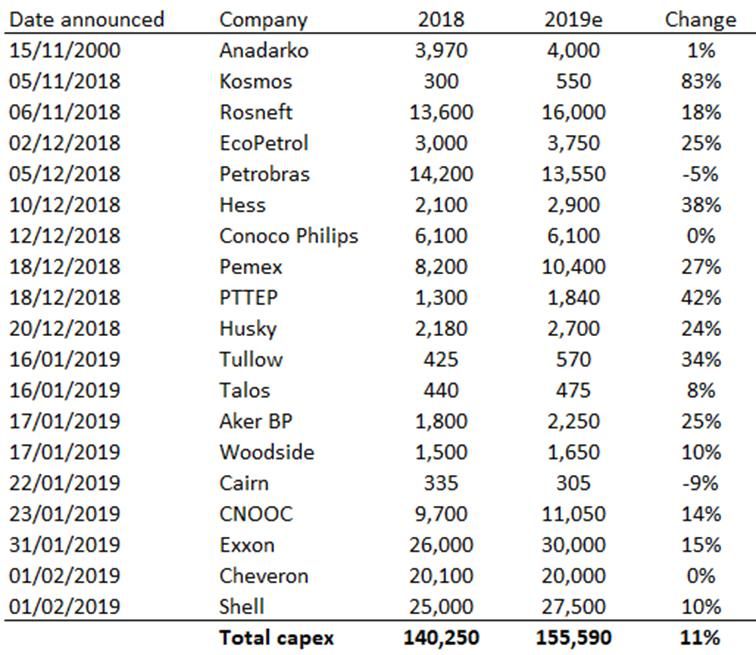
                       Capex increases have started                                                           Oil Companies under estimate capex growth

                                                                                              30
                                                                                                          E&P co own estimate (% y/y)         Actual spending growth (% y/y)

                                                                                              25

                                                                                              20

                                                                                              15

                                                                                              10

                                                                                              5

                                                                                              0
                                                                                                            2004                          2005                          2006

 “In the international markets… this means that after four years of underinvestment and            “There is a tremendous amount of growth required in a depletion business just to stand
focus on maximizing short-term cash flow, the NOCs and independents are starting to see                                                  still”
the need to invest in their resource base simply to maintain production at current levels.”
                      Schlumberger CEO, Paal Kibsgaard at Q4 report                                                 Exxon CEO, Darren Woods in Economist Feb 2019

                                                                                                                                                             12 |
Tender activity is normalising and day rates are moving
                                        Jack up tenders at highs                                                                              Day-rate improving
# jack-up tenders                                                                                       Dayrate USDk/day

 95                                                                                                                                                           Jan 18 – Dayrates USD50k – share price NOK35
                                                                                                                                                              Jan 19 – Dayrates USD100k – share price NOK23
                                                                                                          275

 85

                                                                                                          225
 75

 65                                                                                                       175

 55
                                                                                                          125

 45

                                                                                                           75
 35

 25                                                                                                        25

                                                                                                                                              06/2006
       01/2010

                   01/2011

                              01/2012

                                            01/2013

                                                      01/2014

                                                                01/2015

                                                                          01/2016

                                                                                    01/2017

                                                                                              01/2018

                                                                                                                06/2000

                                                                                                                          06/2002

                                                                                                                                    06/2004

                                                                                                                                                        06/2008

                                                                                                                                                                     06/2010

                                                                                                                                                                               06/2012

                                                                                                                                                                                                06/2014

                                                                                                                                                                                                          06/2016

                                                                                                                                                                                                                    06/2018
Soruce: Fearnley, Borr Drilling

                                                                                                                                                                                         13 |
Market can be “sold out” in 2019
                                   Incremental demand in 2019 set to outstrip available rigs
# jack-up rigs
50

45

40
                                                                                               Thailand

                                                                                            Other GCC
35

30                           2010
10

  5                                                                                             Qatar

  0
                        Supply premium rigs                                             Incremental demand

Source: Borr Drilling

                                                                                                             14 |
Conclusion

        Jack-up dayrates gone from USD60k/day to >USD100k/day last year

             New bank financing secured – received term sheet for long-term
                                       solution

             Borr Drilling will based on current contracts be cash-flow positive
                                       from end of Q2

                             Contracting environment positive

                                                                               15 |
Q&A

      |
You can also read