INVESTING IN LIFE'S ENDURING EXPERIENCES - INVESTOR PRESENTATION | MAY 2018 DATA IN THIS PRESENTATION IS AS OF 3/31/18 UNLESS OTHERWISE NOTED ...
←
→
Page content transcription
If your browser does not render page correctly, please read the page content below

INVESTING IN LIFE’S
ENDURING EXPERIENCES

INVESTOR PRESENTATION | MAY 2018

DATA IN THIS PRESENTATION IS AS OF 3/31/18 UNLESS OTHERWISE NOTED
DISCLAIMER

Statements made in this presentation may constitute "forward-looking statements" within the meaning of
Section 27A of the Securities Act of 1933, as amended, and Section 21E of the Securities Exchange Act of
1934, as amended. Such forward-looking statements relate to, without limitation, the Company’s future
economic performance, plans and objectives for future operations and projections of revenue and other
financial items. Forward-looking statements can be identified by the use of words such as "may," "will,"
"plan," "should," "expect,” "anticipate," "estimate," "continue" or comparable terminology. Forward-
looking statements are inherently subject to risks and uncertainties, many of which the Company cannot
predict with accuracy and some of which the Company might not even anticipate. Although we believe that
the expectations reflected in such forward-looking statements are based upon reasonable assumptions at
the time made, we can give no assurance that such expectations will be achieved. Future events and actual
results, financial and otherwise, may differ materially from the results discussed in the forward-looking
statements. Readers are cautioned not to place undue reliance on these forward-looking statements and
are advised to consider the factors listed under the headings "Risk Factors" in the Company’s Annual
Report on Form 10-K, as may be supplemented or amended by the Company’s Quarterly Reports on Form
10-Q and Current Reports on Form 8-K. The Company assumes no obligation to update and supplement
forward-looking statements that become untrue because of subsequent events, new information or
otherwise.

Definitions and reconciliations of the non-GAAP financial measures used in this presentation are available in
our investor supplemental dated March 31, 2018 available on our website at www.eprkc.com.

2

COMPANY OVERVIEW

EPR PROPERTIES

  COMPANY SNAPSHOT*                             PRIMARY INVESTMENTS SEGMENTS
      NYSE: EPR, FOUNDED: 1997
      $7.6B Total Market Cap
      $4.5B Equity, $3.1B Debt
      $6.8B+ Total Investments
      400 Properties, 43 States, DC & Canada            ENTERTAINMENT

  LONG-TERM OUTPERFORMANCE**
  LIFETIME TOTAL SHAREHOLDER RETURN
                                                         RECREATION

                                                          EDUCATION

*As of March 31, 2018
**Source: SNL, dates 11/18/97 through 3/31/18

4
INVESTMENT THESIS

         EPR is a triple net REIT, specializing in select highly enduring
                              real estate segments

    DIFFERENTIATED INVESTMENTS
    EXPERIENTIAL ORIENTATION

    STRONG RELATIONSHIP-BASED
    GROWTH PIPELINE

    UNDERLYING INVESTMENT
    SEGMENT STRENGTH

    WELL-CAPITALIZED
    BALANCE SHEET

    CONSISTENTLY GROWING
    DIVIDEND

5
GROWTH STRATEGY

       ESTABLISH                   EXPAND                        OPTIMIZE
    PRIMARY SEGMENTS            SUB SEGMENTS                ASSET MANAGEMENT

     Build Significant Growth   Continue to Explore          Maximize the Long-Term
             Platforms          Potential Extensions             Portfolio Value

                                     THEATRES
                                                       Reporting (Assessment)
                                        ERCs
                                                         • Continuous property
     ENTERTAINMENT                      FECs               tracking
                                                         • Segment and Sub
                                                           Segment views
                                      GOLF EC
                                                         • Corporate review
                                         SKI

        RECREATION                                     Dispositions
                                   ATTRACTIONS
                                                          • De-risk when necessary
                                OTHER RECREATION          • Opportunistic recycling
                                                            of capital

                                 CHARTER SCHOOLS
         EDUCATION                                     Property Improvements
                                 PRIVATE SCHOOLS          • Enhancing customer
                                 EARLY CHILDHOOD
                                                            experience

6
EXPERIENTIAL ORIENTATION

    MILLENNIALS                                 ARTS, ENTERTAINMENT AND RECREATION INDUSTRY
                                                           CONTRIBUTION TO US GDP

    75.4M                          $1.4
                                                                 Total Industry Output (IN TRILLIONS)
                                                                 As a percent of Total US GDP Output           4.1%
    people aged 18-34                                                                                          4.0%

                                    $1.2                                                                       3.9%

    LARGEST                        $1.0
                                                                                                               3.8%

                                                                                                               3.7%
    population segment
                                                                                                               3.6%

                                   $0.8                                                                        3.5%
    they value                                 2010              2011      2012       2013       2014   2015
                            Source: US Bureau of Economic Analysis (BEA)

    EXPERIENCE
    over                   “We are on the threshold… of the EXPERIENCE ECONOMY, a new
    OWNERSHIP               economic era in which businesses must orchestrate memorable
Source: US Census Bureau    events for their customers.” - The Experience Economy

TECHNOLOGY: Continues to enable new and distinctive experiences

7
PORTFOLIO

PORTFOLIO VALUE

     $6.8B+ PORTFOLIO
     Generating $595M* in NOI
       400 locations with over 250 tenants in 43 states, DC & Canada
                                                                                                      BY INVESTMENT VALUE

                                                                                                                33%
                                                                                                           RECREATION
                                                                                                                                    21%
                                                                                                                                   EDUCATION

                                                                                                                                      3%
                                                                                                                43%                  OTHER
                                                                                                           ENTERTAINMENT

    *Represents annualized GAAP NOI – see supplemental for definition and reconciliations of certain Non-GAAP financial measures

9
CUSTOMER RENT COVERAGE

                                                             TOTAL 1.74x

             ENTERTAINMENT                                     RECREATION                                     EDUCATION

                      1.62x*                                       2.08x**                                          1.51x***

 METHODOLOGY
 Coverage numerator is customer's store level EBITDAR and denominator is EPR's minimum rent
 or interest (excludes non-cash straight-line rent or interest income from the effective interest
 method of accounting)
 EBITDARM data is sourced from customers' reported store level profit and loss statements
 * Coverage is weighted average for the segment. Theatres and Family Entertainment Centers data is TTM December 2017.
 ** Coverage is weighted average for the segment. Golf Entertainment Complexes and Other Recreation data is TTM December 2017. Ski Area data is
     TTM April 2017 and Attractions data is TTM August 30, 2017.
 *** Coverage is weighted average for the segment. Public Charter School data is TTM June 2017, Private school data is TTM June 2017 and Early
     Childhood Education data is TTM December 2017.

10
PORTFOLIO DETAIL
PROPERTY TYPE PROPERTIES NOI* % of TOTALS % LEASED
(In Millions)
Megaplex Theatres** 149 225.1 37.8% 100.0%
Entertainment Retail Centers (ERCs) 7 40.2 6.8% 95.7%
Family Entertainment Centers (FECs) 11 13.4 2.3% 100.0%
TOTAL ENTERTAINMENT 167 278.7 46.9% 99.3%
Golf Entertainment Complexes 31 62.5 10.5% 100.0%
Ski Areas 25 58.2 9.8% 100.0%
Attractions 20 66.5 11.2% 100.0%
Other Recreation 10 7.9 1.3% 100.0%
TOTAL RECREATION 86 195.1 32.8% 100.0%
Public Charter Schools 65 69.2 11.6% 96.4%
Private Schools 14 28.7 4.8% 100.0%
Early Childhood Education Centers 67 15.8 2.7% 100.0%
TOTAL EDUCATION 146 113.7 19.1% 97.8%
Resorts World Catskills 1 7.5 1.3% N/A
TOTAL OTHER 1 7.5 1.3% N/A
TOTAL 400 $595.0 100% 99.1%
*Represents annualized GAAP NOI – see supplemental for definition and reconciliations of certain Non-GAAP financial measures
**Excludes 7 theatres in ERC’s
11STRONG PORTFOLIO CHARACTERISTICS
FOCUSED GROWTH DISTINCTIVE LEASE FEATURES
TOTAL INVESTMENTS*
(IN BILLIONS)
OTHER
RECREATION $6.7 $6.8
EDUCATION
$5.3
ENTERTAINMENT $4.6
$4.0
$3.6
$2.8 $3.1 $3.0 $3.2
$2.3 $2.7
2007 2008 2009 2010 2011 2012 2013 2014 2015 2016 2017 2018
REDUCED TENANT CONCENTRATION LOW 10-YEAR LEASE EXPIRATIONS**
AVG 2.2% ANNUAL TOTAL REVENUE
TOP 5=
80% 64%
TOP 5=
Entertainment Education Recreation
% of Total Revenue
60% 5% 48%
7% 5% 10%
9% 7% 5% 6% 8%
8% 8% 6% 4% 4%
40% 9% 9% 8% 7% 9% 10%
9% 7% 9%
8% 10% 9% 6% 6%
7% 5% 4% 9% 9%
20% 34% 29% 25% 23% 23%
20% 20% 19%
0% 0%
2018 2019 2020 2021 2022 2023 2024 2025 2026 2027
2011 2012 2013 2014 2015 2016 2017 Q1 2018
* Total Investments is a Non-GAAP financial measure. See investor supplemental for quarter ended March 31, 2018 or Form 10-K’s as applicable for reconciliation of certain
Non-GAAP financial measures
** This schedule relates to owned megaplex theatres, public charter schools, early childhood education centers, private schools, ski areas and golf entertainment complexes only
12ENTERTAINMENT
EPR PORTFOLIO DETAIL
$3.0B 167 3** 23*** 1.62x
INVESTED PROPERTIES PROPERTIES OPERATORS RENT
IN SERVICE UNDER COVERAGE
DEVELOPMENT
UPDATES
YTD Box office revenue is up 5.5%*
High amenity theatres growing in popularity and demonstrating success
3 largest public theatre operators reported year over year F&B revenue per cap
growth from 5% to 9% last year
Megaplex Theatres Entertainment Retail Centers Family Entertainment Centers
*Source: Box Office Mojo, **Properties not yet in service , ***Does not include operators at ERCs
13149 PROPERTIES IN SERVICE
MEGAPLEX THEATRES 2 UNDER DEVELOPMENT
HISTORICALLY DURABLE CATEGORY TRANSFORMING THE CUSTOMER EXPERIENCE
EPR’S HIGHLY PRODUCTIVE THEATRES* LONG TERM STABILITY
ANNUAL U.S. BOX OFFICE REVENUE**
(In billions)
EPR EPR
3% vs. 7%
TOTAL TOTAL
U.S./CANADA U.S./CANADA
MARKET SHARE REVENUE
EPR’S STABLE RENT COVERAGE*** THE NEW CUSTOMER EXPERIENCE
Annual Box Office fluctuation has historically had
minimal impact on rent coverage +40% AVERAGE INCREASES
IN TOTAL REVENUE****
$12,000 2.0X NEW LUXURY NEW FOOD & BEVERAGE
SEATING CONCEPTS
$8,000 1.0X
$4,000 0.0X
2007 2009 2011 2013 2015 2017
Box Office Rent Coverage
(in millions)
* Source: Rentrak Report TTM 9/30/17, ** Source: Box Office Mojo
*** Source: Box Office Mojo & Tenant Financials, **** Renovated Theatres in EPR portfolio open a full year
1411 PROPERTIES IN SERVICE
FAMILY ENTERTAINMENT CENTERS 1 UNDER DEVELOPMENT
ONE LOCATION
A VARIETY OF ENTERTAINMENT OPTIONS
Upscale venues work well for corporate and consumer events
15RECREATION
EPR PORTFOLIO DETAIL
$2.2B 86 4* 21 2.08x
INVESTED PROPERTIES PROPERTIES OPERATORS RENT
IN SERVICE UNDER COVERAGE
DEVELOPMENT
UPDATES
Received substantial paydown on $249M ski property mortgage loan to
Och –Ziff Real Estate including prepayment fee
Through March, ski visits were up 9% and revenue was up 12% versus the trailing
three-year average
Golf Ent. Complexes Ski Attractions Other Recreation
*Properties not yet in service
1631 PROPERTIES IN SERVICE
GOLF ENTERTAINMENT COMPLEXES 3 UNDER DEVELOPMENT
GOLF ENTERTAINMENT COMPLEXES REVOLUTIONIZE
RECREATIONAL ACTIVITY
Topgolf’s 2017 attendance grew over 20%* to 13M* guests
*Source: Topgolf
17SKI AREAS 25 PROPERTIES IN SERVICE
LEADING REGIONAL SKI AND RESORT DESTINATIONS
GEOGRAPHIC SNOWMAKING FOUR SEASON
DIVERSITY CAPABILITIES APPEAL
1820 PROPERTIES IN SERVICE
ATTRACTIONS 1 UNDER DEVELOPMENT
PROVEN AND DURABLE RECREATION ACTIVITY
Demonstrating a consistent track record of attendance and revenue, the attractions
industry is an enduring component of the American lifestyle
19OTHER RECREATION 10 PROPERTIES IN SERVICE ACTIVE EXPERIENCES CONSISTENT WITH CONSUMER TRENDS Increased focus on fitness and wellness, along with participation in new generation activities 20
EDUCATION

     EPR PORTFOLIO DETAIL

      $1.4B                       146              8*             59               1.51x
         INVESTED                PROPERTIES    PROPERTIES       OPERATORS            RENT
                                 IN SERVICE      UNDER                             COVERAGE
                                              DEVELOPMENT

 UPDATES

       Entered into short-term agreement with Children’s Learning Adventure (CLA), which
       includes rent payments scheduled from March through July, leases terminate July 31
       Allows CLA and their prospective partners ample time to execute a restructuring

       Public Charter Schools                 Private Schools           Early Childhood Education

*Properties not yet in service

21
65 PROPERTIES IN SERVICE
PUBLIC CHARTER SCHOOLS *
3 UNDER DEVELOPMENT
DRIVEN BY PARENTAL DEMAND FOR CHOICE;
OVER 20 YEARS OLD AND GROWING STRONG
Started in 1992
Currently adopted in 44 states and D.C.
3.2M students growing at ~12% CAGR
7,000 schools growing at ~7% CAGR
Waiting list of over 1M students
*Source: NAPCS
22PUBLIC CHARTER SCHOOLS 23
PRIVATE SCHOOLS *                                                   14 PROPERTIES IN SERVICE

LIMITED QUALITY PRIVATE OPTIONS FUEL DEMAND

     In select markets, quality public and private school
     options are limited
     Non-sectarian private schools in the >$15K tuition
     level have seen double-digit growth since 2008
     Proven operators are capitalizing on the opportunity
     by meeting the needs in gateway cities

                                                     PARENTS SEEK PRIVATE SCHOOLS
                                                     THAT OFFER
                                                       Academic Rigor
                                                       Strong Culture
                                                       Relative Affordability

 *Source: National Center for Education Statistics

24
PRIVATE SCHOOLS 25
67 PROPERTIES IN SERVICE
EARLY CHILDHOOD EDUCATION 5 UNDER DEVELOPMENT
DEMAND FOR EDUCATION BEYOND DAYCARE
Large number of dual income families
Increasing per capita disposable income/stabilizing
unemployment rate
Desire for quality education instead of daycare
According to the U.S. Census
Bureau, there are TRADITIONAL DAYCARE = PHYSICAL NEEDS
VS.
15.1M CHILDREN
EARLY
under the age of six that require PHYSICAL ACADEMIC
CHILDHOOD = +
Childcare NEEDS DEVELOPMENT
EDUCATION
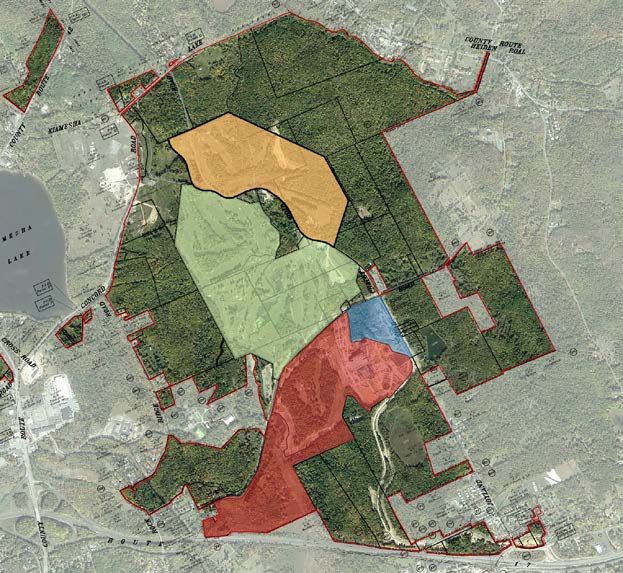
26RESORTS WORLD CATSKILLS SUMMARY
Property Map
Kartrite Hotel &
Indoor Waterpark EPR is the land lessor on the casino/hotel and two
adjoining parcels
The Monster
Golf Course • Resorts World Casino and Hotel opened Feb 2018
Ent.
Village • Empire Resorts also funding improvements to the
Resorts
World golf course and retail village
Casino &
Hotel The Kartrite Hotel & Indoor Waterpark currently
under development, with projected opening in
early 2019
27FINANCIAL REVIEW
FINANCIAL STRATEGY

MAINTAIN INVESTMENT GRADE DISCIPLINE

• LOW LEVERAGE – Committed to low leverage of 4.6x-5.6x
  (Net Debt to Adjusted EBITDA)
• UNSECURED MODEL – Emphasis is on common equity and
  unsecured debt
     o DSPP available for short-term equity needs
     o Have refinanced secured debt maturities with unsecured debt
• FLEXIBILITY – Preserve financial flexibility and liquidity

 INVESTMENT GRADE CREDIT RATINGS

                               S&P         MOODY’S         FITCH

      Senior Notes             BBB-        Baa2            BBB-

29
CAPITAL STRUCTURE AND FINANCIAL HIGHLIGHTS*
CAPITAL STRUCTURE FINANCIAL HIGHLIGHTS
(In Millions)
Total Market Cap = $7.6B
COMMON $2.5B is fixed rate or fixed
EQUITY, $4,117
through interest rate swaps,
SECURED DEBT, wtd. avg. = 4.6%
$25
1% 54%
Unsecured Debt = 99%
Redeemed $250M of 7.75% Senior
40% Unsecured Notes due in 2020
UNSECURED - No debt maturities until 2022
DEBT, $3,106
5%
PREFERRED
EQUITY, $371 On April 16, 2018, issued $400M of
10-year senior unsecured notes at a
coupon of 4.95%
• As of March 31, 2018. See investor supplemental for quarter ended March 31, 2018 for reconciliation of certain Non-GAAP financial measures
30WELL LADDERED DEBT MATURITY PROFILE*
$600 $570**
$500
$450 $450
$400
$400
$350
$300
$300 $275
$192
$200
$148
$100
$25
$0
Secured Debt Unsecured Credit Facility Unsecured Term Loan
Unsecured Senior Notes Private Placement
* Data in millions as of 3/31/18
** Subsequent to quarter-end, the unsecured credit facility balance was reduced to zero with proceeds from (i) the issuance of $400M of 10-year unsecured senior
notes on April 16, 2018 and (ii) the pay down of a mortgage note receivable of $221M, including prepayment fees, with Och-Ziff Real Estate on May 7, 2018.
31OPERATING PERFORMANCE HISTORY
CONSISTENTLY STRONG OPERATING METRICS
FFOAA TOTAL REVENUE
$400 $700
$350 $600
$300 $500
$250
$400
$200
$150 $300
$100 $200
$50 $100
$0 $0
2013 2014 2015 2016 2017 2013 2014 2015 2016 2017
FFOAA PER SHARE NET INCOME TO COMMON
SHAREHOLDERS
$250
$6.00
$5.00 $200
$4.00 $150
$3.00
$100
$2.00
$1.00 $50
$0.00 $0
2013 2014 2015 2016 2017 2013 2014 2015 2016 2017
(in millions, except per share data)
32ANNUAL DIVIDENDS
ATTRACTIVE & GROWING ANNUAL DIVIDENDS
* Projected for full year
33FINANCIAL PERFORMANCE
QUARTER ENDED MARCH 31,
2018 2017 $ CHANGE % CHANGE
Total Revenue $155.0 $129.1 $25.9 20%
Net Income – Common 23.5 48.0 (24.5) (51%)
FFO – Common* 61.0 73.9 (12.9) (17%)
FFO as adj. – Common* 94.0 76.5 17.5 23%
Net Income/share – Common 0.32 0.75 (0.43) (57%)
FFO/share – Common* 0.82 1.15 (0.33) (29%)
FFO/share – Common, as adj.* 1.26 1.19 0.07 6%
(In millions except per share data)
*See investor supplementals for the applicable periods for definitions and calculations of these non-GAAP measures.
34*
RECONCILIATION OF MIDPOINT OF FFOAA/SHARE GUIDANCE
FFO AS ADJUSTED PER SHARE
(previous guidance midpoint) $5.31
Prepayment fee from OZRE 0.61
Incremental dilution from convertible preferreds (0.03)
Net impact of OZRE prepayment fee 0.58
Lower term fees related to Education Properties (0.13)
Net increase in prepayment and termination fees 0.45
CLA payments, net of expenses 0.05
Increase in G&A expense (0.01)
Other changes, net 0.02
FFO AS ADJUSTED PER SHARE
(current guidance midpoint) $5.82
*See investor supplementals for the definition of this non-GAAP measure.
35KEY RATIOS*
QUARTER ENDED MARCH 31,
2018 2017 2016 2015 2014
Fixed charge coverage 3.2x 2.8x 3.3x 2.9x 2.8x
Debt service coverage 3.7x 3.1x 3.7x 3.1x 3.2x
Interest coverage 3.7x 3.3x 4.0x 3.6x 3.6x
Net debt to Adjusted EBITDA 5.8x 5.9x 4.8x 5.1x 4.8x
FFO as adjusted payout 86% 86% 82% 88% 91%
*See investor supplementals for the applicable periods for definitions and calculations for these non-GAAP measures
362018 GUIDANCE
FFO AS ADJUSTED PER SHARE
Revised $5.75 - $5.90
Prior Guidance $5.23 - $5.38
INVESTMENT SPENDING
$400M - $700M
DISPOSITION PROCEEDS
$350M - $450M
37APPENDIX
MEGAPLEX THEATRES *

          DRIVEN BY STRONG VALUE, THEATRES CONTINUE TO BE THE
          DOMINANT CHOICE IN ADMISSIONS-BASED ENTERTAINMENT

        ADMISSIONS-BASED ATTENDANCE                                                                   RELATIVE VALUE
                            2017 ATTENDANCE
                                  (IN MILLIONS)                                       2017 Average Ticket Price for a Family of Four (US$) Sources:
                                                                                             NATO, Sports Leagues, International Theme Park Services
1,400       1,240                                             NFL, 17.3
                                                              NHL, 21.5                        NFL                                                      $379.93
1,200
1,000                                                         NBA, 22.0                      NHL                                       $262.64
 800                                                                                Theme Parks                                     $243.20
 600                         414                                                             NBA                                   $228.33
 400                                                          MLB, 72.7
                                                   133                                       MLB                      $126.67
 200
                                                                                         Theatres         $35.88
   -
          Theatres       Theme Parks              Sports                                             $-        $100        $200        $300            $400

                                                           AVERAGE TICKET PRICE

                                      10 Year Average Ticket Price Average Annual Growth is 2.7%

                                                            2008 2009 2010     2011     2012    2013      2014     2015     2016     2017
                    Average Ticket Price                    $7.18 $7.50 $7.89 $7.93 $7.96 $8.13 $8.17 $8.43 $8.65 $8.97

                    % Change vs. Previous Year              4%    4%      5%   1%       0%      2%        0%       3%       3%       4%

                    CPI % Change vs. Previous Year          4%    0%      2%   3%       2%      2%        2%       0%       1%       2%

*Source: MPAA 2017 THEME Report

39
PUBLIC CHARTER SCHOOLS
CURRENT
FAMILY PROFILE SCHOOL PROFILE TARGET STATES
Parents who want an Strong organizational leadership
ARIZONA
alternative to and governance
traditional public COLORADO
schools Favorable market analysis of FLORIDA
enrollment and waiting list
CALIFORNIA
Highly engaged
High potential for expansion NEW JERSEY
NORTH CAROLINA
SOUTH CAROLINA
EPR POTENTIAL MARKET TENNESSEE
GEORGIA
COMPRISED OF NEW YORK
MARKET
OPPORTUNITY $5 - $25
$2.5 MILLION
BILLION
TRANSACTIONS
40PRIVATE SCHOOLS
FAMILY PROFILE OPERATOR PROFILE HIGH POTENTIAL
MARKETS
Mid to high affluence Nonsectarian schools
NEW YORK
Strong academic Branded school group with SAN FRANCISCO BAY
orientation history of success AREA
High parental Academically rigorous at LOS ANGELES
education achievement moderate price point CHICAGO
WASHINGTON D.C.
Select markets
HOUSTON
DALLAS
EPR POTENTIAL MARKET
SAN DIEGO
SEATTLE
COMPRISED OF
MARKET ATLANTA
OPPORTUNITY $20 - $50
$2 MILLION
BILLION
TRANSACTIONS
41EARLY CHILDHOOD EDUCATION
FAMILY PROFILE OPERATOR PROFILE MARKET PROFILE
Dual income Academic focus Suburban areas of major
MSAs
High income Multi-site operations
Target segment growth
Well-educated parents Superior real estate execution
Underserved trade areas
Children ages 0-5 (lack of competition)
EPR POTENTIAL MARKET
COMPRISED OF
MARKET
OPPORTUNITY $5 - $20
$1 MILLION
BILLION
TRANSACTIONS
42You can also read