Company presentation August 2016 - Prosafe
←
→
Page content transcription
If your browser does not render page correctly, please read the page content below
August 2016

Company presentation
Disclaimer
 All statements in this presentation other than statements of historical fact are
 forward-looking statements, which are subject to a number of risks, uncertainties,
 and assumptions that are difficult to predict and are based upon assumptions as
 to future events that may not prove accurate. Certain such forward-looking
 statements can be identified by the use of forward-looking terminology such as
 “believe”, “may”, “will”, “should”, “would be”, “expect” or “anticipate” or similar
 expressions, or the negative thereof, or other variations thereof, or comparable
 terminology, or by discussions of strategy, plans or intentions. Should one or
 more of these risks or uncertainties materialise, or should underlying
 assumptions prove incorrect, actual results may vary materially from those
 described in this presentation as anticipated, believed or expected. Prosafe does
 not intend, and does not assume any obligation to update any industry
 information or forward-looking statements set forth in this presentation to reflect
 subsequent events or circumstances.
Agenda
    Recent developments
    Restructuring
    Operations review
    Strategy & Outlook
    Summary

3
Recent developments
    Will secure runway through 2020 after comprehensive refinancing

    Will significantly improve debt structure and cash flow

    Will have limited covenants and significantly improved room to manoeuvre

    Re-organisation into a lean organisation
     • Safe and cost efficient management of fleet
     • 35-40% headcount reduction
     • 20-30% opex reduction and 40% capex reduction

    Amendment and contract extension signed with Petrobras – revenue flow through to mid 2020

    Safe Britannia, Safe Hibernia and Jasminia sold for scrap

    Good activity for Prosafe´s vessels in the North Sea in Q2/Q3

    Safe Zephyrus awarded Acknowledgement of Compliance from the Petroleum Safety Authority Norway
    and commenced contract

4
Agenda
    Recent developments
    Restructuring
    Operations review
    Strategy update
    Summary

5
Restructuring
    1. Restructuring goal
    2. Financial restructuring
    3. Operation cost/efficiency restructuring
    4. Supply side restructuring

6
1. Restructuring goal: re-establishing the Prosafe investment case

1       Premium asset base, purpose built for key markets

        Extensive fleet renewal program successfully completed,
2       further securing Prosafe’s “license to operate”

        Capable technical organisation with broad support
3       amongst clients – renewed focus on operational leadership

4       Long operational track-record from global operations

        Significantly improved debt structure, low cost of capital
5       and significantly improved cash flow

6       History of delivering strong ROCE

    7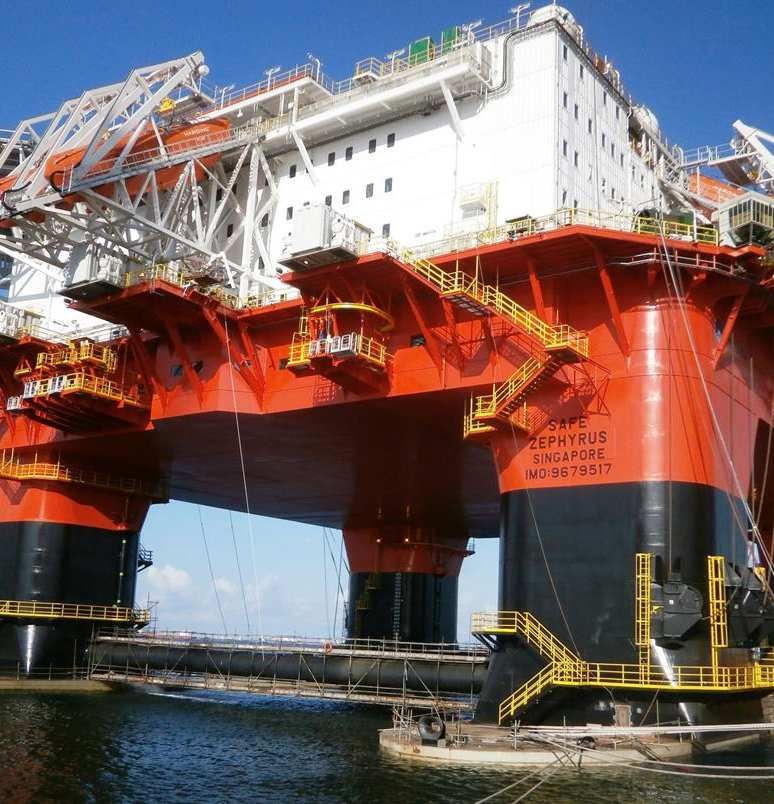
2.Financial restructuring: recapitalisation and net debt

    Improved cash flow 2017-2020 of
    approx. USD 1,023 million
     • Reduction of debt/new build investment USD
       530 million
     • Reduction of amortisation of USD 470 million
     • Interest saving from swap restructuring of
       approx. USD 23m

8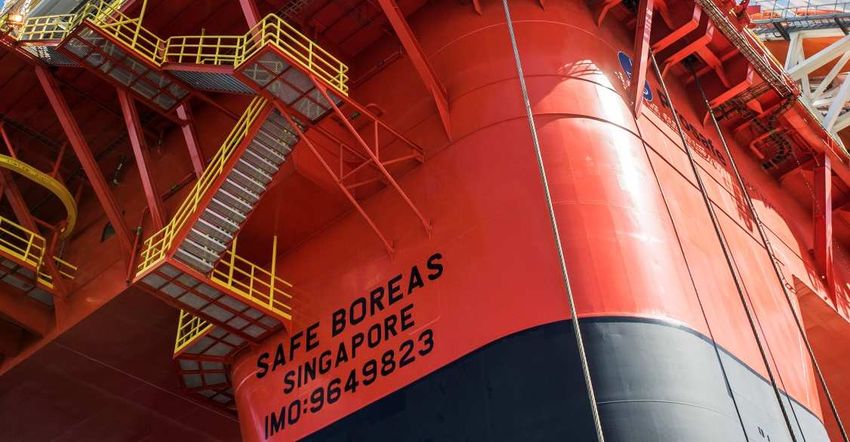
2. Financial restructuring : significantly improved debt profile
      Chart + table with
            Current      changes..
                    amortisation profile1                                                        Amortisation profile after recapitalisation1
USDm                                                                                        USDm
280                                                      2016-20: USD 968m                                                            2016-20: USD 205m
                                                                                        280
240
                                                                                        240

200
                                                                                        200

160
                                                                                        160
        Amortisation relief
           of USD 128m
120     (2 instalments on
       USD 1,300m facility)                                                             120
         already granted

80
                                                                                            80

40                                                                                          40

 0                                                                                          0
           2016               2017       2018           2019           2020                        2016         2017          2018   2019      2020
                                     USD 1,300m Credit facility       USD 288m Credit facility     Bond loans     Sellers credit

 9          Note 1) USD 30m outstanding on PRS07 (after repurchase) was repaid in Q1 2016
2. Financial restructuring: Pro-forma balance sheet per
Q2 post refinancing
                                               Reported            Adjusted
     (Unaudited figures in USD million)         30.06.16      Adj. 30.06.16

     Goodwill                                     226,7                226,7
     Vessels                                    1 559,0              1 559,0
     New builds                                   654,9                654,9
     Other non-current assets                       4,3                  4,3   • Reduced debt
     Total non-current assets                   2 444,9      0,0     2 444,9
     Cash and deposits
     Other current assets
                                                   68,2
                                                   86,6
                                                           105,3       173,5
                                                                        86,6
                                                                               • Improved liquidity
     Total current assets
     Total assets
                                                  154,8
                                                2 599,7
                                                           105,3
                                                           105,3
                                                                       260,1
                                                                     2 705,0
                                                                               • Solid business platform
     Share capital                                 72,1    (64,1)        8,0
     Other equity                                 606,4    455,1     1 061,5
     Total equity                                 678,5    391,0     1 069,5
     Interest-free long-term liabilities           98,4                 98,4
     Interest-bearing long-term debt            1 520,7    (137,7)   1 383,0
     Total long-term liabilities                1 619,1    (137,7)   1 481,4
     Other interest-free current liabilities      106,1                106,1
     Current portion of long-term debt            196,0    (148,0)      48,0
     Total current liabilities                    302,1    (148,0)     154,1
     Total equity and liabilities               2 599,7     105,3    2 705,0

10
2. Revised covenants - room to manoeuvre
Liquidity minimum MUSD 65million (from closing of transaction)
Interest coverage ratio
• Minimum 1.0 X (from closing of transaction until 31 Dec’ 2019)
• Minimum 1.5 X (from 1 Jan’ 2020 onwards)
Leverage ratio
• Suspended until 31 Dec’ 2020
Minimum market value
• Suspended until 31 Dec’ 2018
• Covenant set at 110% from 31 Dec’ 2019 onwards (in respect of 2 consecutive test dates)
• For the USD 288 million facility only, a step up in the market value covenant in March
2021 to 125%
Dividend restrictions
• No distributions until all bank lenders received repayments equal to all deferred
instalments
112. Refinancing status
Approvals
Cosco deal agreed/signed
4 Bonds approved
EGM approved the refinancing
Bank lenders representing 89 per cent of outstanding bank debt have approved or provided in principle
agreement for the refinancing
The Board has decided to conduct a repair issue of up to 504 million shares (USD 15 million) – only
shareholders at 12 July 2016, who did not participate in private placement, can subscribe
Timeline
Subject to timely receipt of final bank approvals, completion of refinancing, including payment and
delivery in private placement, expected to occur late August / early September
Immediate OTC listing of new class A shares issued as part of refinancing, pending publication of
prospectus, capital reduction and Oslo Børs listing
Prospectus expected to be published towards end of September 2016
Subscription period repair issue to start once prospectus is published (2 week subscription period)
123. Substantial cost/efficiency improvements - on target
Target of sustainable cost reductions (efficiencies) of
USD 30-40 million per annum
• Target to reduce headcount by 35-40 per cent by Q4
2016/Q1 2017
• Effects more visible from Q3 16 onwards, and full effect
on measures from Q1 2017 onwards
Improved underlying cost development in H1 2016
compared to H1 2015
• Non-recurring items of approx. USD 40 million H1 2016
• Off-hire and demobilisation costs for vessels in Mexico of
USD 37.5 million
• Restructuring cost of approx. USD 4 million
133. Cost Reduction – offshore
Now seeing cost per day (CPD) for vessels in operation being reduced by
20-25 per cent compared to 2014
Opex (CPD k/d) NCS UKCS Brazil
(figures in USD)
DP Moored DP
2014 75-80 50-55 60-65
2016e 60-65 40-45 45-50
Stacking CPD (k/d) High-spec Low-spec
(figures in USD) vessels1) vessels1)
15-30 5-10
1) Will depend on location and duration and cold/warm/hot stack
143. Cost reduction - onshore
Onshore costs in 2014 and 2015 average USD
40m p.a
• Overall onshore costs are trending down –
cost saving initiatives
• Slim lining of organisation – significant
headcount reductions
From 2017 onshore cost down by USD 10-12
million per annum (30%)
153. Lower Capex – return to maintenance
Strategic projects - new-builds and
major conversions all completed
Focus will return to maintenance capex /
5 year Special Periodic Survey
Short to medium term target of
maintenance/fleet capex of USD 20-30
million per annum
163. Cost and capex reduction summary
Target set in Q1 2016 : USD 30-40 million per annum in cost cuts / efficiencies
Full effects visible from Q1 2017 onward
2011-2015 annual Revised target levels Target savings 2017
average levels
Offshore opex1) USD 180m USD 140 – 150m USD 30-40m (20%)
Onshore opex USD 40m USD 28m USD 12m (30%)
Annual fleet capex2) USD 60m USD 20 - 30m USD 30-40m (40%)
Headcount reduction (in %) 35-40 percent
1) Will to some extent be affected by activity level
2) Excluding new-builds and conversions4. The Prosafe development: consolidation story
Taking the lead in consolidation, scrapping and restructuring
Taking
the lead
«Restructuring»:
«Consolidation»:
1. Renewal
1. Acq. of Discoverer ASA 2. Conversion to TSV
«Creation»: 2. Acq. of Safe Scandinavia 3. Scrapping
3. Acq. of MSV Regalia
Merger between Procon 4. Acq. of Polyconcord/SH
Offshore and Safe 5. Acq. of Consafe Offshore
Offshore
1997 1998-2006 2011-2016 2016/17 ->Agenda
Recent developments
Restructuring
Operations review
Strategy update
Summary
19Highly competitive vessels with increased earnings capacity
Safe Scandinavia 20y life Regalia Safe Boreas
State-of-the-art North extension
in 2014 and
20y life New build
extension delivered
Sea capable fleet TSV
conversion
in 2009 2015
2016
Fleet renewal program Safe Zephyrus Safe Caledonia Safe Bristolia
New build 20y life
completed with capex delivered extension
2016 in 2013
spend of approx. USD
1.35bn since 2012 Safe Notos Safe Eurus Safe Concordia
New build New build
Core fleet of 7 state-of- delivered delivered
2016 TBD
the-art North Sea capable
Safe Lancia Safe Regency Safe Astoria
vessels (including Eurus)
~80% of fleet value
capable of North Sea Safe Hibernia Safe Britannia Jasminia
operations; a high barrier
market
20Operations overview
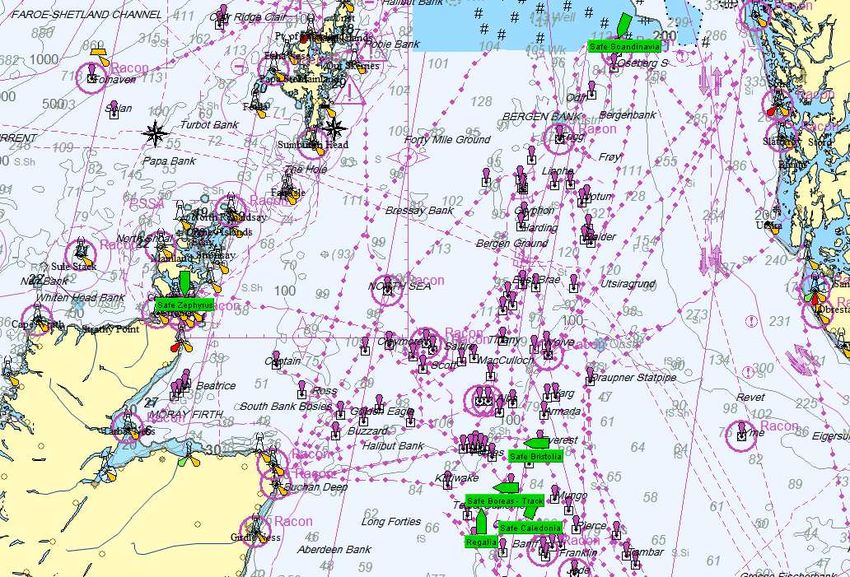
Geographic overview Key comments
In Operation:
Regalia, Shell, Brent Charlie, UKCS
Safe Boreas, Talisman, Montrose A, UKCS
Safe Concordia, Petrobras, P56, Brazil
Safe Scandinavia (TSV), Statoil, Oseberg Øst, NCS
Safe Zephyrus, Det Norske, Ivar Aasen, NCS
Safe Zephyrus
Mobilising:
Safe Notos; transit to Brazil
Lay – up / Construction:
Safe Caledonia, Scapa Flow
Safe Bristolia; lay-up, Norway
Safe Astoria; Cold stack, in Batam, Indonesia
Safe Lancia; Cold stack in Port Isobel, USA
Safe Regency; lay-up, Curaçao
Safe Britannia
Safe Eurus; Under construction COSCO, Qidong, China
Safe Lancia Safe Eurus
Safe Hibernia
Jasminia
Safe Regency Recycling/Scrap:
Safe Notos Safe Britannia/ Safe Hibernia / Jasminia
Safe Astoria
21Contract coverage 22
Orderbook – superior track record in North Sea awards
                                                                                              Prosafe has won 17 out of 23 new awards in the
     Status end Q2 16 (gross value)
       Firm contracts          USD         703
                                                                                              North Sea since 2012, demonstrating continous
     + Options (1)             USD         564                                                superior competitiveness in this key region
     = Total                   USD        1267
                                                                                              Diversified track record

                                                                                               -    6 awards on Norwegian Continental Shelf
                                                                                               -    11 awards on UK Continental Shelf
                                                                                               -    Wide range of installations

                                                                                              High standing with blue-chip customers:

                    Q2 2016: The amendment of the Petrobras contract (published press
                    release on 7 July 2016) is taken into account as of end Q2 2016 figures

23
Capital expenditure 2016
Agreed deferred delivery to 31 December 2019
for Safe Eurus – therefore reduced capex for
2016. In addition Prosafe can cancel.
Aggregate capital expenditure – adjusting for
Safe Eurus delivery - for 2016 is in line with
previous indications of approx. USD 500 million
Remaining capex for H2 2016 of approx. USD
30 million
Major capex items in 2016:
• Final delivery instalments on Safe Notos and
Safe Zephyrus delivered in Q1 2016
24Agenda
Recent developments
Restructuring
Operations review
Strategy update
Summary
25Back to normal: accommodation market demand drivers
Share of market 10-30% 60-80% 0-10%
Market visibility High Low Medium
Lead time Long Short Medium
Project sanctioning, Age of installed topsides, Shutdowns and
Key drivers
hookup and commissioning subsea tieback projects platform removal
26Activity level forecasted to recover from 2018
2014 – 16; “Hook-ups” 2016 – 20; “Back to normal”
Goliat
Returning to traditional demand (maintenance and modification)
with shorter lead times compared to hook-up projects
1 Continuous growth in installed base with significant number of new fields in
production during recent years
Clair Ridge
Martin Linge
Solan Mariner 2 Increasing share of platforms older than 20 years, triggering strong demand
Gina Krog
Edvard Grieg for maintenance work
Ivar Aasen
Golden Eagle 3 Platforms increasing lifetime beyond design life driving need for substantial
Montrose
modification work
4 Strong backlog of tieback projects triggering need for modification work at
host platforms
5 Significant drop in modification capex leading to large backlog of
outstanding maintenance projects building up in current down-turn
27 Source: Prosafe, Page 16, “Offshore Floating Accommodation Market Drivers”, Report to Prosafe by Rystad Energy, April 20, 2016.Geographical demand
Semi-submersible vessels have been deployed in a wide range of geographical locations, although primarily in highly regulated,
harsh and/or deep water environments such as UK North Sea and Norwegian Continental Shelf.
Prosafe has conducted 76 semi-submersible accommodation vessel projects of varying duration since 2000*:
Note: Contracts shown are either underway
or completed. Future contracts have not
been included
* Not including TSV, Jack-up and Well Intervention
28Increasing lifetime trigger need for modifications
History has shown that fields
Lifetime for selected fields in Norway
seldom cease operation at the end
of the designed field life
• But rather increase life time with 10-
25 years
Platforms increasing lifetime
beyond design life trigger need for
modifications – which again might
trigger the need for additional
Source: NPD Facts 2014, http://www.npd.no/en/Publications/Facts/Facts-2014/Background-data-for-some-of-the-
figures-in-Facts-2014/ accommodation capacity
29Indicative: global accommodation market anticipated to
rebalance by 2020
High fleet growth combined with weaker market – “low end” vessels at risk by 2020
Accommodation Competitive Competitive
vessels by owner fleet: fleet:
33
Axis
29 POSH
YiuLian
OOS 25
FOE
COSL
23 Pemex
Cotemar
20
17 17 Floatel
16
Prosafe
2010 2011 2012 2013 2014 2015 2016e 2020e
30 Source: Prosafe estimatesAgenda
Recent developments
Restructuring
Financial results
Operations review
Strategy update
Summary
31Summary
Will secure runway through 2020 after comprehensive
refinancing
Will significantly improve debt structure and cash flow
Will have limited covenants and significantly improved room
to manoeuvre
Re-organisation into a lean organisation
• Focus continues on safe and cost efficient management of fleet
Substantial cost and capex cuts
Market outlook remains uncertain near term – continue to
see 2017 to be low point; however expectations are for
gradual market recovery from 2018
32Appendix 33
Recapitalisation summary
                     • Equity capital raise of USD 130m
     Capital raise     • USD 40m to be used to buy-back part of the Company’s senior unsecured bonds
                     • The Board has decided to conduct a subsequent offering of up to USD 15m (repair issue)

                     • NOK 2.4 billion in aggregate face value of the Company's outstanding senior unsecured bonds in PRS08, PRS09, PRS10 and PRS11 are
                       converted into a mix of new convertible bond or ordinary shares at 30% of the face value and cash
     Restructuring     • The Company will issue (i) a convertible bond of NOK 82.79 million convertible into 331,163,764 new shares; (ii) 1,396,836,250 new shares
       of bonds          as consideration for the bond conversion
                       • The cash-out offer was USD 40m at 35% of face value

                     • Amortisation relief of USD 128m in 2017 and 2018 (90% reduction), USD 114m in 2019 (90% reduction in H1 and 70% reduction in H2), and
                       USD 100m in 2020 (70% reduction) – combined with swap restructuring provides total positive liquidity effect for the Company of approximately
                       USD 493m
        Bank           • USD 1.3 bn facility final maturity in February 2022
     amendments        • USD 288m facility final maturity May 2021 – extended availability of undrawn USD 144m Eurus tranche to Q4 2019. Reinstatement of
                         original amortisation profile on Eurus tranche of the USD 288 million facility
                     • Amended financial covenants for all facilities
                     • Revised margin and cash sweep mechanism to be included

                     • Secured additional flexibility with Cosco on taking delivery of Safe Eurus
                       • Deferred delivery of Safe Eurus to Q4 2019 (or such earlier time required by the Company)
       COSCO           • Limitation on any further liability in the event Prosafe does not take delivery of Safe Eurus
                       • Deferred maturity date of the USD 29m seller's credit agreement to Q4 2019

34
Income statement (Unaudited figures in USD million) Q2 16 Q1 16 Q2 15 6M 16 6M 15 2015 Operating revenues 115.4 103.0 92.5 218.4 216.7 474.7 Operating expenses (53.8) (57.7) (51.0) (111.5) (102.8) (211.8) EBITDA 61.6 45.3 41.5 106.9 113.9 262.9 Depreciation (29.1) (23.4) (18.7) (52.5) (35.7) (86.5) Impairment 0.0 0.0 0.0 0.0 0.0 (145.6) Operating profit 32.5 21.9 22.8 54.4 78.2 30.8 Interest income 0.1 0.0 0.1 0.1 0.1 0.2 Interest expenses (18.6) (19.9) (12.8) (38.5) (23.0) (41.6) Other financial items (7.9) (0.4) 5.7 (8.3) (10.2) (29.5) Net financial items (26.4) (20.3) (7.0) (46.7) (33.1) (70.9) Profit/(Loss) before taxes 6.1 1.6 15.8 7.7 45.1 (40.1) Taxes (0.9) (3.4) (3.6) (4.3) (5.9) (10.5) Net profit/(loss) 5.2 (1.8) 12.2 3.4 39.2 (50.6) EPS 0.02 (0.01) 0.05 0.01 0.17 (0.21) Diluted EPS 0.02 (0.01) 0.05 0.01 0.17 (0.21) 35
Balance sheet
     (Unaudited figures in USD million)        30.06.16   31.03.16   31.12.15   30.06.15

     Goodwill                                    226.7      226.7      226.7      226.7
     Vessels                                   1 559.0    1 581.6    1 578.6    1 611.5
     New builds                                  654.9      635.3      228.5      211.1
     Other non-current assets                      4.3        4.7        4.9        6.0
     Total non-current assets                  2 444.9    2 448.3    2 038.7    2 055.3
     Cash and deposits                            68.2       71.0       57.1       94.9
     Other current assets                         86.6      111.5       91.4       91.5
     Total current assets                        154.8      182.5      148.5      186.4
     Total assets                              2 599.7    2 630.8    2 187.2    2 241.7

     Share capital                                72.1       72.1       72.1       65.9
     Other equity                                606.4      610.4      643.1      694.7
     Total equity                                678.5      682.5      715.2      760.6
     Interest-free long-term liabilities          98.4       90.8       58.9       59.4
     Interest-bearing long-term debt           1 520.7    1 554.9    1 107.5    1 185.6
     Total long-term liabilities               1 619.1    1 645.7    1 166.4    1 245.0
     Other interest-free current liabilities     106.1      135.8      166.1      203.1
     Current portion of long-term debt           196.0      166.8      139.5       33.0
     Total current liabilities                   302.1      302.6      305.6      236.1
     Total equity and liabilities              2 599.7    2 630.8    2 187.2    2 241.7

36
Operating revenues (USD million) Q2 16 Q1 16 Q2 15 6M 16 6M 15 2015 Charter income 109.1 56.2 80.0 165.3 191.8 425.4 Mob/demob income 0.5 13.9 0.8 14.4 1.8 5.4 Other income 5.8 32.9 11.7 38.7 23.1 43.9 Total 115.4 103.0 92.5 218.4 216.7 474.7
Covenants Q2 2016
     Liquidity minimum MUSD 65*
      • Cash Q2: MUSD 68

     Book equity minimum 25 percent
      • Book equity Q2: 26 per cent

     Leverage ratio maximum 6.0
      • Net debt/adjusted EBITDA Q2: 3.6

* In April, Prosafe obtained a reduced minimum liquidity
covenant of USD 20 million until the end of the third
quarter 2016

38
You can also read