LEADING THE GLOBAL CANNABIS INDUSTRY - JULY 2021 - Tilray ...

Page created by Leslie Curry
 
CONTINUE READING
LEADING THE GLOBAL CANNABIS INDUSTRY - JULY 2021 - Tilray ...
I NV E S TO R P RE S E NTATI O N

LEADING THE GLOBAL
CANNABIS INDUSTRY
            J U LY 2 0 2 1
LEADING THE GLOBAL CANNABIS INDUSTRY - JULY 2021 - Tilray ...
DISCLAIMER
Certain statements contained in this press release constitute "forward-looking statements" within the meaning of federal securities laws, including the Private Securities
Litigation Reform Act of 1995. Forward-looking statements are predictions based on expectations and projections about future events and are not statements of
historical fact. You can identify forward-looking statements by the use of forward-looking terminology such as "plan," "continue," "expect," "anticipate," "intend,"
"predict," "project," "estimate," "likely," "believe," "might," "seek," "may," "will," "remain," "potential," "can," "should," "could," "future" and similar expressions, or the
negative of those expressions, or similar words or phrases that are predictions of or indicate future events or trends and that do not relate solely to historical matters.
You can also identify forward-looking statements by discussions of the Company's strategic initiatives, including productivity and synergies initiatives, our future
performance and results of operations.

Forward-looking statements involve known and unknown risks, uncertainties and other factors which may cause the actual results, levels of activity, performance or
achievements of the Company, or industry results, to be materially different from any future results, levels of activity, performance or achievements expressed or implied
by such forward-looking statements, and you should not rely on them as predictions of future events. Forward-looking statements depend on assumptions, data or
methods that may be incorrect or imprecise and may not be able to be realized. We do not guarantee that the transactions and events described will happen as
described (or that they will happen at all). Forward-looking statements include statements regarding our intentions, beliefs, projections, outlook, analyses or current
expectations for our business as well as challenges and uncertainty resulting from the COVID-19 pandemic. Certain material factors, estimates, goals, projections or
assumptions were used in drawing the conclusions contained in the forward-looking statements throughout this communication. Many factors could cause actual
results, performance or achievement to be materially different from any forward-looking statements, and other risks and uncertainties not presently known to the
Company or that the Company deems immaterial could also cause actual results or events to differ materially from those expressed in the forward-looking statements
contained herein. For a more detailed discussion of these risks and other factors, see the Annual Report on Form 10-K of Tilray for the fiscal year ended May 31, 2021.
The forward-looking statements included in this communication are made as of the date of this communication and the Company does not undertake any obligation to
publicly update such forward-looking statements to reflect new information, subsequent events or otherwise unless required by applicable securities laws.

                 2021© TILRAY |                                                                                                                                                    2
LEADING THE GLOBAL CANNABIS INDUSTRY - JULY 2021 - Tilray ...
TABLE OF CONTENTS

  I      Competitive Advantages in a Burgeoning Global Cannabis Market    4

 II      Execution Plan and Path to Profitability                        12

 III     Financial Performance                                           18

 IV      Appendix – Analyst Primer                                       22

       2021© TILRAY |                                                         3
LEADING THE GLOBAL CANNABIS INDUSTRY - JULY 2021 - Tilray ...
I NV E S TO R P RE S E NTATI O N

Competitive Advantages
    in a Burgeoning
Global Cannabis Market
LEADING THE GLOBAL CANNABIS INDUSTRY - JULY 2021 - Tilray ...
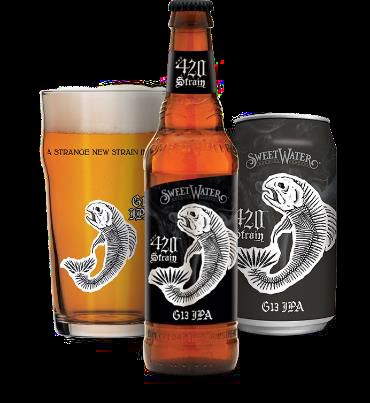
Leading the Global Cannabis Market

       Global Cannabis is at                        Tilray is Poised to                          Set Pieces are
        an Inflection Point                         Capitalize and Win                              in Place

ü $186bn+ Opportunity                        ü World’s Largest Cannabis Company          ü Brands and Products have Broad
                                                                                           Consumer Appeal
ü 47/196 countries have legalized medical    ü Strategic Footprint & Operational Scale
                                                                                         ü Scale and Reach to Win
ü 2/196 countries have legalized adult-use
                                             ü Strengthening Leadership Position         ü Peerless Among Global Cannabis
                                                in Canada                                  Companies

                                             ü Accelerating International Growth
                                             ü Enhancing U.S. CPG Presence
                                                & Infrastructure

                                             ü Delivering Substantial Synergies

              2021© TILRAY |                                                                                                5
LEADING THE GLOBAL CANNABIS INDUSTRY - JULY 2021 - Tilray ...
Global Cannabis is at an Inflection Point

                                                                                                                                 Global Paradigm Shift Underway
                     $186bn + Opportunity        1
                                                                                                                                 • 47/196 countries have legalized medical
                                                                                                                                 • 2/196 countries have legalized adult-use

         Jan 2020                     Dec 2020                               Feb 2021                               April 2021                               June 2021
         Tilray Exports               Tilray and Aphria                      Tilray Announces:                      Tilray named                             •   Tilray launches new medical cannabis
         First Shipment of            Announce                               • Portugal Market                      TIME100’s Most                               brand, Symbios
         Medical Cannabis             Business                                   Authorization                      Influential                              •   Tilray announces first cross-brand
         Allowed in Israel            Combination                                                                   Companies                                    collaboration and distribution in the U.S.
                                                                             •   UK Distribution
                                                                                                                                                                 between Broken Coast and SweetWater
                                                                             •   Shipment to Spain
2020

                                                 2021

                                                                                                                                                                                            Tilray Announces first
                                                                                                                                     Tilray + Aphria                                        successful harvest
                    Tilray Receives                       Tilray Announces                                                           combine to create                                      and distribution of EU
                    Full GMP                              Product                                Tilray Expands                      world's largest                                        GMP-Certified medical
                    Certification at EU                   Authorization                          Product Offering                    cannabis company by                                    cannabis grown and
                    Campus in Portugal                    in France                              in New Zealand                      geographical footprint                                 distributed in Germany
                    May 2020                              Jan 2021                               March 2021                          May 2021                                               July 2021

       We believe Tilray will win because we are a Global CPG Powerhouse, Proven Brand Builders, Trusted
                     Partners, Experienced Managers, and Focused on Long-Term Profitability

                     2021© TILRAY |                                                                                                              1 Source:   United Nations World Drug Report. Projections Include The Illicit Market.   6
LEADING THE GLOBAL CANNABIS INDUSTRY - JULY 2021 - Tilray ...
Tilray is Poised to Capitalize and Win

      Combination of Tilray and Aphria, two highly complementary businesses, created the leading
        cannabis-focused CPG company with largest global geographic footprint in the industry

Strategic Footprint           With a strong, flexible balance sheet and access to capital, the new Tilray has the strategic footprint and
& Operational Scale           operational scale necessary to compete in today’s consolidating cannabis market

Strengthening Leadership      Low-cost state-of-the-art cultivation, processing, and manufacturing facilities, and a complete portfolio of
Position in Canada            branded cannabis 2.0 products are strengthening the new Tilray’s adult-use leadership in Canada

Accelerating                  Tilray is accelerating international growth by leveraging its strong medical cannabis brands, distribution network
International Growth          in Germany, and end-to-end European Union Good Manufacturing Practices (“EU-GMP”) supply chain

Enhancing U.S. CPG            By leveraging its SweetWater and Manitoba Harvest businesses, the new Tilray is enhancing its U.S. CPG
Presence & Infrastructure     presence and infrastructure to better compete in the event of federal legalization

Substantial Synergies
                              Expect to deliver approximately US$80mm (C$100mm) of annual pre-tax cost synergies within eighteen months
                              of business combination with Aphria

             2021© TILRAY |                                                                                                                        7
LEADING THE GLOBAL CANNABIS INDUSTRY - JULY 2021 - Tilray ...
Set Pieces are In Place

        Tilray – alone among peers – understands that core CPG attributes will prevail

          Broad Consumer                     Scale and Reach                  Peerless Among Global
              Appeal                              Matter                       Cannabis Companies

  • Tilray has a broad offering of    • The fundamentals of the            • Highly-scalable operational
    well-established and sought-        cannabis market are no different     footprint
    after brands and products           than those of other CPG
                                        businesses                         • Robust capital structure
  • The global cannabis market is
    estimated to be valued at         • The new Tilray expects to          • Multi-continent distribution network
    $186bn in 2020 and is projected     dramatically increase market
                                                                           • Executive team with proven ability
    to reach $300bn by 2030, a 28%      share across its businesses
                                                                             to scale nascent – but rapidly
    CAGR
                                                                             growing – businesses

          2021© TILRAY |                                                                                            8
LEADING THE GLOBAL CANNABIS INDUSTRY - JULY 2021 - Tilray ...
Scale and Geographic Reach to Win

  Canada: Strengthening leadership position through our leading brands and distribution network

                                                        Canada TTM(1) Adult-Use Cannabis Gross Revenue as of 05-21 (USD$ Millions)(2)

         Focused on growing retail market
         share from ~16% to 30% by 2023        250,000
                                                               222,930

                                               200,000
  • Low-cost state-of-the-art cultivation,                                         180,994
                                                                                              (5)

    processing, and manufacturing facilities
                                               150,000
                                                                                                        128,983
  • Complete portfolio of branded cannabis                                                                                  122,935
    2.0 products
                                               100,000
                                                                                                                                                          (3)
                                                                                                                                                 71,974
  • Focused on innovation and building out                                                                                                                      59,664
                                                                                                                                                                         (4)

    our carefully curated brands across all     50,000
                                                                                                                                                                               44,858

    customer segments

  • Strong relationships with blue-chip             -
                                                                Tilray         Canopy Growth             Aurora               Hexo             Organigram       Cronos         Sundial
    distribution partners

                                                 Sources: Public filings.
                                                 1)   TTM compiled based on the latest filings as of this issuance date.
                                                 2)   Converted using 0.8283 CAD/USD exchange ratio as of 05/31/21 per BoC.
                                                 3)   Gross revenue based on TTM net revenue and FYQ3 2021 gross-to-net ratio.
                                                 4)   Represents rest of world net revenue plus excise taxes.
           2021© TILRAY |                        5)   Canopy Growth’s gross adult-use revenue excludes revenue associated with retail store revenue.                                     9
LEADING THE GLOBAL CANNABIS INDUSTRY - JULY 2021 - Tilray ...
Scale and Geographic Reach to Win (continued)

   International: Medical leadership + CC Pharma distribution creates unrivaled European platform

                                                   European market size of ~US$3.9bn by 2025 (1)

                        Farm to
                       Pharmacy                                                         ~US$65mm market size by 2025 (2)                                                        ~US$560mm market size by 2025 (1)
            ~US$1.3bn market size projected by 2025 (1)(3)                 Israel                                                                               United
            •    CC Pharma subsidiary provides end-to-end access                                                                                               Kingdom
 Germany         to 13,000+ pharmacies
            •    State-of-the-art cultivation & production facility
            •    Large medical market opportunity bolstered
                                                                                        ~US$60mm market size by 2025 (2)                                                        ~US$475mm market size by 2025 (1)
                 by government reimbursement
                                                                           Poland       • Aphria co-branding partnership                                         France
                                                                                          with ODI Pharma AB

            •    2.7m sq. ft. EU-GMP low-cost Cannabis
                 cultivation and production facility
 Portugal
            •    Export capabilities provide tariff-free                                ~US$430mm market size by 2025 (1)                                                       ~US$430mm market size by 2025 (1)
                 access to the EU                                           Italy       • FL Group: Wholly owned
                                                                                          subsidiary that distributes to the                                       Spain
                                                                                          Italian Cannabis market
                                                                                                                                                                                           Current Market Presence

                                                                                                                                                                                           Current CBD Market Presence

                                                                                                                                                                                           Near Term Market Opportunity
                                                                      1)    BDS Analytics report: The State of Legal Cannabis Markets: Post-COVID Forecast Updates.
                                                                      2)    Arcview Market Research / BDS Analytics report: The Road Map to a $57 Billion Worldwide Market.
            2021© TILRAY |                                            3)    National health authorities, Nation Drug agencies, National Cannabis agencies, KOMAND Consulting.                                             10
Scale and Geographic Reach to Win (continued)

                 United States: Strong CPG presence and infrastructure with two strategic pillars

                              Branded Cannabis                             U.S. Wellness
                              Lifestyle Company                            Platform

                                                                                                          Selected Retailers
• SweetWater’s robust manufacturing                           • Manitoba Harvest is a pioneer in
  and distribution infrastructure is                            branded hemp-based food products
  accelerating brand building in                                with a proven track record of success
  the U.S.
                                                              • Strong presence in packaged Hemp
• ~40,000 on-premise and off-premise                            Seeds, with 47% market share in
  points of sale across 34 states                               the US

• Opportunity to introduce leading                            • Opportunity to leverage capabilities
  brands via craft beers and other                              and expertise to extend brands globally
  beverages to build brand awareness                            and innovate in new categories

             2021© TILRAY |                                                                                                    11
I NV E S TO R P RE S E NTATI O N

   Execution Plan
and Path to Profitability
Executing on the Opportunity

         We are laser-focused on ensuring potential is translated into performance and value

              Delivering on                   Prepared for Key Markets to liberalize                      Brands and Product
               Synergies                           and/or re-open post-COVID                                   Portfolio

Executing on rigorous 100-Day Plan:           •   Canada – Educating consumers and            Unique and compelling global advantage
                                                  maximizing exposure to our full range of    through our sheer depth and diversity of
•   Installed new executive leadership team       products and brands                         products and brands:
    and board with extensive CPG experience
                                              •   International – Well positioned in Europe   •   Portfolio rationalization underway
•   Substantial progress on business
    integration                                   with hubs in Germany and Portugal and       •   Applying most effective CPG marketing tactics
                                                  end-to-end EU-GMP supply chain                  to Tilray’s brand portfolio
•   Actualized synergies to date $35M
                                              •   U.S. – Ideally situated for federal         •   Launched new medical cannabis brand
                                                  legalization                                    Symbios in Canada
                                                                                              •   SweetWater
                                                                                              •   Manitoba Harvest Portfolio

                2021© TILRAY |                                                                                                                    13
Tilray’s Complete Product Offering for Consumers

   We are well positioned in all large cannabis markets globally with a complete product offering

                          Flower/Pre-Rolls
                          Oils/Capsules
    Medical               Vape
                          Edibles
                          Topicals

                          Flower/Pre-Rolls
  Premium Plus            Oils/Capsules
                          Vape

                          Flower/Pre-Rolls
    Premium               Oils/Capsules
                          Vape

                          Flower/Pre-Rolls
                          Oils/Capsules
     Core                 Vape
                          Edibles
                          Beverage

   Economy                Flower/Pre-Rolls

         2021© TILRAY |                                                                             14
Leadership Team with Extensive CPG Experience

Irwin D. Simon                       Carl Merton                 Denise Faltischek                 Jim Meiers                    Mitchell Gendel
Chairman and                         Chief Financial Officer     Head of International Business    President, Canada             Global General Counsel and
Chief Executive Officer                                          and Chief Strategy Officer                                      Corporate Secretary

Rita Seguin                          Lloyd Brathwaite            Berrin Noorata                    Jared Simon                   Freddy Bensch
Chief Human Resources Officer        Chief Information Officer   Chief Corporate Affairs Officer   President, Manitoba Harvest   Founder and CEO,
                                                                                                   and Tilray Wellness           SweetWater Brewing Company

                    2021© TILRAY |                                                                                                                            15
Board of Directors

                     Board includes seven former Aphria directors + former Tilray CEO Brendan Kennedy

Irwin D. Simon                             Renah Persofsky, ICD.D                       Jodi Butts                               David Clanachan                          John M. Herhalt
Chairman of the                            Vice-Chair (Lead Director) and Chair         Nominating & Governance Committee        Audit Committee Member,                  Chair of the Audit Committee,
Board of Directors                         of the Nominating and Governance             Member, Independent Director             Independent Director                     Independent Director
                                           Committee, Independent Director

                       David Hopkinson                            Brendan Kennedy                            Tom Looney                                Walter Robb
                       Nominating and Governance                  Director and Former CEO, Tilray            Audit Committee & Compensation            Chair of the Compensation
                       Committee & Compensation Committee                                                    Committee Member, Independent Director    Committee & Audit Committee
                       Member, Independent Director                                                                                                    Member, Independent Director

                     2021© TILRAY |                                                                                                                                                                       16
Driving Profitability

                                       S H O R T- T E R M                                                                LONG-TERM

    Maximize synergies                         Reinforce leadership                                • Increase distribution of high-
    and cost benefits                          in higher-margin                                      margin, value-added branded
    from increased scale                       international medical                                 products globally in medical and
    Business integration is                    markets                                               adult-use markets
    well underway
                                                                                                   • Pursue strategic partnerships
                                                                                                     and M&A to expand presence
                                                                                                     of brands globally

                                                                                                   • Focus on maximizing U.S.
                                                                                                     opportunity when legalization
                                                                 Grow existing manufacturing
                                                                 and distribution capabilities
                                                                                                     occurs
                                                                 and increase brand presence
                              Further strengthen
                              Canadian leadership                Expand infrastructure             • Enter new medical and
                              and market share with              in the U.S. through                 adult-use markets
                              broader medical and                growth of SweetWater
                              adult-use portfolio                and Manitoba Harvest

           2021© TILRAY |                                                                        1 Source:   United Nations World Drug Report. Projections Include The Illicit Market.   17
I NV E S TO R P RE S E NTATI O N

Financial Performance
Quarterly Revenue

USD$ (thousands)                                                                                                               2018                           2019                           2020                            2021

160,000
                                                                                                                                                                                                                 142,236
140,000
                                                                                129,459
                                                                                                                                                123,900
                                          117,490
120,000                                                                                                                                                                                              113,542
                                                                                                                                     107,739

100,000                                                                                                                                                                                   97,223
                                 94,078
                                                                     89,967

 80,000

 60,000                                                                                                                   55,643

 40,000

 20,000                                                     16,385
                        10,051                                                                                 7,924                                                           9,281
             4,723                                  6,563

     -

                                                                     Based On Tilray’s Interim Unaudited Financial Statements for the Quarters Ended August 31, 2018/2019/2020/2021, November 30, 2018/2019/2020/2021, February 27,
             2021© TILRAY |                                                       2018/2019/2020,/2021 and the Audited Financials Years Ended May 31, 2018/2019/2020/2021. Historical CAD Translated at Rates from bankofcanada.ca    19
Historical Financial and Operating Performance

(USD$ thousands)                    Revenue                                         Revenue by business segments
600,000                                                                                         FY21
                                                      513,085
500,000
                                        405,326
400,000                                                                                                    Wellness, 1%
300,000
                   179,303
200,000
100,000
     -
                    2019                 2020          2021
                                                                                                                                                                       Cannabis,
                                                                                                                                                                         39%
                          Adjusted EBITDA
                   2019                 2020           2021         Distribution,
 50,000                                                                 54%
 40,000                                                    40,771
 30,000
 20,000
 10,000
                                              5,845
     -
(10,000)
(20,000)                                                                                                                                          Beverage alcohol,
                          (23,780)                                                                                                                      6%
(30,000)

                   2021© TILRAY |                                                    Based On Tilray’s Interim Unaudited Financial Statements for the Years ended May 31, 2018, 2019, 2020 and 2021   20
Balance Sheet and Liquidity Advantages

   Our ability to capture the opportunity ahead of us is further bolstered by the industry’s strongest balance sheet

            Pro Forma Capital Structure Strategy                                                                  Key Financials

                                                                                                                                                         USD$ (millions)
• De-leverage through growth and cash flow
                                                             Cash                                                                                        $488
• Committed to conservative leverage profile
• No near-term maturities                                         Secured Debt                                                                           $262

• Flexible capital structure facilitates continued growth         Convertible Note                                                                       $668

                                                             Total Debt                                                                                  $930

                                                             LTM Net Revenue (1)(2)                                                                      $513

                                                             LTM Adult-Use Gross Revenue (1)                                                             $223

                                                            Sources: Public filings.
                                                            (1)     Includes 1 month of revenue due to the Tilray reverse acquisition on April 30, 2021
             2021© TILRAY |                                 (2)     Includes 6 months of beverage alcohol revenue due to the SweetWater acquisition on November 25, 2020   21
I NV E S TO R P RE S E NTATI O N

APPENDIX
Overview – Analyst Primer Breakdowns

• Tilray legal acquirer, Aphria accounting acquirer
• As accounting acquirer, Aphria’s:
     - Year-end of May 31st is the go forward year-end

     - Historical financial statements represent the comparative financials of go forward

     - Historical financial statements to be converted to US GAAP

     - Historical financial statements to presented in USD

• As part of 10K filed on July 28, 2021 already provided information to support comparative figures but presented for years
  ended May 31, 2021 and 2020 only. Detailed quarterly information was not filed.

             2021© TILRAY |                                                                                                   23
2020 Quarterly comparative financial results

For the year ended May 31, 2020
                                    Three months ended   Three months ended   Three months ended    Three months ended     Year ended
                                      August 31, 2019        Nov 30, 2019         Feb 28, 2020         May 31, 2020        May 31, 2020
                                      US GAAP - USD        US GAAP - USD        US GAAP - USD         US GAAP - USD       US GAAP - USD

     Ca nna bis                     $           26,168 $             30,006 $             48,470              $ 48,833          $ 153,477
     Ca nna bis e xcis e                        (3,203)              (4,524)              (6,608)               (9,246)           (23,581)
     Dis tribution                              71,113               64,485               65,877                73,955            275,430
     Be ve ra ge a lcohol                            -                    -                    -                   --                 --
R evenue
 i
                                                94,078               89,967              107,739               113,542            405,326

  Ca nna bis cos ts                             11,528               11,845               24,485                20,692             68,550
  Dis tribution cos ts                          61,995               56,310               57,375                65,043            240,723
Cost of goods sold                              73,523               68,155               81,860                85,735            309,273
G ross profit
 i
                                                20,555               21,812               25,879              $ 27,807           $ 96,053
G ross margin
 i
                                                 21.8%                24.2%                24.0%                 24.5%              23.7%

                   2021© TILRAY |                                                                                                            24
2020 Quarterly comparative financial results

For the year ended May 31, 2020
                                            Three months ended    Three months ended    Three months ended    Three months ended                     Year ended
                                              August 31, 2019         Nov 30, 2019          Feb 28, 2020         May 31, 2020                        May 31, 2020
                                              US GAAP - USD         US GAAP - USD         US GAAP - USD         US GAAP - USD                       US GAAP - USD

G ross profit
 i
                                                        20,555                21,812                25,879              $ 27,807                                    $ 96,053
Operating expenses:
     Ge ne ra l a nd a dm inis tra tive 1               20,765                22,808                25,303                  24,913                                       93,789
     Am ortiza tion                                      3,518                 4,164                 3,811                   3,645                                       15,138
     S e lling                                           1,477                 4,224                 5,954                   7,320                                       18,975
     Ma rke ting a nd prom otion                         4,352                 4,918                 3,122                   2,874                                       15,266
     Re s e a rch a nd de ve lopm e nt                     455                   501                   530                     430                                        1,916
     Im pa irm e nt                                        --                    --                    --                   50,679                                       50,679
     Tra ns a ction cos ts                                 548                   515                 1,849                   1,387                                        4,299
Operating loss                                         (10,560)              (15,318)              (14,690)                (63,441)                                  (104,009)
     Non ope ra ting ite m s                            10,433                 5,762                 2,391                 (23,762)                                    (5,176)
Loss before income taxes                                  (127)               (9,556)              (12,299)                (87,203)                                  (109,185)
     Incom e ta xe s (re cove ry)                       (1,564)               (3,291)                 (600)                  (2,897)                                   (8,352)
Net loss                                               $ 1,437              $ (6,265)            $ (11,699)            $ (84,306)                                $ (100,833)

                     2021© TILRAY |                                                                                    1 General   and administrative includes stock based compensation   25
2020 Quarterly comparative financial results

For the year ended May 31, 2020
                                        Three months ended    Three months ended    Three months ended    Three months ended              Year ended
                                          August 31, 2019         Nov 30, 2019          Feb 28, 2020         May 31, 2020                 May 31, 2020
                                          US GAAP - USD         US GAAP - USD         US GAAP - USD         US GAAP - USD                US GAAP - USD

Ne t los s                                           1,437                (6,265)              (11,699)            $ (84,306)                        $ (100,833)
   Incom e ta xe s (re cove ry)                     (1,564)               (3,291)                 (600)               (2,897)                            (8,352)
   Non-ope ra ting ite m s                         (10,433)               (5,762)               (2,391)               23,762                              5,176
   Tra ns a ction cos ts                               548                   515                 1,849                 1,387                              4,299
   Im pa irm e nt                                         -                     -                     -               50,679                             50,679
   Am ortiza tion 2                                  6,659                 8,951                 9,740                10,320                             35,670
   S ha re -ba s e d com pe ns a tion                3,766                 6,229                 4,285                 3,799                             18,079
   Le a s e e xpe ns e                                 360                   110                   190                   467                              1,127
Adjusted EB ITDA
              I
                                                    $ 773                 $ 487                $ 1,374               $ 3,211                               $ 5,845

                  2021© TILRAY |                                                                                          2   As disclosed on the Statements of Cash Flows   26
2021 Quarterly comparative financial results

Through May 31, 2021

                                      Three months ended    Three months ended    Three months ended    Three months ended     Year ended
                                        August 31, 2020         Nov 30, 2020          Feb 28, 2021         May 31, 2021        May 31, 2021
                                        US GAAP - USD         US GAAP - USD         US GAAP - USD         US GAAP - USD       US GAAP - USD

     Ca nna bis re ve nue                       $ 67,120              $ 70,155              $ 55,701              $ 71,358          $ 264,334
     Ca nna bis e xcis e                         (15,918)              (15,389)              (13,980)              (17,655)           (62,942)
     Be ve ra ge a lcohol re ve nue                     -                  754                12,358                16,549             29,661
     Be ve ra ge a lcohol e xcis e                      -                  (44)                 (416)                 (602)             (1,062)
     Dis tribution re ve nue                      66,288                73,983                70,237                66,792            277,300
     We llne s s re ve nue                           --                      -                     -                 5,794               5,794
R evenue
 i
                                                 117,490               129,459               123,900               142,236            513,085
     Ca nna bis cos ts                            25,775                29,632                25,373                49,731            130,511
     Be ve ra ge a lcohol cos ts                     -                     281                 7,057                 5,349             12,687
     Dis tribution cos ts                         56,770                64,263                61,014                60,425            242,472
     We llne s s cos ts                              -                     -                     -                   4,233              4,233
Cost of goods sold                                82,545                94,176                93,444               119,738            389,903
G ross profit
 i
                                                $ 34,945              $ 35,283              $ 30,456              $ 22,498          $ 123,182
Gross margin                                       29.7%                 27.3%                 24.6%                 15.8%              24.0%

                    2021© TILRAY |                                                                                                                27
2021 Quarterly comparative financial results

Through May 31, 2021

                                       Three months ended    Three months ended    Three months ended    Three months ended                      Year ended
                                         August 31, 2020         Nov 30, 2020          Feb 28, 2021         May 31, 2021                         May 31, 2021
                                         US GAAP - USD         US GAAP - USD         US GAAP - USD         US GAAP - USD                        US GAAP - USD

Gross profit                                     $ 34,945              $ 35,283              $ 30,456               $ 22,498                                   $ 123,182
Operating expenses:
                                   1                                                                                                                               111,575
  Ge ne ra l a nd a dm inis tra tive               25,972                28,273                24,483                   32,847
  Am ortiza tion                                    4,127                 4,208                10,786                   16,100                                      35,221
  S e lling                                         5,817                 6,079                 6,155                    8,525                                      26,576
  Ma rke ting a nd prom otion                       4,925                 4,252                 3,259                    5,103                                      17,539
  Re s e a rch a nd de ve lopm e nt                   120                   225                   127                      358                                         830
  Tra ns a ction cos ts                             2,458                18,206                 9,688                   33,260                                      63,612
Operating loss                                     (8,474)              (25,960)              (24,042)                 (73,695)                                   (132,171)
  Non ope ra ting ite m s                         (19,095)              (77,481)             (228,283)                112,044                                     (212,815)
Loss before income taxes                          (27,569)             (103,441)             (252,325)                  38,349                                    (344,986)
  Incom e ta xe s (re cove ry)                     (5,825)              (14,192)                6,301                     4,744                                     (8,972)
Net loss                                        $ (21,744)            $ (89,249)           $ (258,626)              $ 33,605                                 $ (336,014)

                  2021© TILRAY |                                                                                  1 General   and administrative includes stock based compensation   28
2021 Quarterly comparative financial results

Through May 31, 2021

                                        Three months ended    Three months ended    Three months ended    Three months ended              Year ended
                                          August 31, 2020         Nov 30, 2020          Feb 28, 2021         May 31, 2021                 May 31, 2021
                                          US GAAP - USD         US GAAP - USD         US GAAP - USD         US GAAP - USD                US GAAP - USD

Net loss                                         $ (21,744)            $ (89,249)           $ (258,626)             $ 33,605                          $ (336,014)
  Incom e ta xe s (re cove ry)                      (5,825)              (14,192)                6,301                 4,744                              (8,972)
  Non-ope ra ting ite m s                           19,095                77,481               228,283              (112,044)                            212,815
  Tra ns a ction cos ts                              2,458                18,206                 9,688                33,260                              63,612
                    2                                                                                                                                     67,832
  Aim ortiza tion                                   10,979                12,031                20,283                24,539
  Acquis ition m a rk-up on inve ntory s old           --                    --                    835                      -                                835
  S ha re -ba s e d com pe ns a tion                 2,850                 5,489                 3,075                 5,937                              17,351
  Inve ntory va lua tion a djus tm e nts                  -                     -                     -               19,919                              19,919
  Fa cility s ta rt-up cos ts                             -                     -                     -                2,056                               2,056
  Le a s e e xpe ns e                                  257                   373                   404                   303                               1,337
Adjusted EB ITDA
             I
                                                   $ 8,070              $ 10,139              $ 10,243              $ 12,319                             $ 40,771

                 2021© TILRAY |                                                                                           2   As disclosed on the Statements of Cash Flows   29
Trailing twelve months quarterly pro forma results

                 The pro forma trailing twelve months ended February 28, 2021 is
                 comprised of the following unaudited combined legacy information:

                 • Legacy Aphria US GAAP and USD historical quarterly information from May 31,
                   2020 to February 28, 2021 as shown in this primer

                 • Legacy Tilray historical quarterly information from June 30, 2020 to March 31, 2021

                                                                                                                    Trailing twelve
                                Three months ended   Three months ended   Three months ended   Three months ended
                                                                                                                    months ended
                                    May 31, 2020       August 31, 2020        Nov 30, 2020         Feb 28, 2021
                                                                                                                     Feb 28, 2021
                                  US GAAP - USD        US GAAP - USD        US GAAP - USD        US GAAP - USD
                                                                                                                    US GAAP - USD
Legacy Aphria (US GAAP & USD)      May 31, 2020       August 31, 2020     November 30, 2021     February 28, 2021       Total
Legacy Tilray                      June 30, 2020     September 30, 2020   December 31, 2020      March 31, 2021         Total

             2021© TILRAY |                                                                                                           30
Trailing twelve months quarterly pro forma results

                                                                                                                              Trailing twelve
                                      Three months ended    Three months ended    Three months ended    Three months ended
                                                                                                                              months ended
                                         May 31, 2020         August 31, 2020         Nov 30, 2020          Feb 28, 2021
                                                                                                                               Feb 28, 2021
                                        US GAAP - USD         US GAAP - USD         US GAAP - USD         US GAAP - USD
                                                                                                                              US GAAP - USD

     Ca nna bis re ve nue                       $ 79,004              $ 98,546             $ 111,387              $ 87,087              376,024
     Ca nna bis e xcis e                         (13,386)              (20,131)              (21,207)              (18,626)             (73,350)
     Be ve ra ge a lcohol re ve nue                  --                    --                    754                12,358               13,112
     Be ve ra ge a lcohol e xcis e                   --                    --                    (44)                 (416)                (460)
     Dis tribution re ve nue                      73,955                66,288                73,983                70,237              284,463
     We llne s s re ve nue                        20,243                19,980                15,328                16,635               72,186
R evenue
 i
                                                 159,816               164,683               180,201               167,275             671,975
     Ca nna bis cos ts                            58,795                57,705                54,758                42,770             214,028
     Be ve ra ge a lcohol cos ts                     --                    --                    281                 7,057               7,338
     Dis tribution cos ts                         65,043                56,770                64,263                61,014             247,090
     We llne s s cos ts                           13,590                11,524                10,151                12,475              47,740
Cost of goods sold                               137,428               125,999               129,453               123,316             516,196
G ross profit
 i
                                                  22,388                38,684                50,748                43,959             155,779
G ross margin
 i
                                                   14.0%                 23.5%                 28.2%                 26.3%               23.2%

                     2021© TILRAY |                                                                                                                31
Trailing twelve months quarterly pro forma results

                                                                                                                                           Trailing twelve
                                                   Three months ended    Three months ended    Three months ended    Three months ended
                                                                                                                                           months ended
                                                      May 31, 2020         August 31, 2020         Nov 30, 2020          Feb 28, 2021
                                                                                                                                            Feb 28, 2021
                                                     US GAAP - USD         US GAAP - USD         US GAAP - USD         US GAAP - USD
                                                                                                                                           US GAAP - USD
G ross profit
 i
                                                             $ 22,388              $ 38,684              $ 50,748              $ 43,959           $ 155,779
Operating expenses:
     Ge ne ra l a nd a dm inis tra tive                        46,467                46,149                47,511                50,070             190,197
     S ha re -ba s e d com pe ns a tion                           --                    --                    --                    --                  --
     Am ortiza tion                                             6,982                 7,552                 7,577                14,284              36,395
     S e lling, Ma rke ting a nd prom otion                    23,475                21,216                22,916                19,153              86,760
     Re s e a rch a nd de ve lopm e nt                          1,171                 1,135                 1,533                 1,329               5,168
     Im pa irm e nt                                            79,050                   --                  2,904                   --               81,954
     Tra ns a ction cos ts                                      3,177                 2,458                14,061                54,688              74,384
     Los s from e quity m e thod inve s tm e nts                1,327                 1,420                 1,488                 1,787               6,022
Operating loss                                               (139,261)              (41,246)              (47,242)              (97,352)            (325,101)
     Non ope ra ting ite m s                                  (32,543)               11,738               (61,240)             (496,185)            (578,230)
Loss before income taxes                                     (171,804)              (29,508)             (108,482)             (593,537)            (903,331)
  Incom e ta xe s (re cove ry)                                 (5,811)               (5,448)              (16,286)                6,044              (21,501)
Net loss                                                   $ (165,993)            $ (24,060)            $ (92,196)           $ (599,581)          $ (881,830)

                     2021© TILRAY |                                                                                                                             32
Trailing twelve months quarterly pro forma results

                                                                                                                             Trailing twelve
                                      Three months ended    Three months ended    Three months ended   Three months ended
                                                                                                                             months ended
                                         May 31, 2020         August 31, 2020         Nov 30, 2020         Feb 28, 2021
                                                                                                                              Feb 28, 2021
                                        US GAAP - USD         US GAAP - USD         US GAAP - USD        US GAAP - USD
                                                                                                                             US GAAP - USD

Le ga cy Aphria a djus te d EBITDA               $ 3,211               $ 8,070              $ 10,139             $ 10,243            $ 31,663
Le ga cy Tilra y a djus te d EBITDA              (12,277)               (1,547)                3,219               (6,283)            (16,888)
Pro forma EB ITDA
               I
                                                $ (9,066)              $ 6,523              $ 13,358              $ 3,960            $ 14,775

                   2021© TILRAY |                                                                                                                33
NASDAQ: TLRY | TSX: TLRY

                           I N V E S T O R R E L AT I O N S   MEDIA INQUIRES

                           Raphael Gross                      Berrin Noorata

                           203.682.8253                       news@Tilray.com

                           Raphael.Gross@icrinc.com
You can also read