Third Quarter 2017 Earnings Presentation - November 10, 2017 - Aleris

Page created by Lester Lopez
 
CONTINUE READING
Third Quarter 2017 Earnings Presentation - November 10, 2017 - Aleris
Third Quarter 2017
                        November 10, 2017
Earnings Presentation

                                            1
Third Quarter 2017 Earnings Presentation - November 10, 2017 - Aleris
Forward-Looking and Other Information
 IMPORTANT INFORMATION
 This information is current only as of its date and may have changed. We undertake no obligation to update this information in light of new information, future events or otherwise. This information contains
 certain forecasts and other forward looking information concerning our business, prospects, financial condition and results of operations, and we are not making any representation or warranty that this
 information is accurate or complete. See “Forward-Looking Information” below.
 BASIS OF PRESENTATION
 We are a direct wholly owned subsidiary of Aleris Corporation. Aleris Corporation currently conducts its business and operations through us and our consolidated subsidiaries. As used in this presentation,
 unless otherwise specified or the context otherwise requires, “Aleris,” “we,” “our,” “us,” “ and the “Company” refer to Aleris International, Inc. and its consolidated subsidiaries. Notwithstanding the
 foregoing, with respect to the historical financial information and other data presented in this presentation, unless otherwise specified or the context requires, “Aleris,” “we,” “our,” “us,” and the “Company’
 refer to Aleris Corporation. We completed the sale of our recycling and specification alloys and extrusions businesses in the first quarter of 2015. We have reported these businesses as discontinued
 operations for all periods presented, and reclassified the results of operations of these businesses as discontinued operations. Except as otherwise indicated, the discussion of the Company’s business
 and financial information throughout this presentation refers to the Company’s continuing operations and the financial position and results of operations of its continuing operations.
 FORWARD-LOOKING INFORMATION
 Certain statements contained in this presentation are “forward-looking statements” within the meaning of the federal securities laws. Statements under headings with “Outlook” in the title and statements
 about our beliefs and expectations and statements containing the words “may,” “could,” “would,” “should,” “will,” “believe,” “expect,” “anticipate,” “plan,” “estimate,” “target,” “project,” “look forward to,”
 “intend” and similar expressions intended to connote future events and circumstances constitute forward-looking statements. Forward-looking statements include statements about, among other things,
 the pending acquisition of the Company by Zhongwang USA LLC (the “Merger”), future costs and prices of commodities, production volumes, industry trends, anticipated cost savings, anticipated benefits
 from new products, facilities, acquisitions or divestitures, projected results of operations, achievement of production efficiencies, capacity expansions, future prices and demand for our products and
 estimated cash flows and sufficiency of cash flows to fund capital expenditures. Forward-looking statements involve known and unknown risks and uncertainties, which could cause actual results to differ
 materially from those contained in or implied by any forward-looking statement. Important factors that could cause actual results to differ materially from the forward-looking statements include, but are not
 limited to, the following: (1) our ability to successfully implement our business strategy; (2) the success of past and future acquisitions or divestitures; (3) the cyclical nature of the aluminum industry,
 material adverse changes in the aluminum industry or our end-uses, such as global and regional supply and demand conditions for aluminum and aluminum products, and changes in our customers’
 industries; (4) increases in the cost, or limited availability, of raw materials and energy; (5) our ability to enter into effective metal, energy and other commodity derivatives or arrangements with customers
 to manage effectively our exposure to commodity price fluctuations and changes in the pricing of metals, especially London Metal Exchange-based aluminum prices; (6) our ability to generate sufficient
 cash flows to fund our capital expenditure requirements and to meet our debt obligations; (7) competitor pricing activity, competition of aluminum with alternative materials and the general impact of
 competition in the industry end-uses we serve; (8) our ability to retain the services of certain members of our management; (9) the loss of order volumes from any of our largest customers; (10) our ability
 to fulfill our substantial capital investment requirements; (11) our ability to retain customers, a substantial number of whom do not have long-term contractual arrangements with us; (12) risks of investing
 in and conducting operations on a global basis, including political, social, economic, currency and regulatory factors; (13) variability in general economic conditions on a global or regional basis; (14)
 current environmental liabilities and the cost of compliance with and liabilities under health and safety laws; (15) labor relations (i.e., disruptions, strikes or work stoppages) and labor costs; (16) our
 internal controls over financial reporting and our disclosure controls and procedures may not prevent all possible errors that could occur; (17) our levels of indebtedness and debt service obligations,
 including changes in our credit ratings, material increases in our cost of borrowing or the failure of financial institutions to fulfill their commitments to us under committed facilities; (18) our ability to access
 credit or capital markets; (19) the possibility that we may incur additional indebtedness in the future; (20) limitations on operating our business as a result of covenant restrictions under our indebtedness,
 and our ability to pay amounts due under the Senior Notes; (21) risks related to the Merger (including the possibility that the merger may not be consummated or, that, if the Merger does close, our
 stockholders may not realize the anticipated benefits from the Merger) and (22) other factors discussed in our filings with the Securities and Exchange Commission, including the sections entitled “Risk
 Factors” contained therein. Investors, potential investors and other readers are urged to consider these factors carefully in evaluating the forward-looking statements and are cautioned not to place undue
 reliance on such forward-looking statements. We undertake no obligation to publicly update or revise any forward-looking statements, whether in response to new information, futures events or otherwise,
 except as otherwise required by law.
 NON-GAAP INFORMATION
 The non-GAAP financial measures contained in this presentation (including, without limitation, EBITDA, Adjusted EBITDA, commercial margin, and variations thereof) are not measures of financial
 performance calculated in accordance with U.S. GAAP and should not be considered as alternatives to net income and loss attributable to Aleris Corporation or any other performance measure derived in
 accordance with GAAP or as alternatives to cash flows from operating activities as a measure of our liquidity. Non-GAAP measures have limitations as analytical tools and should be considered in
 addition to, not in isolation or as a substitute for, or as superior to, our measures of financial performance prepared in accordance with GAAP. Management believes that certain non-GAAP financial
 measures may provide investors with additional meaningful comparisons between current results and results in prior periods. Management uses non-GAAP financial measures as performance metrics
 and believes these measures provide additional information commonly used by the holders of our senior debt securities and parties to the 2015 ABL Facility with respect to the ongoing performance of our
 underlying business activities, as well as our ability to meet our future debt service, capital expenditure and working capital needs. We calculate our non-GAAP financial measures by eliminating the
 impact of a number of items we do not consider indicative of our ongoing operating performance, and certain other items. You are encouraged to evaluate each adjustment and the reasons we consider it
 appropriate for supplemental analysis. See “Appendix.”
 INDUSTRY INFORMATION
 Information regarding market and industry statistics contained in this presentation is based on information from third party sources as well as estimates prepared by us using certain assumptions and our
 knowledge of these industries. Our estimates, in particular as they relate to our general expectations concerning the aluminum industry, involve risks and uncertainties and are subject to changes based
 on various factors, including those discussed under “Risk Factors” in our filings with the Securities and Exchange Commission.
 WEBSITE POSTING
 We use our investor website (investor.aleris.com) as a channel of distribution of Company information. The information we post through this channel may be deemed material. Accordingly, investors
 should monitor this channel, in addition to following our press releases, Securities and Exchange Commission ("SEC") filings, and public conference calls and webcasts. The content of our website is not,                2
 however, a part of this presentation.
Third Quarter 2017 Earnings Presentation - November 10, 2017 - Aleris
Third Quarter Overview
3Q17 Adjusted EBITDA of $46M
                                                         3Q Adjusted EBITDA ($M)
Successful completion of complex Lewisport
hot mill outage

CALP I in production mode

Improved underlying operating performance offset by         $53
                                                                               $46
lower volume demand
  – Strong North America operating performance
                                                           3Q16               3Q17
    and productivity; favorable metal spreads
  – Planned extended Lewisport outage had              Adjusted EBITDA per ton ($/t)
    significant one-time impact in the quarter
  – Slower 3Q / 2H B&C volume
  – Europe unfavorably impacted by short-term
    aerospace and automotive headwinds and a                $249              $229
    weaker U.S. dollar
Executed new LTA with Bombardier with increased
                                                           3Q16               3Q17
volume; others pending

         Critical accomplishments achieved in third quarter; moving to next phase
                                                                                       3
Third Quarter 2017 Earnings Presentation - November 10, 2017 - Aleris
Key Global End Uses
                       3Q YoY
                       Growth             Aleris Volume Drivers
                                Ongoing industry destocking, weaker
                                than expected volumes
                                Long-term fundamentals and backlogs
          Aerospace    (14%)    remain robust
                                LTA volume gains should more than
                                offset destocking effect going into 2018

                                Continued impact from OEM program
                                timing delays through 3Q17
          Automotive   (4%)     EU capacity held to support NA
                                NA ABS shipments began in 4Q17

                                Demand growth remains strong
          Heat
          Exchanger     6%      HEX volume upside limited by available
                                capacity until 2019

                                                                           4
Third Quarter 2017 Earnings Presentation - November 10, 2017 - Aleris
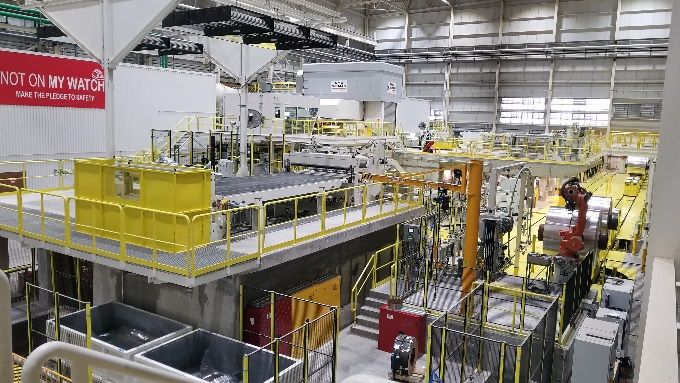
Key Regional End Uses
                          3Q YoY
                          Growth           Aleris Volume Drivers
                                   Uneven demand trends after strong
          N.A.                     start to year
          Building &      (13%)    Single family starts trending positively
          Construction             2H16 delinquency catch-up contributing
                                   to unfavorable YoY comparison

                                   Overall end-use customer demand
          N.A.                     environment remains favorable
          Distribution    (9%)     Significant effects from Lewisport hot
                                   mill outage

                                   Better volumes than 3Q16 but cyclical
                                   demand remains low
          N.A.
          Truck Trailer
                          10%      YTD volumes now flat compared to
                                   prior year

          EU Regional              Focus on value-added product mix
          Commercial      (4%)     Ongoing uncertainty due to elevated
          Plate & Sheet            LME prices

                                                                              5
Third Quarter 2017 Earnings Presentation - November 10, 2017 - Aleris
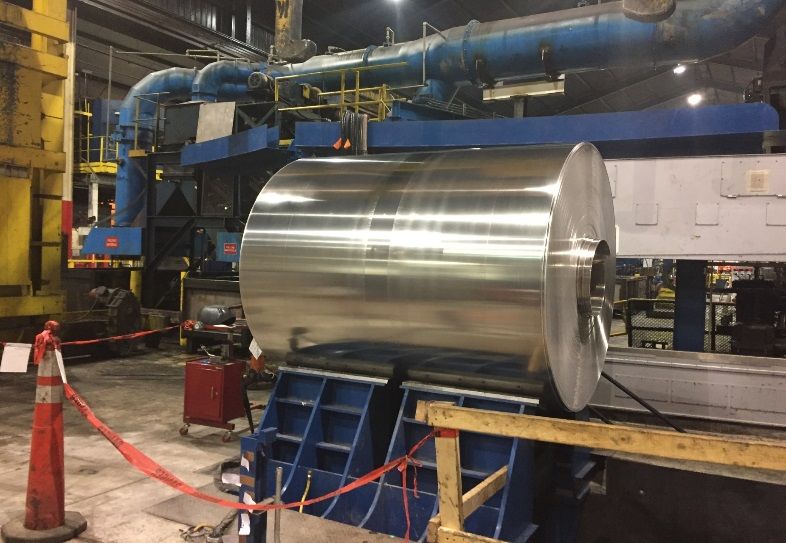
Lewisport Outage Update

                                                                 First Wide Coil:
       Scalper                 Reversing Mill                      Sep. 5, 2017

  Widened the scalper           Upgraded pre-heating equipment     ABS spec-ready
  Widened the hot mill          Upgraded hot mill controls         Improved reliability and uptime

 Over 4,000 individual projects successfully completed during ~60-day outage
 Approximately $30M Adjusted EBITDA impact from Lewisport outage in 2017

               Complex outage completed; great execution by Lewisport team
                                                                                                     6
Third Quarter 2017 Earnings Presentation - November 10, 2017 - Aleris
North America ABS Project Update
               AUTOMOTIVE BODY SHEET (ABS) PROJECT CAPEX ($M)
                    2014            2015           2016           2017E                  3Q17
                     $13            $153           $185             $72                   $16

   Wide Cold Mill                                    CALP I                                       CALP II

 First commercial ABS coil recently shipped, focused on additional customer qualifications and contracts
 Wide Cold Mill: Provisional acceptance complete
 CALP I: Provisional acceptance complete; moved into production mode
 CALP II: Commissioning well underway
 Three of four alloys approved by primary OEM; fourth currently in aging process

                    Automotive expansion on target to hit critical milestones
                                                                                                            7
Third Quarter 2017 Earnings Presentation - November 10, 2017 - Aleris
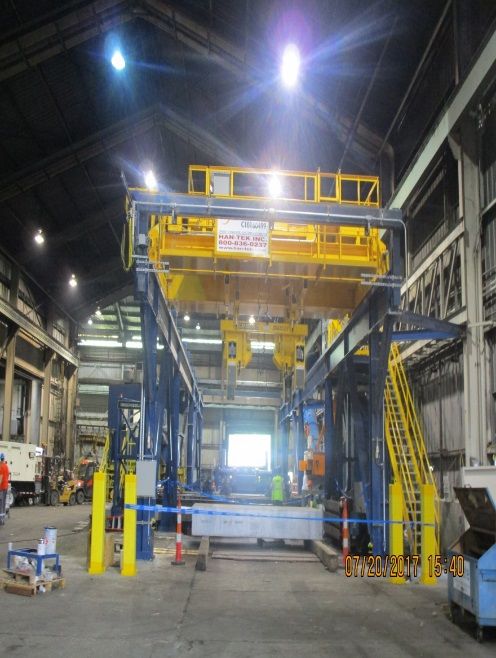
Adjusted EBITDA Bridges
($M)

        3Q17 vs. 3Q16
   60

   50                 ($8)                $1         ($1)
                                 $3                              ($6)                         ($1)
                                                                                $5
   40
           $53
                                                                                                           $46
   30

   20
          3Q16     Volume/Mix   Price    Metal    Commodity      Base      Productivity    Currency/       3Q17
                                        Spreads    Inflation   Inflation                  Translation/
                                                                                             Other

        3Q17 YTD vs. 3Q16 YTD
 200

                                         $12         ($7)
 160                  ($2)       $5                             ($17)                         $0
                                                                              $11

 120      $162                                                                                            $164

  80
        3Q16 YTD   Volume/Mix   Price    Metal    Commodity      Base      Productivity    Currency/     3Q17 YTD
                                        Spreads    Inflation   Inflation                  Translation/
                                                                                             Other                  8
Third Quarter 2017 Earnings Presentation - November 10, 2017 - Aleris
North America
                           Volume (kT)                                                      Segment Adjusted EBITDA ($M)

                                   (10%)

                127                                                                                                           $21
                                                              115                                    $18

               3Q16                                          3Q17                                   3Q16                      3Q17

                                                                                          Adj. EBITDA / ton
                                                                                                    $143                      $186

     3Q Adjusted EBITDA Bridge ($M)                                                                    3Q17 Performance
25
                                                                                          As expected, volume impact from Lewisport outage,
                                                                                          uneven B&C demand and an unfavorable
20                                           ($1)                                         comparison period
                                   $4                                   $4
                                                         ($3)
                                                                                          Improved operational performance contributed to
              ($4)       $3                                                        $21    higher Adj. EBITDA and Adj. EBITDA / ton
15
     $18
                                                                                          Favorable metal spread environment with better
10
                                                                                          scrap flows and usage
     3Q16   Volume/Mix   Price    Metal    Commodity      Base      Productivity   3Q17
                                 Spreads    Inflation   Inflation
                                                                                          Improved rolling margins offset by decline in B&C
                                                                                          and distribution volumes
                                                                                                                                              9
Third Quarter 2017 Earnings Presentation - November 10, 2017 - Aleris
Metal Update

                                                        North America Scrap Spreads1

              $1.10                                                                                                                      $0.36

                                                                                                                                         $0.34
              $1.05
                                                                                                                                         $0.32
              $1.00
                                                                                                                                         $0.30

              $0.95                                                                                                                      $0.28

                                                                                                                                         $0.26
              $0.90
                                                                                                                                         $0.24

              $0.85                                                                                                                      $0.22

                                                                                                                                         $0.20
              $0.80
                                                                                                                                         $0.18
              $0.75
                                                                                                                                         $0.16

              $0.70                                                                                                                      $0.14
                  Dec         Mar          Jun        Sep      Dec     Mar        Jun      Sep      Dec       Mar           Jun   Sep
                  2014        2015        2015        2015     2015    2016      2016      2016     2016      2017         2017   2017

                                           P1020 (left axis)     Weighted Painted Siding, Mixed Low Copper, Sheet Spread

1Platts,   Aleris Management Analysis, October 2017

                                  Ongoing improvement in metal spreads and scrap trends
                                                                                                                                                 10
Europe
                                  Volume (kT)                                                Segment Adjusted EBITDA ($M)

                                           (4%)

                     82                                           78                                  $42
                                                                                                                               $29

                  3Q16                                          3Q17                                 3Q16                      3Q17

                                                                                           Adj. EBITDA / ton
                                                                                                     $512                      $365

     3Q Adjusted EBITDA Bridge ($M)                                                                     3Q17 Performance
45
                                                                                           Volume and mix lower due to continued aerospace
40            ($5)                                                                         destocking and shift in automotive program timing;
                          $1
                                    ($3)                                                   partially offset by increased HEX volumes
35                                           ($0)
                                                       ($2)
                                                                $0                         Higher hardener costs and increased externally
     $42                                                                 ($4)
30
                                                                                           purchased slab impacted metal spreads
25                                                                                  $29    FX headwinds continue to persist
20
     3Q16   Volume/Mix    Price     Metal Commodity Base Productivity Currency/     3Q17
                                   Spreads Inflation Inflation       Translation/
                                                                        Other

                                                                                                                                                11
Asia Pacific
                                Volume (kT)                                                Segment Adjusted EBITDA ($M)
                                          7%

                                                                 7                                                             $4
                   7                                                                                $3

                3Q16                                          3Q17                                 3Q16                       3Q17

                                                                                         Adj. EBITDA / ton
                                                                                                   $398                       $527

    3Q Adjusted EBITDA Bridge ($M)                                                                    3Q17 Performance
5
                                                                                         Volumes slightly higher than prior year
4
                                                                                         Lower rolling margins due to increased competition
3
              $1
                        ($1)
                                                                        $1               in more commoditized grades of commercial plate
                                  $0        $0
                                                     ($1)      $1                        Productivity gains from continued strong operational
2                                                                                 $4
                                                                                         performance
    $3
1

0
    3Q16   Volume/Mix   Price     Metal Commodity Base Productivity Currency/     3Q17
                                 Spreads Inflation Inflation       Translation/
                                                                      Other

                                                                                                                                                12
Cash Flow and LTM Working Capital

                           Net Cash Flow ($M)                                                Total LTM Working Capital Days1
                                                                                        80
                                                                      3Q16      3Q17                                                     21%
                                                                                                 21%
                                                                                        75
Cash Provided by Operating Activities                                   $2      $43                                  19%
                                                                                        70

Capital Expenditures                                                   (74)     (57)
                                                                                        65
                                                                                                  76                                     76
Other                                                                   (0)      (2)    60                           71

                                                                                        55
Net Cash Before Financing                                             ($72)     ($15)

                                                                                        50
                                                                                                 2015                2016            3Q17

                                                                                                              Days          % of Sales

                                                                                             Higher LME increasing working capital investment
                                                                                             Additional inventory for Lewisport outage and ABS
                                                                                             commissioning/qualification

  1Pro   forma for divestitures of Global Recycling and Extrusions businesses

                                                Balancing ABS project ramp-up and cash flow
                                                                                                                                                 13
Capital & Liquidity Overview
   Capital Expenditures Summary ($M)1                                                                                Liquidity Summary ($M)
                               $358                                                                                                             9/30/2017
                                  $8                                                                   Cash and Restricted Cash3                      $76
                    $298
                      $10                                                                              Availability under ABL Facility               206

                                       $230-$2402
                                             $7                                                        Liquidity                                    $281
$188                            $276
                     $201                                                               $175
                                                                                          $5

$107     $121
                                            $157     $125                                                              Capital Structure ($M)
          $14                                                                            $128
                                                                              $57                                                                9/30/2017

          $96                                                                 $2                       Cash and Restricted Cash3                      $76
$82                   $88        $74      $65-$75                             $45
                                                                                          $42
                                                                              $10
                                                                                                       ABL                                            245
2013     2014       2015        2016      2017E 2018E                        3Q17       3Q17
                                                                                                       Notes4                                        1,240
                                                                                        YTD
                 Other Growth                                                                          Non-Recourse China Loan Facilities4            174

                 North America ABS Project & Other Upgrades                                            Other4,5                                        10
                 Maintenance                                                                           Net Debt                                     $1,593

  1Excludes  discontinued operations CapEx of $50M, $43M, $15M in 2013-2015
  2Guidance  does not include capitalized interest                                                     LTM Adjusted EBITDA6                          $206
  3Includes $4M of restricted cash for payoff of China Loan Facility
  4Amounts exclude applicable premiums and discounts
  5Other excludes $45M of exchangeable notes                                                           Net Debt / LTM Adj. EBITDA                     7.7x
  6See prior SEC filing for applicable reconciliations to GAAP financial measures
  7Excludes Non-Recourse China Loan Facilities                                                         Net Recourse Debt7 / LTM Adj. EBITDA           6.9x
  8Secured debt includes outstanding ABL Facility balance and 2021 Secured Notes                                       8
                                                                                                       Net Secured Debt / LTM Adj. EBITDA             5.1x
  Note: Certain amounts may not foot as they represent the calculated totals based on actual amounts
  and not the rounded amounts presented in these charts and tables

                                           Capital expenditures ramping down in 2017 and 2018
                                                                                                                                                         14
Outlook
  Fourth quarter 2017 segment income and Adjusted EBITDA expected to be lower than prior
  year based on continuation of current short-term trends

  Commercial shipments from first Lewisport CALP line have recently commenced and will
  show meaningful ramp up in 2018 based on contracted volumes; residual outage effect
  complete in 4Q

  Improved metal spreads expected to continue to benefit North America

  We expect building and construction fundamentals to remain healthy; fourth quarter
  volumes are expected to be lower due to delinquency reductions in the prior year

  Aerospace softness, due to continued supply chain destocking, and automotive model
  launch delays will continue to impact Europe volumes in the fourth quarter; trends reversing
  sequentially going into 2018

  Weaker U.S. dollar will negatively impact Europe results in the fourth quarter

  Strengthening long-term global aerospace presence

  We expect liquidity to benefit from customer capacity reservation fees in early 2018

                                                                                                 15
Appendix

           16
3Q Adjusted EBITDA Reconciliation
($M)

                                                                       For the three months ended     For the nine months ended
                                                                             September 30,                  September 30,
                                                                        2017               2016        2017               2016
       Adjusted EBITDA                                                   $45.5              $53.3      $163.7            $162.3
       Unrealized (losses) gains on derivative financial instruments     (18.8)                8.8        (1.5)             23.6
       Restructuring charges                                               (0.9)              (0.3)       (2.1)             (1.8)
       Unallocated currency exchange losses on debt                        (1.8)              (0.4)       (3.1)             (1.0)
       Stock-based compensation expense                                    (0.4)              (1.8)       (1.5)             (5.2)
       Start-up costs                                                    (22.8)              (14.1)     (52.6)             (30.4)
       Unfavorable metal price lag                                         (1.0)              (1.2)       (3.6)             (0.6)
       Loss on extinguishment of debt                                          -                  -           -            (12.6)
       Other                                                               (1.4)              (3.6)       (5.1)             (3.0)
       EBITDA                                                            ($1.6)             $40.7       $94.2            $131.3
       Interest expense, net                                             (32.0)              (19.2)     (90.4)             (58.4)
       Provision for income taxes                                          (1.6)             (12.3)     (25.1)             (30.5)
       Depreciation and amortization                                     (30.5)              (26.2)     (82.0)             (78.8)
       Loss from discontinued operations, net of tax                           -              (4.6)           -             (4.6)
       Net loss                                                         ($65.7)            ($21.6)    ($103.3)           ($41.0)

                                                                                                                                    17
3Q Adjusted EBITDA Reconciliation by Segment
($M)

                                                                                          For the three months ended                      For the nine months ended
                                                                                                September 30,                                   September 30,
                                                                                           2017                2016                        2017               2016
       North America
        Segment income                                                                       $19.9                     $18.1                   $75.2          $69.8
        Unfavorable (favorable) metal price lag                                                1.6                       0.1                     5.9           (2.6)
                                  1
        Segment Adjusted EBITDA                                                              $21.4                     $18.2                   $81.1          $67.2

       Europe
        Segment income                                                                       $28.4                     $40.7              $101.7             $113.8
        Unfavorable (favorable) metal price lag                                                 0.1                       1.1                   (0.5)           3.1
                                  1
        Segment Adjusted EBITDA                                                              $28.5                     $41.7              $101.2             $116.9

       Asia Pacific
        Segment income                                                                        $4.3                       $2.8                  $10.0           $6.2
        Favorable metal price lag                                                             (0.6)                         -                   (1.8)             -
        Segment Adjusted EBITDA                                                               $3.7                       $2.8                   $8.3           $6.2

 1Amounts   may not foot as they represent the calculated totals based on actual amounts and not the rounded amounts presented in this table

                                                                                                                                                                       18
3Q Adjusted EBITDA Per Ton Reconciliation
($M, except per ton measures, volume in thousands of tons)

                                                                                      For the three months ended    For the nine months ended
                                                                                            September 30,                 September 30,
                                                                                       2017                 2016     2017               2016
    Metric tons of finished product shipped:
    North America                                                                       115.3              127.5     361.9              376.7
    Europe                                                                               78.2               81.5     240.4              250.9
    Asia Pacific                                                                          7.1                6.6      19.4               16.9
    Intra-entity shipments                                                               (1.8)              (1.9)     (4.5)              (4.5)
    Total metric tons of finished product shipped                                       198.8              213.7     617.2              640.0

    Segment Adjusted EBITDA:1
    North America                                                                       $21.4              $18.2     $81.1              $67.2
    Europe                                                                               28.5               41.7     101.2              116.9
    Asia Pacific                                                                          3.7                2.8       8.3                6.2
    Corporate                                                                            (8.1)              (9.4)    (26.9)             (28.0)
    Total Adjusted EBITDA                                                               $45.5              $53.3    $163.7             $162.3

    Segment Adjusted EBITDA per metric ton shipped:
    North America                                                                      $185.8             $142.7    $224.1             $178.4
    Europe                                                                              364.7              511.7     420.8              466.0
    Asia Pacific                                                                        525.5              422.8     425.0              367.9
    Aleris Corporation                                                                  229.1              249.4     265.1              253.7

 1See   prior slides for a reconciliation to the applicable GAAP financial measures

                                                                                                                                                 19
Metal Hedging Practices
                    Risk                                  Mitigation Strategy                                    Impact
   LME and regional premium volatility           Pass through pricing and tolling                    Lowers margin volatility
   (inventory exposure)
                                                 Minimize inventory levels                           Minimizes earnings impact
                                                 Sell 100% of open inventory forward                 Risk limited to turn of inventory
                                                                                                     (“metal lag”)

   Forward price sales                           Match sales with physical purchases or LME          Locks in rolling margin
                                                 forwards
                                                                                                     Reduces multiyear dated
                                                 Attempt to minimize LT fixed price sales            derivatives

                                                Adjusted EBITDA vs. Metal price lag
                                    4Q 2015   1Q 2016     2Q 2016       3Q 2016      4Q 2016      1Q 2017     2Q 2017        3Q 2017

Metal price lag impact on gross
                                        $0        $11          $6            $8             $8        $22           $8           ($5)
profit

(+) Realized (losses) / gains on
                                        1         (7)          (9)           (9)            (5)       (19)         (12)            4
metal derivatives
Favorable / (unfavorable) metal
price lag net of realized               $1        $4           ($3)          ($1)           $4        $2           ($5)          ($1)
derivative gains / losses

Adj. EBITDA including metal lag        $40        $48          $61           $52            $47       $54          $62            $45

(–) Income / (expense) from metal
                                        1          4           (3)           (1)             4         2            (5)           (1)
price lag

Adj. EBITDA as reported                $39        $45          $65           $53            $43       $52          $66            $46

                 Robust risk management discipline minimizes commodity price exposure
                                                                                                                                        20
You can also read