Fixed Income Investor Update - 1 June 2018

Page created by Leroy Joseph
 
CONTINUE READING
Fixed Income Investor Update - 1 June 2018
Fixed Income Investor Update
1 June 2018
Agenda

  1. Business update / Q1 results
  2. Credit update
  3. Transaction related topics

                                    1
innogy is a stable business with a platform for growth

innogy is active along the energy value chain

    Sustainable generation of electricity         Efficient distribution of energy           Customer products and services

 Renewables                                 Grid & Infrastructure                        Retail

 Wind                                       Grid Assets                                  Commodity
                              3.5 GW                                    €13.5bn                                     22m
 Hydro                         installed    Grid+                        regulated       Energy+
                                                                                                                  customers
                               capacity                                  asset base
 Solar                                      Broadband

                                            Corporate/New Businesses (e.g. E-mobility)

      Targeted leverage factor of ~4.0x                               Targeted payout ratio of 70-80% of adjusted net income

                                                                                                                              2
Net investments 2018-2020 in line with innogy’s
financial targets – leverage factor of around 4.0x
innogy Group, 2018-20                                                                                      additional net growth: 1.5-2.0
€ billion
                                                                                                up to 4.5                    up to 10.0                                       Leverage:
                                                                                                                                                                              ~4.0x

                                                                                                                                                                             7.0-7.5
                                                                                                                                                         up to (3.0)
                                         ~0.9                         ~5.5
           ~4.6

        G&I ~4.0

      Retail ~0.4
    Renewables ~0.1
     Corporate ~0.1

        Day-to                   Growth capex               Commited capex                   Additional                    Total gross                Equity sell-down/   Total planned
       day capex                 (committed)                                                  growth                       investment                 disposal proceeds     net capex 1
                                                                                            opportunities                 opportunities
1 Capital expenditure on property, plant and equipment and on intangible assets, financial assets ./. proceeds from disposal of assets/divestitures
and net changes in equity (including non-controlling interests).                                                                                                                          3
Renewables – we continue to develop value-accretive
growth options
Capacity in operation, under construction and under development1
GW, pro-rata
   Onshore                Offshore              Hydro             Solar/other                                                                 3.3                          7.8
                                                                                                                                                                           2.0
                                                                                                                3.23
                                                                                                                                                                           2.5

                                                                                   1.3                                                                                     3.3
                         3.4                         0.32

                                                                                                thereof depending on successful auction results:
                                                                                    0.1                    0.8                  1.5                                        2.4

                 31 Dec 2017                COD 2018-2019                    2018-2019                      2020-23                     Post 2023                 Total pipeline
                 in operation                currently under                                              currently under development4
                                              construction
1 As of 12 March 2017. Ramp-up only includes Renewables division. Pipeline includes (1) Onshore Wind pipeline US; CFIUS (Committee on Foreign Investment in the United States) approval outstanding;
approx. 500 MW advanced stage; total project pipeline 2GW and (2) PV projects Australia; FIRB (Foreign Investment Review Board) approval outstanding; COD of 460MW expected in 2018/2019.
2 Expected share 2018: 200 MW, expected share 2019: 120 MW. 3 Incl. 860 MW Triton Knoll offshore wind project (UK CfD awarded, FID planned for mid-2018). 4 Based on planned commissioning
dates, excluding M&A activities and project-specific auctions.                                                                                                                                       4
Renewables – acquisition of valuable project
opportunities across technologies
                                                                                         New York
                   Technology        Onshore Wind                                                                 Large-scale solar
                 Project name        Cassadaga                                                                    Limondale Sun Farm / Hillston Sun Farm3
           Country/Location          United States, New York                                                      Australia, New South Wales                        New South
                                                                                                                                                                       Wales
            Planned capacity         126 MW                                                                       347 MWp / 115 MWp
         Construction Capex          ~ USD 200 m                                                                  ~ EUR 400 m (incl. project rights)
         Average load factor         37%                                                                          23%
             Status/consents         Major state permit secured (NY Article X certificate)                        Late stage
 Planned FID/construction            2019                                                                         Q2 2018 / Q3 2018
   Planned Commissioning             H1 2020                                                                      End of 2019
             Support scheme          20-yr utility PPAs, project captures 100% PTCs                               Merchant
                    Project IRR      above hurdle rate of >5% post tax1                                           above hurdle rate of >5% post tax1

                                          Project Cassadaga is part of the Onshore Wind                                 innogy benefits from BELECTRIC’s global
                                          development pipeline (> 20 projects, >2 GW) that                              experience in constructing and operating utility-
                                          innogy acquired in December (closing of                                       scale solar power plants
                                          transaction expected for Q2 20182)
1 Hurdle rates are subject to frequent review and differ depending on project structure/risks.
2 Closing of transaction and CFIUS (Committee on Foreign Investment in the United States) approval outstanding.
3 Closing of transaction and FIRB (Foreign Investment Review Board) approval outstanding.                                                                                       5
G&I Eastern Europe – stable regulatory environment
providing visibility on earnings
    Region                                            RAB (€ bn)                    WACC (%)1                    Regulatory Period                        Expected Allowed Revenues2

    Czech Republic                                          1.7                          7.94                         2016 – 2020
    Hungary                                                 0.9                          6.233                        2017 – 2020
    Poland                                                  0.7                          5.63                         2016 – 2020
    Slovakia                                                0.5                          6.27                         2017 – 2021
    Total                                                   3.8                        Ø 6.89

Overall regulatory development

•    Capex spending recognized in RAB on a yearly basis

•    Yearly GDP growth between 2.4-3.6%4 in all our Eastern European markets expected until 2022:
           less pressure on allowed energy prices and therefore expected revenues
           1-2% y-o-y RAB growth expected beyond regulatory period

1 CZ,PL: nominal; HU,SL: real. 2 Reference: 2017 Revenues. 3 Indicative WACC as of 2016, as within new regulatory period no explicit WACC is published.
4 Source: IMF World Economic Outlook Database.                                                                                                                                         6
eMobility – innogy with a leading market position in
Europe and well positioned for mass market
Financial development, adj. EBIT, €m                            Current earnings drivers                      Major KPIs, as of March 2018
                                           >0                         IT backend charging sessions                > 7,000 charging points connected
                                                                      Connected charging points
                                                                                                                  > 50,000 charging sessions per month
                                                                      Service contracts
  (27)
          ~(50)                                                       Hardware sales                              Europe and US as core markets
  2017    2018E     2019E     2020E       2021+

Tailor made customer solutions via modular offering/toolbox

  Value         Hardware                                                                  IT                      Energy                   Electricity
  Chain                                    Installation               O&M
                supply                                                                    Services                services                 sales

  Main     •   Development            •    Connection           •   Inspection   •   Backend connection   •    Grid integration       •   Electricity sale
  value    •   Customisation               management               service      •   Authentification/    •    Load management            (€/kWh, flat rate,
  pools    •   Production             •    Civil engineering    •   Full care        billing              •    Energy+                    time tariffs)
           •   Financial services     •    Installation process     pack         •   Fleet management     •    Data-driven services
                                                                                                          •    App

                                                                                                                                                           7
innogy · Q1 2018 results

Key messages Q1 2018

Financial          >   Q1 2018: Adjusted EBIT of €1,236 million – slightly below Q1 2017; adjusted net income
deliverables           of €610 million, down 11% on Q1 2017, mainly driven by an adverse financial result
                   >   Outlook 2018 confirmed: adjusted net income of more than €1.1 billion expected
                   >   AGM approved the dividend proposed by the Board of €1.60 per share for fiscal 2017

 Business update   >   German offshore: innogy secures rights for the construction and operation of Kaskasi
                       offshore wind farm in Germany with an installed capacity of 325 MW including a 20-year
                       feed-in tariff under the German Renewable Energy Act
                   >   npower/SSE merger: early May, the CMA referred the proposed transaction for an in-
                       depth investigation (phase 2; the deadline for the final CMA report is 22 October)
                   >   Higher Regional Court in Dusseldorf annulled the regulations of the imputed returns on
                       equity for the third regulatory periods for German electricity and gas networks. BNetzA
                       already indicated that it would challenge the decision at the Higher Federal Supreme Court

                                                                                                                    8
innogy · Q1 2018 results

Key events 2018
                              Q1                                            Q2                                               Q3                                          Q4

                                                         US Onshore               GER Offshore
Renewables

               AUS Solar                              Closing EverPower
                               NL Offshore                                        Auction results
              Purchase of                                 acquisition               [27 April]                          UK Offshore
                               Wind auction                                                                                                                          NL Offshore
             solar projects                                                                                              Triton Knoll
                                 results                  AUS Solar                UK Offshore                                                                  Wind new auction round
               Overland                                                                                                Financial Close
                                [end Q1]               Closing Overland           Triton Knoll FID
                 [Feb]                                    acquisition               [by end Q2]

                                                                                                                                                                  GER               East
                  GER               GER
                                                                        GER                                                                                  Determination     Determination
                               Court decision
G&I

             Determination
                                                              Final revenue caps gas1                                                                           of Xgen          of allowed
               Xgen gas        RoE calculation
                                                               [starting end of May]                                                                           electricity    revenues for t+1
                [28 Feb]         [22 March]
                                                                                                                                                              [end of Nov]        [end Q4]

                                                                                                                                                                               GB npower &
               GB npower & SSE merger                      GB npower & SSE merger                               GB npower & SSE merger                       GB npower &
                                                                                                                                                                                SEE merger
                                                                                                                                                              SEE merger
Retail

              submission of merger notice                       End of phase 1                               proposal to SSE shareholders to                                   completion of
                        to CMA                               investigation by CMA                             approve merger at AGM SSE                      CMA report on
                                                                                                                                                                                 transaction
                       [27 Feb]                                     [8 May]                                              [19 July]                            phase 2 due
                                                                                                                                                                                [exp. end of
                                                                                                                                                                [22 Oct]
                                                                                                                                                                                Q4/Q1 2019]

1 Can vary from DSO to DSO.
Remark: all dates preliminary. Next CfD auctions in UK for wind are scheduled for spring 2019; mentioning of auctions does not imply innogy participation.                                       9
innogy · Q1 2018 results

Adjusted EBIT and adjusted net income down vs Q1 2017
and in line with expectations
Adjusted EBIT                                                    Adjusted net income
€ million                                                        € million

                               35

                      21
                                                                   684
    1,261

                                                                            (25)
                                      (70)             1,236
                                                                                                22                       610
                                               (11)
                                                                                                          (10)
                                                                                       (61)

                                                                                                                    1
  Q1 2017            RES       G&I   Retail   Corp./   Q1 2018    Q1 2017   Adj.      Adj.      Adj.   Minorities       Q1 2018
                                               NB                           EBIT   financial   taxes
                                                                                     result
1 Non-controlling interests.                                                                                                   10
innogy · Q1 2018 results

Adjusted net income down 11% to €610m driven by
lower adjusted EBIT and financial result
Reconciliation of adjusted net income                                                   Key drivers

                                 Q1 2018          adjust-        Q1 2018     Q1 2017    •   Non-operating result improved versus prior year due to the
€ million
                                 reported          ment          adjusted    adjusted       valuation effect of certain derivatives
Adjusted EBITDA                    1,582              -            1,582      1,617     •   Effective tax rate slightly above Q1 2017 (30%) due to the
                                                                                            revaluation of deferred tax assets on the loss carry forward in the
Operating D&A1                      (346)             -            (346)      (356)
                                                                                            Netherlands
Adjusted EBIT                      1,236              -            1,236      1,261     •   Weaker adjusted EBIT and financial result driving development of
Non-operating result                 99             (99)                -       -           adjusted net income
Financial result                    (159)           (53)           (212)      (151)     •   Normalised tax rate to derive adjusted net income set at 25 %, in
                                                                                            line with the expectation for the sustainable level of the effective
Income before taxes                1,176            (152)          1,024      1,110
                                                                                            tax rate
Taxes on income                     (376)           120            (256)      (278)     •   Based on the 555,555,000 innogy shares outstanding, adjusted
Tax rate                            32%               -                25%     25%          net income amounted to €1.10 per share
Income                               800            (32)               768     832
Non-controlling
                                    (158)             -            (158)      (148)
interests
Net income                           642            (32)               610     684

1 By definition, operating D&A includes operating impairment losses.
                                                                                                                                                              11
innogy · Q1 2018 results

Negative free cash flow in Q1 consistent to seasonal
patterns
Cash flow statement (extract)                                                                              Net debt composition (extract)

€ million                                    Q1 2018            Q1 2017               +/-                   € billion                              31 Mar 2018 31 Dec 2017           +/-
Funds from operations (FFO)                    1,287              1,273               14                    Financial assets                            3,923              4,086    (163)
Changes in working capital                    (2,167)            (1,936)            (231)                   Financial liabilities2                     17,521              16,378   1,143
Cash flow from operating                                                                                     t/o senior bonds                          13,059              12,007   1,052
                                               (880)              (663)             (217)
activities (CFOA)
                                                                                                             t/o loans from RWE                         1,656              1,656      -
Capex1                                         (371)              (288)              (83)
                                                                                                             t/o loans from EIB                         1,044              1,039     5
Proceeds from disposals of
                                                126                128                (2)                   Net financial debt                         13,598             12,292    1,306
assets/divestitures
                                                                                                            Provisions for pensions and
Free cash flow                                (1,125)             (823)             (302)                                                               3,332              2,986    346
                                                                                                            similar obligations3
                                                                                                            Provisions for wind farm
                                                                                                                                                         359                 359      -
                                                                                                            decommissioning
                                                                                                            Total net debt                             17,289              15,637   1,652

Note: rounding differences may occur.
1 Capital expenditure on property, plant and equipment and on intangible assets and on financial assets. This item solely includes capital expenditure with an effect on cash.
2 Adjusted for ‚step-up‘ effect of €824m as of 31 March 2018 and €877 million as of 31 December 2017.
3 Including ‘Surplus of plan assets over benefit obligations‘ of €(142)m as of 31 March 2018 and €(103)m as of 31 December 2017.                                                            12
innogy · Q1 2018 results

Outlook 2018 confirmed – Retail now excludes eMobility
€ million                                                                                                                  FY 2018                                  FY 2017
unless stated otherwise                                                                                                   guidance1                                reported
  Renewables                                                                                                                ~350                                     355
  Grid & Infrastructure                                                                                                    ~1,850                                   1,944
  Retail2                                                                                                                   ~750      !                              827
Adjusted EBIT3                                                                                                             ~2,700                                   2,816

Adjusted financial result                                                                                                  ~(750)                                   (689)
Tax rate for adjusted net income                                                                                          25-30%                                     25%
Adjusted net income                                                                                                        >1,100                                   1,224

Dividend                                                                                                             70-80% of ANI                                  €1.60
Net capex4                                                                                                               ~€2.5 bn                                   1,949
                                                                                                                         target of
Leverage factor                                                                                                                                                      3.6x
                                                                                                                       around 4.0x
1 Excluding Retail UK. Any earlier forward-looking statements on Retail UK should be disregarded.
2 Retail no longer includes eMobility. 3 Including Corporate/New Businesses
4 Capital expenditure on property, plant and equipment and on intangible assets, financial assets ./. proceeds from disposal of               Outlook5 confirmed
assets/divestitures and net changes in equity (including non-controlling interests).
5 As per 13 March 2018.                                                                                                                   !   Outlook5 updated                13
Agenda

  1. Business update / Q1 results
  2. Credit update
  3. Transaction related topics

                                    14
Credit profile

innogy’s funding programmes

                    •   Independent innogy debt issuance programme established
 Debt issuance      •   Nominal volume: €20bn
 programme          •   Supplement dated 18 May 2018 to the Prospectus dated 13 April 2018

                    •   Stand-alone programme up and running
 Commercial paper   •   Nominal volume: €3bn
 programme

                    •   €2bn syndicated credit line by a group of 22 international banks
 Revolving credit   •   Maturity in 2022 with two renewal options after the first and
 facilities             second year

                                                                                           15
Credit profile

innogy’s credit rating

innogy's investment grade ratings (as of 18 May 2018)

                                                        Fitch      Moody’s   S&P

Long-term issuer default rating                         BBB+        Baa2     BBB

Outlook                                           Watch negative    Stable   Stable

Senior unsecured rating                                  A-         Baa2      BBB

Short-term issuer rating                                 F2          P2       A-2

 Moody´s removed negative watch on 18 May 2018

                                                                                      16
Credit profile

innogy’s maturity profile

Maturity profile of bonds and loans as of 31 March 2018 (€ billion)
                                                                                                                                 innogy’s issuances since the IPO:
5                                                        Maturities of loans from RWE AG (lhs)                              16
                                                                                                                                  • First senior bond in April 2017
                                                         Maturities of loans from EIB (lhs)                                 14      €750m, 1%, maturity 2025
4                                                                                                                           12
                                                         Maturities of senior bonds (lhs)                                         • First green bond in October 2017
                                                         Total outstanding bonds and loans (rhs)                            10      €850m, 1.25%, maturity 2027
3
                                                                                                                            8
                                                                                                                                  • Senior bond in January 2018
                                                                                                                            6       €1,000m, 1.50%, maturity 2029
2
                                                                                                                            4
                                                                                                                                  • Senior bonds in Mai 2018
1                                                                                                                           2
                                                                                                                                    €500m, 0.75%, maturity 2022
                                                                                                                            0       €500m, 1.625%, maturity 2026
0                                                                                                                           -2
        2018        2019         2020        2021         2022          2023      2024         2025          2026   2027+

Cumulative maturities                                                                                                               Total bonds and loans (as of 31 March 2018 ) of ~€16bn:
 As of 31 March 2018                                         2018-2020          2021-2023           2024-2026       2027+           • t/o senior bonds of innogy SE/ Finance B.V. of ~€13bn
                                                                                                                                    • t/o loans from RWE AG of ~€2bn
 Senior bonds and RWE + EIB loans (€bn)                           5.0                3.2               1.6           6.1
                                                                                                                                    • t/o EIB loans of ~€1bn
 % of total debt                                                 32%                20%               10%           38%
                                                                                                                                                                          17
1 Excluding Retail UK. Any earlier forward-looking statements on Retail UK should be disregarded.
Agenda

  1. Business update / Q1 results
  2. Credit update
  3. Transaction related topics

                                    18
Envisaged transaction structure

Voluntary public takeover offer –                                              Share purchase and transaction agreement between RWE and E.ON –
basis for joint statement                                                      very limited public information available

                                                                                                                  Transfer of 76.8% stake in innogy

                                                                                                                         Renewables business1
                                  Cash payment
                                                                                                                PreussenElektra minority interests2

                                                                                                                         €1.5bn cash payment
             innogy free float (23.2%)

                                                                                       Retail                           16.67% stake in E.ON                               Renewables
                                                                                      business                           via capital increase                               business

                                                                                      Grid &                                                                               Gas storage
                                                                                  Infrastructure                                                                            business/
                                                                                     business                                                                             Stake in Kelag

Note: Illustrative and simplified, based on publications by E.ON and RWE published on 12 March 2018.
1 Excluding German and Polish onshore wind assets belonging to e. dis (151MW) and the 20% stake in Rampion offshore wind farm (80MW). 2 Minority interests in nuclear power plants Lippe-Ems and
Gundremmingen.                                                                                                                                                                                   19
Timeline of the envisaged E.ON/RWE transaction
                                                                                                  Closing I:            Closing II:
   Voluntary                                       Expiry of                                    E.ON to take         Transfer of assets         Latest day of
public takeover        Joint statement            acceptance                      innogy        control over        under consideration           closing of
 offer by E.ON            by innogy                 period                       AGM 2019          innogy                 to RWE                     offer

  27 Apr 18               10 May 18                  early                       30 Apr 19      Expected by             Expected by              13 Jan 20
                                                     Q3 18                                       E.ON/RWE                E.ON/RWE
                                                                                                 not before              not before
                           Offer period
                                                                                                   mid 19                  end 19

                                     Initial acceptance period                           27 Apr – 6 Jul

                   Offer             Additional acceptance period                                                       12 Jul – 25 Jul
                  period
                                     Publication of (final) take-up/acceptance
                                                                                                               11 Jul                     end of Jul
                                     Watermark updates                                Weekly updates (daily in last week of offer period)

 1 As communicated/expected by RWE/E.ON.                                                                                                                 20
Executive Board and Supervisory Board have issued a
joint statement on E.ON’s voluntary PTO
Executive Board and Supervisory Board of innogy…
>   assess the consideration offered by E.ON for minority shareholders (“Offer Price“)
    to be fair from financial point of view
>   however, given the lack of information regarding the terms of the RWE/E.ON agreement,
    cannot conclusively assess whether or not the consideration offered by E.ON for the acquisition of approx.
    76.79% of innogy shares from RWE is equal to, or higher or lower than, the “Offer Price” of €36.76
>   therefore cannot assess whether the “Offer Price” and the total value of the offer in aggregate are
    appropriate and whether or not the overall transaction is in the best interests of innogy and the innogy
    shareholders
>   have concerns relating to possible future integration measures, in particular the treatment of innogy‘s
    employees
>   are convinced that an independent innogy Group is well positioned with its integrated green business
    model to shape the energy world of tomorrow
                                                                                                      21
APPENDIX
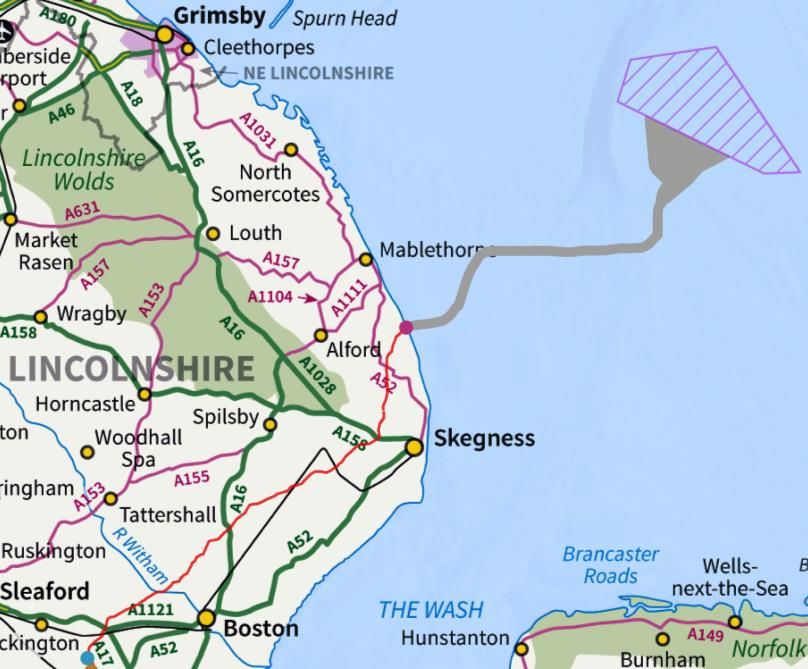
Triton Knoll offshore wind – FID planned for mid-2018

                Country         UK
           Technology           Offshore wind
               Location         Area of c. 118 km2, 32 km off the coast of Lincolnshire
   Planned capacity             ~860 MW (90 MHI Vestas V164-9.5MW turbines)
           Investment           ~£2 billion (incl. up to £0.5 billion for grid connection)
            Ownership           100% innogy1
                                                                                                                                                                     10 km
  Mean wind speed               9.83 m/s (at 107 m height)
                                                                                                                                                    Triton Knoll
                                                                                                                                                    offshore array
        Water depths            15 to 24 m (avg. 18 m)
                                                                                                                                                    Offshore
     Status/consents            Fully developed, all required consents in place                                                                     cable corridor

                                                                                                                                                    Onshore
                                FID planned for mid-2018, onshore works to begin                                                                    cable corridor
    FID/construction
                                in 2018, offshore works from 2020                                                                                   Landfall

      Commissioning             Start of commissioning scheduled for 2021                                                                           Proposed Triton Knoll
                                                                                                                                                    substation

    Support scheme              UK CfD2, £74.75/MWh3 for a total period of 15 years                                                                 Bicker Fen substation

1 innogy to review all options regarding the future ownership structure. I 2 Contract for Difference scheme. I 3 CfD strike price on 2012 prices.

                                                                                                                                                                23
APPENDIX

Overview of senior bonds and loans
As of 31 March 2018, by maturity
Senior bonds                                                                                         Loans from RWE5
                              Notional       Carrying amount                                                                       Notional
                                                                                                                                                  Carrying amount
 Issuer                       amount          (in EUR million)     Coupon            Maturity         Instrument                   amount                             Coupon       Maturity
                                                                                                                                                   (in EUR million)
                           (LCY1, million)                                                                                      (LCY1, million)
innogy Finance B.V.        EUR      980            995             5.13%              Jul 18          Intercompany loan6         EUR     956            956               0.56%    Mar 19
innogy Finance B.V.        EUR     1,000          1,047            6.63%              Jan 19                                     EUR     700            700               0.86%     Oct 20
                                                                                                      Intercompany loan6
innogy Finance B.V.        EUR      750            760             1.88%              Jan 20
                                                                                                      Total                                            1,656              0.69%4
innogy Finance B.V.        GBP      570            707             6.50%              Apr 21
innogy Finance B.V.        EUR     1,000          1,161            6.50%              Aug 21
innogy Finance B.V.        GBP      500            611             5.50%              Jul 22
innogy Finance B.V.        GBP      488            599             5.63%              Dec 23
innogy Finance B.V.        EUR      800            839             3.00%              Jan 24
innogy Finance B.V.        EUR      750            745             1.00%              Apr 25         Loans from EIB
innogy Finance B.V.        EUR      850            839             1.25%              Okt 27                                       Notional
                                                                                                                                                Carrying amount
innogy Finance B.V.        EUR     1,000           985             1.50%              Jul 29          Instrument                   amount                             Coupon       Maturity
                                                                                                                                                 (in EUR million)
innogy Finance B.V.        GBP      760            955             6.25%              Jun 30                                    (LCY1, million)
innogy Finance B.V.        EUR      600            726             5.75%              Feb 33          EIB loan                   EUR     645            695               3.23%     Oct 20
innogy SE                  USD       50             41             3.80%              Apr 33                                    GBP      350            410               2.14%     Feb 23
                                                                                                      EIB loan
innogy Finance B.V.        GBP      600            642             4.75%              Jan 34
                                                                                                      Total                                            1,105              2.81%4
innogy SE                  EUR      468            512             3.50%              Oct 37
innogy Finance B.V.        GBP     1,000          1,229            6.13%              Jul 39          thereof: step-up effect                            61
innogy SE                   JPY 20,0002            179             4.76%3             Feb 40
innogy SE                  EUR      100            100             3.50%              Dec 42
innogy SE                  EUR      150            150             3.55%              Feb 43
 Total                                            13,822            4.45%4

 thereof: step-up effect                            763

Note: Rounding differences may occur. 1 Local currency. 2 Swapped in Euro: JPY20,000m in €159m. 3 Interest rate after swap in Euro. 4 Notional-weighted average coupon.
5 One additional loan of €18m not included. 6 Related to hybrids issued by RWE.
                                                                                                                                                                                             24
IR contacts                                         Verena Nicolaus-Kronenberg
                                                        T +49 152 0933 1400
                                              verena.nicolaus-kronenberg@innogy.com

                            Holger Perlwitz                                           Martin Jäger
                             Fixed Income                                             T +49 162 2754 355
                       T +49 162 2843 044                                             martin.jaeger@innogy.com
              holger.perlwitz@innogy.com

               Britta Wöhner                                                                          Sandra Schuck
        T +49 152 5460 7527                                                                           T +49 172 2982 483
britta.woehner@innogy.com                                                                             sandra.schuck@innogy.com

                                                                                                                        25
You can also read