INVESTOR PRESENTATION - FOURTHQUARTER 2016 - Kennedy Wilson
←
→
Page content transcription
If your browser does not render page correctly, please read the page content below
I N V E S T O R P R E S E N T AT I O N

     F O U RT H Q U A RT E R 2 0 1 6
         (As of December 31, 2016)
Disclaimer/Forward-Looking Statements
Statements made by us in this presentation and in other reports and statements               could limit our ability to acquire additional real estate assets; continued high levels
released by us that are not historical facts constitute “forward-looking statements”         of, or increases in, unemployment and a general slowdown in commercial activity;
within the meaning of Section 27A of the Securities Act of 1933, as amended,                 our leverage and ability to refinance existing indebtedness or incur additional
and Section 21E of the Securities Exchange Act of 1934, as amended. These for-               indebtedness; an increase in our debt service obligations; our ability to generate a
ward-looking statements are necessarily estimates reflecting the judgment of our             sufficient amount of cash from operations to satisfy working capital requirements
senior management based on our current estimates, expectations, forecasts and                and to service our existing and future indebtedness; our ability to achieve
projections and include comments that express our current opinions about trends and          improvements in operating efficiency; foreign currency fluctuations; adverse
factors that may impact future operating results. Some of the forward-looking                changes in the securities markets; our ability to retain our senior management and
statements may be identified by words like “believes”, “expects”, “anticipates”,             attract and retain qualified and experienced employees; our ability to attract new
“estimates”, “plans”, “intends”, “projects”, “indicates“, “could”, “may” and similar         user and investor clients; our ability to retain major clients and renew related
expressions. These statements are not guarantees of future performance and involve           contracts; trends in the use of large, full-service commercial real estate providers;
a number of risks, uncertainties and assumptions. Accordingly, actual results or the         changes in tax laws in the United States, Europe or Japan that reduce or eliminate
performance of Kennedy-Wilson Holdings, Inc. (the “Company”) or its subsidiaries             our deductions or other tax benefits; future acquisitions may not be available at
may differ significantly, positively or negatively, from forward-looking statements          favorable prices or with advantageous terms and conditions; and costs relating to the
made herein. Unanticipated events and circumstances are likely to occur. Factors             acquisition of assets we may acquire could be higher than anticipated. Any such
that might cause such differences include, but are not limited to, the risks that the        forward-looking statements, whether made in this report or elsewhere, should be
Company’s business strategy and plans may not receive the level of market                    considered in the context of the various disclosures made by us about our businesses
acceptance anticipated; disruptions in general economic and business conditions,             including, without limitation, the risk factors discussed in our filings with the U.S.
particularly in geographic areas where our business may be concentrated; the                 Securities and Exchange Commission (“SEC”). Except as required under the federal
continued volatility and disruption of the capital and credit markets, higher interest       securities laws and the rules and regulations of the SEC, we do not have any
rates, higher loan costs, less desirable loan terms, and a reduction in the availability     intention or obligation to update publicly any forward-looking statements, whether
of mortgage loans and mezzanine financing, all of which could increase costs and             as a result of new information, future events, change in assumptions, or otherwise.

The information with respect to the projections presented herein is based on a number of assumptions about future events and is subject to significant economic and competitive
uncertainty and other contingencies, none of which can be predicted with any certainty and some of which are beyond the company’s control. There can be no assurances that the
projections will be realized, and actual results may be higher or lower than those indicated. Neither the company nor any of their respective security holders, directors, officers,
employees, advisors or affiliates, or any representatives or affiliates of the foregoing, assumes responsibility for the accuracy of the projections presented herein.

                                                                                                                                                                                  2
3

(1)
Company Overview
Shelbourne Hotel
Global real estate investment company with complementary Dublin, Ireland
services division
Market capitalization of $2.4 billion
Investment portfolio at carrying value totals $10.9 billion:
KW has an average 42% ownership
Focus on sourcing acquisitions off-market directly from
financial institutions
30% IRR(2)(3) and 2.0x equity multiple(2)(3) to Kennedy Wilson on
its completed real estate investments since going public in 2009
$17 billion in IMRES AUM(2) encompassing 59 million square feet
under management
Merritt on 3rd
Oakland, CA
1. Information as of December 31, 2016, unless otherwise noted.
2. As defined in the “Definitions” section.
3. The IRR and equity multiple are returns to KW (including promoted interest and excluding management fees) for all real estate investments purchased and sold since becoming a listed company on the
NYSE on November 13, 2009 to date, including loans converted to real estate.
4
Q4 - 2016 Financial Highlights
Continued growth in recurring income supporting 6th consecutive dividend increase
Pro-rata property NOI Growth Quarterly Dividend Growth
Dollars in millions
5
Q4 - 2016 Financial Highlights
                                                         GROSS                                                  KENNEDY WILSON’S SHARE

                                                    Aggregate
                  Q4 2016                                                      Income              Non-income                            KW Cap          Equity
                                                   Purchase/Sale                                                   Total        NOI
              ($ in millions)                                                 Producing             Producing                             Rate (1)     Multiple (1) (2)
                                                       Price

 Acquisitions                                                   $341.3               $160.1              $2.1        $162.2      $7.8         4.9%

 Dispositions                                                     508.2                189.2             68.4         257.6      10.3         5.2%                 2.2x

 Total Transactions                                             $849.5                                               $419.8

 Adjusted EBITDA and Adjusted Net Income for Q4

$
   117                  MILLION
                        Q4 Adjusted EBITDA
                                                              $
                                                                 65             MILLION
                                                                                Q4 Adjusted Net Income

Q4: Same Property NOI and Revenue Growth
Multifamily                              Commercial
10.3% NOI                                5.7%         NOI
 8.6% Revenue                            5.5%         Revenue

                                                                                                                                                                Equinox
1. As defined in the “Definitions” section                                                                                                           (Acquired during Q4 )
2. KW Equity Multiple is based on income producing properties only and excludes dispositions by KWE.

                                                                                                                                                                          6
Investment Portfolio
Investment Portfolio
Investment Management and Real Estate Services
Summary
Appendix

Diversified Real Estate Portfolio
  Global Strategy Focused on Key Markets and Product Types

                                        GEOGRAPHY                                                                   PRODUCT TYPE
                                     (By Investment Account)                                                        (By Investment Account)

                                     2%                     1%                                                           1%
                                     Spain                  Italy                                                        Loans

                                                                                                                         10%
                                      16%                                                                                Hotels
                                      Ireland                                                                    13%
                                                                                                                 Residential         36%
                                                                                                                 & Other             Multifamily
                               14%                         67%
                                 U.K.                      Western US

                                                                                                                        40%
                                                                                                                        Commercial

Information as of December 31, 2016 and includes KWE. KW’s stake in KWE accounts for 23.6% of total portfolio.
                                                                                                                                                   8
Development Highlights
Over $1.3 Billion in Value-Add Initiatives Under Development
542,000 Construction in progress at Capital Dock, Dublin
Commercial
Square Feet
1,849
New Apartments
400 Once Completed (Projected image)
Residential Lots
1
5-Star Resort
(in design)
9Case Study: Non-stabilized Commercial
2013 2014 – 2015 2016
Acquired 100% vacant Full-scale renovation of Completion of exterior; 100% leased during Q2-2016
60,000 square foot property exterior and interior of Will represent highest per square foot rents in U.S. office portfolio
in Beverly Hills, CA building
During Construction Current
10U.S.
Property
Map
5 million
Commercial
Square Feet
21,706
Apartments
302
Residential Lots
2
Hotels
Map excludes certain investments totaling approximately 5% of total U.S. Investment account.
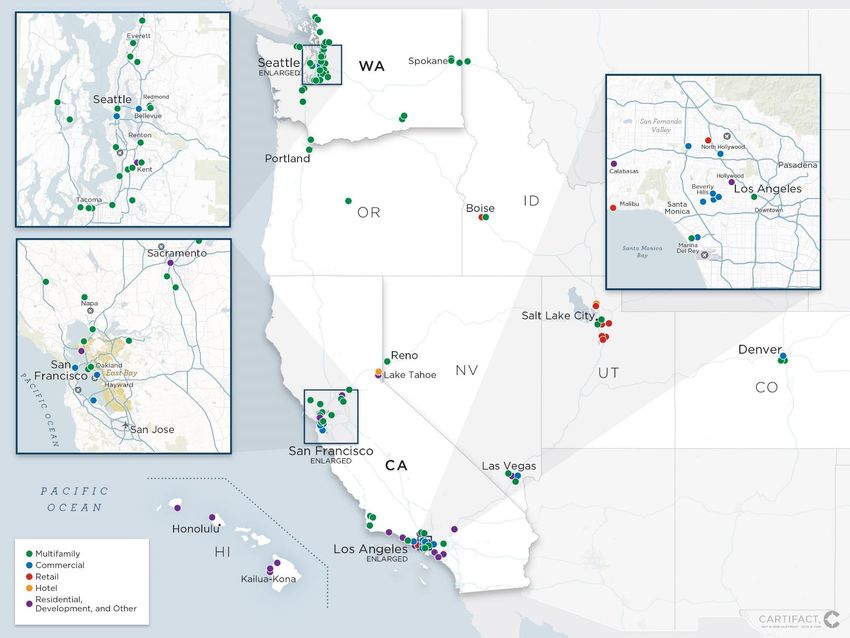
11Europe
Property
Map
13 million
Commercial
Square Feet
1,827
Apartments
3
Hotels
Map includes investments made by KWE and excludes certain investments totaling approximately 5% of total European Investment account
12Investment Management and Real Estate Services Investment Portfolio Investment Management and Real Estate Services Summary Appendix
Investment Management + Real Estate Services
Leveraging our global network of relationships
REAL ESTATE
INVESTMENT MANAGEMENT TOTAL
SERVICES
2016
Adjusted Fees $48 million $61 million $109 million
2016
IMRES EBITDA(1) $8 million $42 million $50 million
Invested Capital(2)(3)
$
4.9 Billion $1.2 $2.1
($ in billions) of Invested Capital
KW Third Party KWE $1.6
IMRES AUM(1)(2) $17 billion
Sq. Ft. Under
Management(2) 59 million sq. ft.
1. As defined in the “Definitions” section.
2. As of December 31, 2016. 14
3. Represents total investment level equity. Kennedy Wilson earns fee income on KWE and Third Party equity.Summary Investment Portfolio Investment Management and Real Estate Services Summary Appendix
Key Takeaways
Global real estate platform with regional investment teams creates a competitive advantage
and the ability to allocate capital across multiple real estate cycles
High levels of liquidity with $1.7 billion in consolidated cash and lines of credit(1)
Substantial growth in recurring cash flow
No near-term corporate maturities; 86% of debt is protected against rising interest rates
Seasoned executive team highly focused on value-creation through
asset management
strategic growth
selective investment realization
Information as of December 31, 2016
1. Includes approximately $627 million of cash and $290 million of lines of credit related to KWE
16Appendix Investment Portfolio Investment Management and Real Estate Services Summary Appendix
Components of Value
       Below are key valuation metrics as of 12/31/16 provided to assist in the calculation of a sum-of-the-parts valuation for the Company:

  INVESTMENTS                                                                                                                                                                                                                                           KW SHARE

                                                                                                                    KW Investment                    KW Ownership                                                               Est. Annualized
  Income Producing Assets                                                       Description                                                                     (2)                         Occupancy                                                               Investment Debt (4)
                                                                                                                      Account                                                                                                       NOI (3) (4)
    1         Multifamily(1)                                          25,126 units                                          $613.4                           55.8%                               93.9%                      $         147.1                     $             1,644.3

    2         Commercial(1)                                           5.5 million square feet                                309.1                           49.2%                               94.6%                                  46.2                                    388.3
                       (1)
    3         Hotels                                                  628 Hotel Rooms                                        107.3                           84.7%                                                                      16.8                                    102.8

  Unstabilized, Development, and Non-Income Producing Assets

              Commercial: Unstabilized(1)                             590K sq. ft. – Western US
    4                                                                                                                         96.4                           68.0%                               63.0%                                  N/A                                      94.6
                                                                      960K sq. ft. – Europe

                                                                      542K commercial sq. ft.
              Development – Commercial,
    5                                                                 1,849 MF units                                         129.9
              Multifamily, and Hotel (1)
                                                                      One five-star resort

                                                        (1)           19 investments, 5
    6         Loans, Residential, and Other                                                                                  260.2
                                                                      unresolved loans

                                                                                                                                                                                            NAV per Share                   Market Share per Share                    Total Shares (Millions)

                                                                      23.6% ownership in
    7         KWE                                                                                                           $445.3                           100.0%                   $          15.00                      $         11.83                                      29.8
                                                                      LSE:KWE

   INVESTMENT MANAGEMENT AND REAL ESTATE SERVICES                                                                                                                                           2016 Adj. Fees                      2016 Adj. EBITDA
                                                                       Management and promote
   8          Investment Management                                                                                                                          100.0%                   $            61.2                     $           41.6
                                                                       fees

   9          Property Services and Research                           Fees and commissions                                                                  100.0%                                47.7                                  8.1

              Total Services                                                                                                                                                          $           108.9                     $           49.7

   NET CORPORATE DEBT                                                                                                        Total

   10        KWH Corporate Debt                                        Senior Notes Payable                         $        955.0                           100.0%
                                                                       Cash, Marketable
   11        Cash and other assets                                                                                          (439.7)                          100.0%
                                                                       Securities, Hedge Asset
             Total Net Corporate Debt                                                                               $       515.3

(1) Excludes investments held by KWE.
(2) Weighted average ownership figures for income-producing/stabilized properties are based on the Company’s share of NOI and are presented on a pre-promote basis. Weighted average ownership figures for commercial unstabilized,loans, residential, and other investments are based
on the Company's investment account
(3) Please see “common definitions” for a definition of estimated annualized NOI and a description of its limitations.                                                                                                                                                                     18
(4) Based on weighted-average ownership figures held by KW.
Global Investment Portfolio Detail (1)
Includes 443 real estate investments totaling over 40 million square feet
RESIDENTIAL &
MULTIFAMILY COMMERCIAL LOANS HOTELS
OTHER
KW
Ownership(2) 55% 34% 28% 35% 78%
2% 1% 3% 4%
13% 8%
23% 25%
33% 43% 100%
Geography(3) 17% 65%
85% 67%
18%
U.S. Ireland U.K.
U.S. Ireland U.K. Japan Italy Spain U.S. Ireland U.K. U.S. U.S. Ireland U.K.
• 25,943 Units • 18.2M Sq. Ft. • $217 million of • 302 lots • 5 properties
• 139 Properties • 258 Properties Unpaid Principal • 4,155 acres • 972 rooms
Description • 21.7M Sq. Ft • 600K Sq. Ft. • 280 residential • 716 acres
• 1,849 units under under units • 1 hotel under
development development development
1. Information as of December 31, 2016. Includes investments made and held directly by Kennedy Wilson Europe Real Estate PLC (LSE:KWE). KW owns 23.6% of KWE’s total share capital as of December 31, 2016.
2. Weighted average ownership excluding promoted interest and development properties. Reflects KW’s 23.6% ownership of KWE’s total share capital as of December 31, 2016.
3. Calculated based on KW Investment Account.
19Income-Producing Multifamily and Commercial Summary
(excludes KWE)
The following summarizes Kennedy Wilson's income-producing multifamily and commercial portfolio by ownership.
Excluded below are KWE, commercial - unstabilized, loans, and residential and other investments.
MULTIFAMILY
December 31, 2016 December 31, 2015
KW Share
KW Share NOI KW Share of Est. KW Share
KW Ownership Category Units Occupancy Est. Annual Ownership (3) Units Occupancy Ownership (3)
of Debt (2) Growth Annual NOI (1) of Debt(2)
NOI (1)
~100% Owned 8,787 93.4% $99.8 $1,105.0 98.5% 30.8% 7,460 94.3% $76.3 $827.4 98.2%
~50% Owned 8,799 95.5% 36.5 395.3 45.9% (15.7)% 9,698 95.3% 43.3 428.5 49.7%
Minority Owned 7,540 92.6% 10.8 144.0 13.0% 120.4% 6,697 93.6% 4.9 57.1 6.9%
Total 25,126 93.9% $147.1 $1,644.3 56.6% 18.2% 23,855 94.5% $124.5 $1,313.0 52.8%
COMMERCIAL
December 31, 2016 December 31, 2015
KW Share
Rentable KW Share NOI Rentable KW Share of Est. KW Share
KW Ownership Category Occupancy Est. Annual Ownership (4) Occupancy Ownership (3)
Sq. Ft of Debt(3) Growth Sq. Ft Annual NOI (1) of Debt(2)
NOI (2)
~100% Owned 1.8 98.1% $27.6 $230.4 97.2% 23.2% 1.8 94.3% $22.4 $196.0 93.0%
~50% Owned 1.1 95.0% 11.5 105.2 50.4% (0.9)% 1.0 91.3% 11.6 105.6 50.5%
Minority Owned 2.6 95.8% 7.1 52.7 15.5% (39.8)% 3.7 88.3% 11.8 90.7 22.1%
Total 5.5 96.4% $46.2 $388.3 49.6% 0.9% 6.5 90.4% $45.8 $392.3 45.7%
(1) Please see “common definitions” for a definition of estimated annualized NOI and a description of its limitations.
(2) Debt represents 100% debt balance against properties.
(3) Weighted average ownership figures based on the Company’s share of NOI and are presented on a pre-promote basis.
20Kennedy Wilson Europe Real Estate PLC
(“KWE”, LSE:KWE)
(1)
Combined acquisitions since 2014 IPO exceed $4 billion
As of December 31, 2016, Kennedy Wilson owns 29.6 million shares or 23.6% of the share capital of KWE
(1)
Annualized NOI as reported by KWE of approximately £164 million ($207 million)
(2)
Weighted average unexpired lease term of 7.1 years across the property portfolios
(4)
(5)
Property portfolio occupancy of 95%
A wholly-owned subsidiary serves as KWE’s external manager, in which capacity we are entitled to receive certain
management and performance fees
(3)
Asset Mix Geography(3) SEO Portfolio
Langley, U.K.
5% 7% 6%
Loan Portfolios Spain Italy
31% 56%
Ireland
95% U.K.
Real Estate
Assets
(1) As of December 31, 2016.
(2) As of December 31, 2016. Includes property portfolio net rental income, hotel EBITDA and loan portfolio interest income. These annualized figures are not indicators of the actual results that the company
will or expects to realize in any period.
(3) All charts calculated by market value, as reported by KWE.
(4) Weighted average unexpired lease term is to first break, weighted by net rental income; excluding hotels and residential.
(5) Occupancy excluding hotels, weighted by estimated rental values (ERVs).
21Reconciliation of Net Income to Adjusted EBITDA
(Unaudited)
($ in millions) 2016 2015
Q4 Q3 Q2 Q1 Q4 Q3 Q2 Q1
Net income $ 45.2 $ 13.1 $ (2.2) $ 20.5 $ 28.3 $ 5.1 $ 29.9 $ (4.3)
Non-GAAP adjustments:
Add back (less):
Interest expense - investment 34.5 36.8 33.6 32.5 42.3 31.3 27.2 19.4
Interest expense - corporate 15.4 14.5 12.2 12.1 1.0 11.7 10.8 13.0
Kennedy Wilson's share of interest expense inluded
in unconsolidated investments 4.4 6.3 6.2 6.1 7.4 7.1 7.2 6.4
Depreciation and amortization 50.9 50.0 48.9 48.3 46.8 44.9 38.0 36.6
Kennedy Wilson's share of depreciation and
amortization included in unconsolidated investments 4.8 5.5 5.3 5.2 5.6 5.3 8.4 8.8
(Benefit from) provision for income taxes 11.9 5.5 (3.9) 0.5 20.9 4.5 36.1 (8.1)
Share-based compensation 17.3 15.6 14.7 17.5 11.2 5.5 6.8 7.3
EBITDA attributable to noncontrolling interests (67.5) (59.6) (41.3) (70.9) (41.8) (32.4) (51.6) (25.4)
Adjusted EBITDA $ 116.9 $ 87.7 $ 73.5 $ 71.8 $ 121.7 $ 83.0 $ 112.8 $ 53.7
22Reconciliation of Net Income to Adjusted Net Income
(Unaudited)
($ in millions) 2016 2015
Q4 Q3 Q2 Q1 Q4 Q3 Q2 Q1
Net income $ 45.2 $ 13.1 $ (2.2) $ 20.5 $ 28.3 $ 5.1 $ 29.9 $ (4.3)
Non-GAAP adjustments:
Add back (less):
Depreciation and amortization
Kennedy Wilson's share of depreciation and 50.9 50.0 48.9 48.3 46.8 44.9 38.0 36.6
amortization included in unconsolidated
investments 4.8 5.5 5.3 5.2 5.6 5.3 8.4 8.8
Share-based compensation 17.3 15.6 14.7 17.5 11.2 5.5 6.8 7.3
Net income attributable to the noncontrolling
interests, before depreciation and amortization (53.5) (39.3) (23.3) (53.2) (24.2) (13.8) (20.1) (17.9)
Adjusted Net Income $ 64.7 $ 44.9 $ 43.4 $ 38.3 $ 67.7 $ 47.0 $ 63.0 $ 30.5
23Adjusted Fees
(Unaudited)
($ in millions) 4Q YTD
2016 2015 2016 2015
Investment management, property services and research fees $ 12.7 $ 22.3 $ 59.4 $ 69.3
Non-GAAP adjustments:
Add back:
Fees eliminated in consolidation (1) 6.6 38.6 36.9 75.0
(2)
Kennedy Wilson's share of fees in unconsolidated service businesses 3.3 3.3 12.6 13.9
Adjusted Fees $ 22.6 $ 64.2 $ 108.9 $ 158.2
1. The three months ended December 31, 2016 and 2015 includes $4.6 million and $30.8 million, respectively, and the year ended December 31, 2016 and 2015
includes $23.1 million and $57.7 million, respectively, of fees recognized in net (income) loss attributable to noncontrolling interests relating to the portion of fees
paid by noncontrolling interest holders in KWE and equity partner investments.
2. Included in income from unconsolidated investments relating to the Company's investment in a servicing platform in
Spain.
24Investment Management and Real Estate Services EBITDA
(Unaudited)
($ in millions) 4Q YTD
2016 2015 2016 2015
Investment Management and Real Estate Services
Net Income (loss) attributable to Kennedy-Wilson Holdings Inc.
common shareholders $ 2.5 $ (2.9) $ 8.3 $ 3.8
Add back (less) (Kennedy Wilson's share):
Interest Expense 0.2 0.5 0.9 1.1
Depreciation and amortization 0.9 0.7 3.6 2.9
Fees eliminated in consolidation 6.6 38.6 36.9 75.0
Adjusted EBITDA $ 10.2 $ 36.9 $ 49.7 $ 82.8
25Definitions
Adjusted EBITDA: represents net income before interest expense, our share of interest expense included Equity Multiple: Equity multiple is calculated by dividing the amount of total distributions received by
in income from investments in unconsolidated investments, depreciation and amortization, our share of KW from an investment (including any gains, return of equity invested by KW and promoted interests) by
depreciation and amortization included in income from unconsolidated investments, loss on early the amount of total contributions invested by KW in such investment. This metric does not take into
extinguishment of corporate debt and income taxes, share-based compensation expense for the Company account management fees, organizational fees, or other similar expenses, all of which in the aggregate
and EBITDA attributable to noncontrolling interests. may be substantial and lower the overall return to KW. Equity multiples represent historical performance
and are not a guarantee of the future performance of investments.
Please also see the reconciliation to GAAP in the Company’s supplemental financial information included in
this release and also available at www.kennedywilson.com. Our management uses Adjusted EBITDA to Estimated Annualized NOI: “Estimated annualized NOI" is a property-level non-GAAP measure
analyze our business because it adjusts net income for items we believe do not accurately reflect the nature representing the estimated annualized net operating income from each property as of the date shown,
of our business going forward or that relate to non-cash compensation expense or noncontrolling interests. inclusive of rent abatements (if applicable). The calculation excludes depreciation and amortization
Such items may vary for different companies for reasons unrelated to overall operating performance. expense, and does not capture the changes in the value of ourproperties that result from use ormarket
Additionally, we believe Adjusted EBITDA is useful to investors to assist them in getting a more accurate conditions, nor the level of capital expenditures, tenant improvements, and leasing commissions
picture of our results from operations. However, Adjusted EBITDA is not a recognized measurement under necessary to maintain the operating performance of our properties. Any of the enumerated items above
GAAP and when analyzing our operating performance, readers should use Adjusted EBITDA in addition to, could have a material effect on the performance of our properties. Estimated annualized NOI is not an
and not as an alternative for, net income as determined in accordance with GAAP. Because not all indicator of the actual annual net operating income that the Company will or expects to realize in any
companies use identical calculations, our presentation of Adjusted EBITDA may not be comparable to period. Estimated annualized NOI for properties held by KWE are presented as reported by KWE.
similarly titled measures of other companies. Furthermore, Adjusted EBITDA is not intended to be a Please also see the definition of "Net operating income" below.
measure of free cash flow for our management’s discretionary use, as it does not remove all non-cash
Investment Management and Real Estate Services Assets under Management ("IMRES AUM):
items (such as acquisition-related gains) or consider certain cash requirements such as tax and debt
Generally refers to the properties and other assets with respect to which we provide
service payments. The amount shown for Adjusted EBITDA also differs from the amount calculated under
(or participate in) oversight, investment management services and other advice, and which generally
similarly titled definitions in our debt instruments, which are further adjusted to reflect certain other cash and
consist of real estate properties or loans, and investments in joint ventures. Our AUM is principally
non-cash charges and are used to determine compliance with financial covenants and our ability to engage
intended to reflect the extent of our presence in the real estate market, not the basis for determining our
in certain activities, such as incurring additional debt and making certain restricted payments.
management fees. Our AUM consists of the total estimated fair value of the real estate properties and
Adjusted Fees: Refers to Kennedy Wilson’s gross investment management, property services and other real estate related assets either owned by third parties, wholly owned by us or held by joint
research fees adjusted to include fees eliminated in consolidation and Kennedy Wilson’s ventures and other entities in which our sponsored funds or investment vehicles and client accounts
share of fees in unconsolidated service businesses. Our management uses Adjusted fees to analyze our have invested. Committed (but unfunded) capital from investors in our sponsored funds is not included
investment management and real estate services business because the measure removes required in our AUM. The estimated value of development properties is included at estimated completion cost.
eliminations under GAAP for properties in which the Company provides services but also has an
IRR: “IRR” is based on cumulative distributions to date on each investment and is the leveraged internal
ownership interest. These eliminations understate the economic value of the investment management,
rate of return on equity invested in the investment. The IRR measures the return on KW's investment in
property services and research fees and makes the Company comparable to other real estate
each asset including promoted interests, expressed as a compound rate of interest over the entire
companies that provide investment management and real estate services but do not have an ownership
investment period. This return does not take into account management fees, organizational fees, or
interest in the properties they manage. Our management believes that adjusting GAAP fees to reflect
other similar expenses, all of which in the aggregate may be substantial and lower the overall return to
these amounts eliminated in consolidation presents a more holistic measure of the scope of our
KW. IRR represents historical performance and is not a guarantee of the future performance of
investment management and real estate services business.
investments.
Adjusted Net Income: Represents net income before depreciation and amortization, our share of
KW Cap Rate: Represents the Cap Rate (as defined) weighted by the Company’s ownership interest in
depreciation and amortization included in income from unconsolidated investments, share-based
the underlying investments. Cap rates set forth in this presentation includes data only from income-
compensation and net income attributable to noncontrolling interests, before depreciation and
producing properties. We calculate cap rates based on information that is supplied to us during the
amortization. Please also see the reconciliation to GAAP in the Company’s supplemental financial
acquisition diligence process. This information is often not audited or reviewed by independent
information included in this release and also available at www.kennedywilson.com.
accountants and may be presented in a manner that is different from similar information included in our
Cap Rate: Represents the net operating income of an investment for the year preceding its acquisition or financial statements prepared in accordance with GAAP. In addition, cap rates represent historical
disposition, as applicable, divided by the purchase or sale price, as applicable. Cap rates set forth in this performance and are not a guarantee of future NOI.Properties for which a cap rate is provided may not
presentation only includes data from income-producing properties. We calculate cap rates based on continue to perform at that cap rate.
information that is supplied to us during the acquisition diligence process. This information is often not
Same Property: Refers to properties in which Kennedy Wilson has an ownership interest during the entire
audited or reviewed by independent accountants and may be presented in a manner that is different
span of both periods being compared. The same property information presented throughout this report is
from similar information included in our financial statements prepared in accordance with GAAP. In
shown on a cash basis and excludes non-recurring expenses. This analysis excludes properties that are
addition, cap rates represent historical performance and are not a guarantee of future NOI. Properties
either under development or undergoing lease up as part
for which a cap rate is provided may not continue to perform at that cap rate.
of our asset management strategy.
26151 S. EL CAMINO DR. | BEVERLY HILLS, CA 90212 | TEL: 310-887-6400 | FAX: 310-887-3410 | WWW.KENNEDYWILSON.COM
You can also read