Market Outlook and Asset Allocation - ABN AMRO Investment Solutions January 2021 - ABN AMRO Investment ...
←
→
Page content transcription
If your browser does not render page correctly, please read the page content below

ABN AMRO Investment Solutions

Market Outlook and
Asset Allocation
January 2021

This document is for information purposes only and does not constitute investment recommendation.
For professional clients only.
Market Outlook and Asset Allocation

                                                                                                          Index

                                                Page                                                                                        Page                 Economic and
                                                                           Synthesis
                                                  3                                                                                           5                  market outlook

                                                Page                       Economic                                                         Page                 Tactical asset
                                                 13                        calendar                                                          16                  allocation grid

ABN AMRO Investment Solutions: This document is for information purposes only and does not constitute investment recommendation. For professional clients only                     2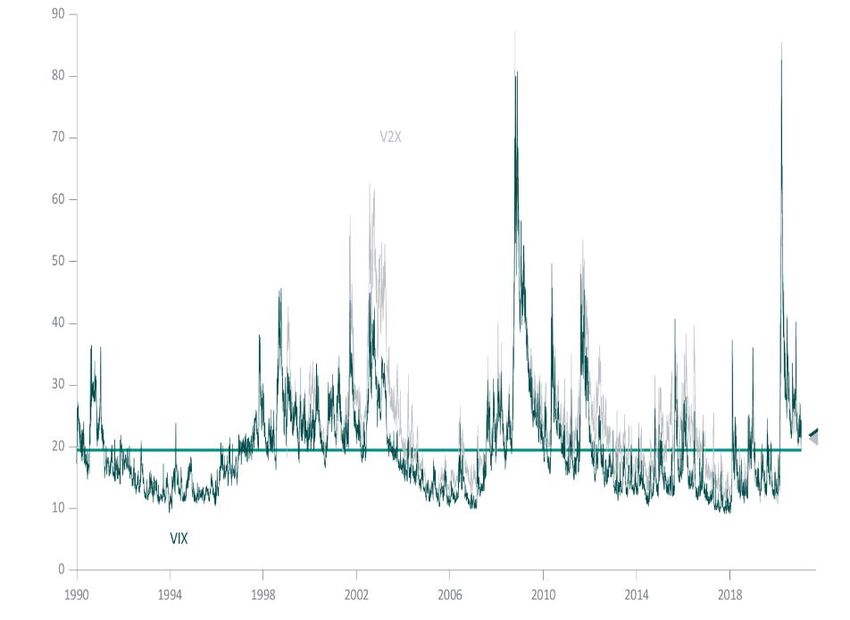
Market Outlook and Asset Allocation

Synthesis

  MACRO                                                            INFLATION                                                       CENTRAL BANKS                                          IN A NUTSHELL

                                                                   We see limited drivers of substantial inflation                                                                        Global growth continues to be
  The COVID-19 recession reduced the demand for                                                                                    Major central banks have signalled their intention
                                                                   before 2022. Certainly a large amount of money is                                                                      deteriorated due to sanatory
  services and boosted the demand for goods,                                                                                       to maintain low interest rates a long way out on
                                                                   waiting to be spend and Covid-19 could                                                                                 measures aimed at curbing
  whereas in previous recessions it was the inverse.                                                                               the yield curve. This will prevent a too strong
                                                                   accelerate the process of de-globalisation                                                                             the spread of the COVID-19.
  Unsurprisingly, recent lockdowns have negatively                                                                                 steepening of the yield curve usually observed in
                                                                   (fragility of supply chains). But low inflation is also                                                                However, the activity recover
  impacted growth. But, one of the special                                                                                         the early-stage of the business cycles. The central
                                                                   structural (demographics, digitization, etc.) and                                                                      quickly when lockdowns are
  characteristic of this crisis is the ability of growth                                                                           banks also stress the flexibility of their monetary
                                                                   the pandemic can have boost productivity.                                                                              lifted and we observe early
  to rapidly rebound when economies reopen.                                                                                        tools and policies to tolerate more inflation.
                                                                                                                                                                                          cycle        dynamics:     low
                                                                                                                                                                                          volatilities    and    positive
                                                                                                                                                                                          economic surprises.
  FINANCIAL CONDITIONS                                             RISKS                                                          TACTICAL ALLOCATIONS
                                                                                                                                                                                          The conditions remain in
                                                                                                                                                                                          favour of risky assets
  Financial conditions are supportive of risky assets.             Several risks that we are monitoring in the medium             Equities remain our preferred asset class. Equities     (equities) as interest rates are
  Volatilities are close to drop in low risk regime but            term:                                                          are one of the few asset classes that still offer       set to stay low for long and
  they will probably remain volatile in the first half of                                                                         attractive yields. We prefer to keep a neutral stance   corporate        profits     are
  the year amid vaccine logistical issues and                      -   COVID-19 spreading and lockdown measures                   on Value/Growth as stocks that underperformed the       expecting to strongly increase.
  political uncertainties. Interest rates staying at               -   COVID-19 vaccine logistic and variants                     most since the beginning of the crisis could enjoy a
  record low levels are also very favourable to risky              -   US fiscal stimulus and political uncertainties in          brighter outlook with positive news on the              The risks related to vaccine
  assets.                                                              Europe                                                     pandemic. In the early dynamic of a new business        supply        could      generate
                                                                   -   Credit defaults and increasing unemployment                cycle, we favour Small cap in Europe.                   volatility in the short term.

ABN AMRO Investment Solutions: This document is for information purposes only and does not constitute investment recommendation. For professional clients only                                                                3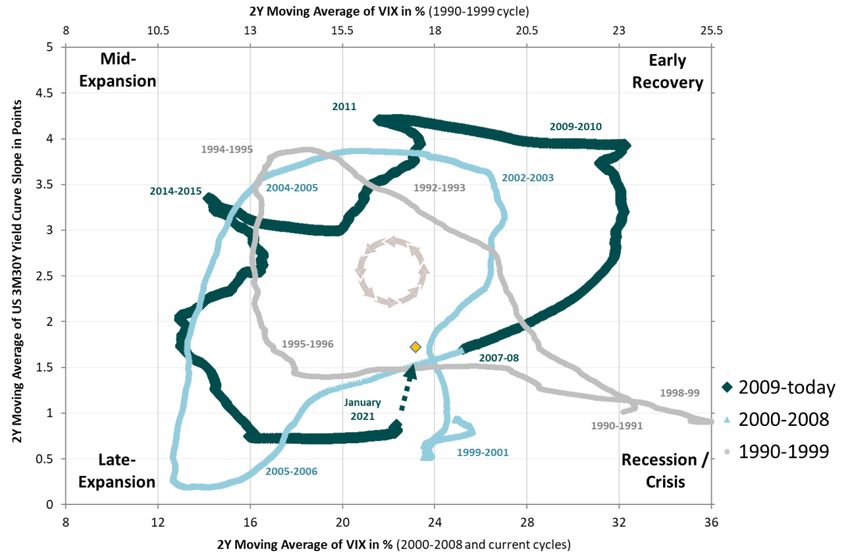
Global Investment Outlook2019

Economic and market outlook
                                   4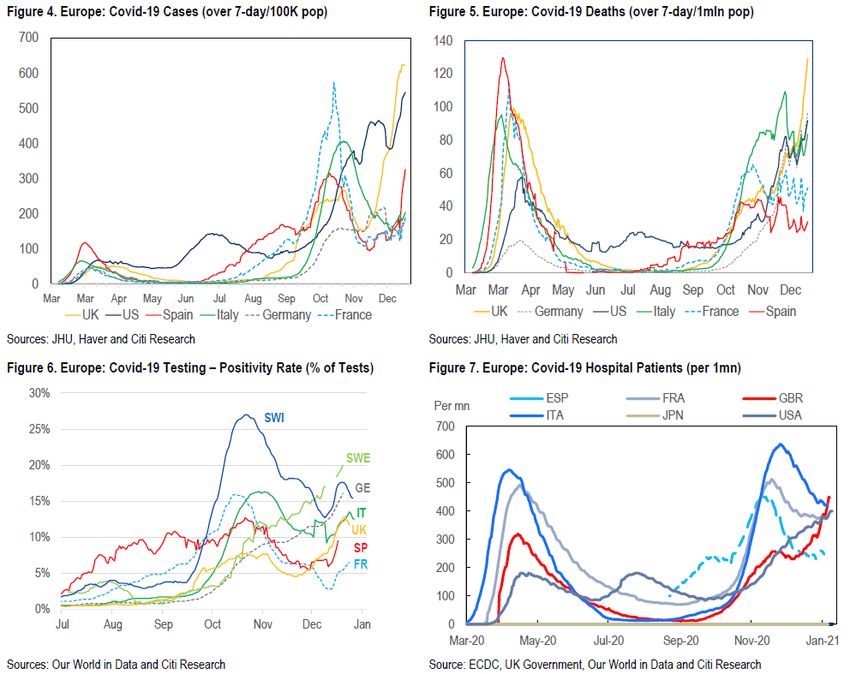
Market Outlook and Asset Allocation
COVID-19 developments
A third wave with variants and heterogenous effects across
countries:
A strong surge in new cases with some exceptions while the peak in
UK seems behind us.
The share of positive tests has been rising in most countries and the
daily death toll remains high or continues to rise.
With the exception of the UK, the weekly pace of hospitalisations for
Covid-19 patients has slowed since the autumn, but hospital occupancy
rates are still elevated.
New hospitalisations tend to be a lagging indicator relative to new
infections and test positivity rates.
Herd immunity scenarios and vaccine approvals:
1. 20%: in late February if AstraZeneca is approved, April if no more are
approved.
2. 40%: in April if AstraZeneca and Janssen/Johnson&Johnson are
approved, June if no more are approved.
3. 70%: in June if AstraZeneca, Novavax, Janssen/Johnson&Johnson
and CureVac are approved, November if no more are approved.
4. 80%: July if all vaccine candidates are approved, December if no more
are approved.
ABN AMRO Investment Solutions: This document is for information purposes only and does not constitute investment recommendation. For professional clients only 5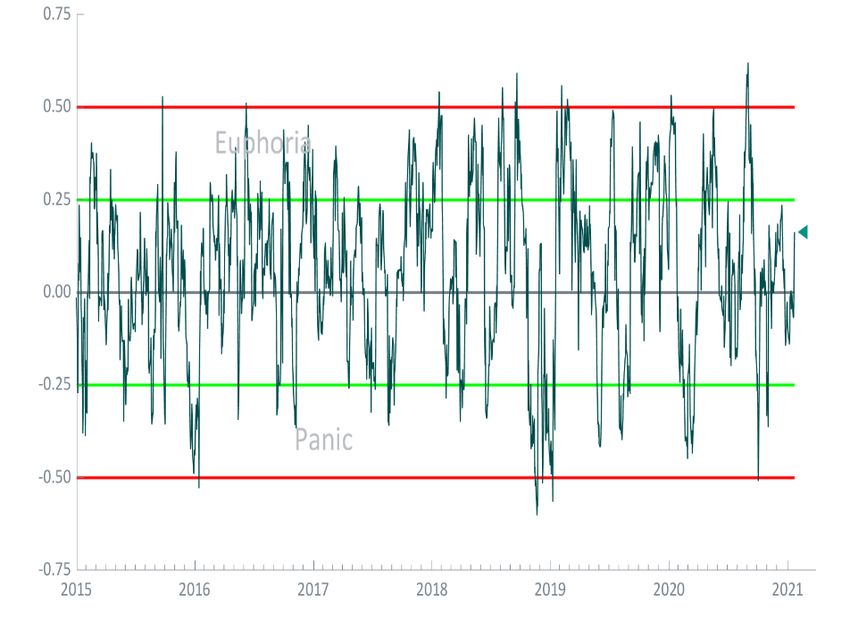
Market Outlook and Asset Allocation
Economic developments
Eurozone debt/GDP
Should we worry about eurozone indebtedness and austerity?
The Eurozone debt-to-GDP ratio has dramatically increased from 86.2%
to 95.1% between 2019Q2 and 2020Q2.
But, when corrected from the debt amount held by the ECB, which has
the ability to roll indefinitely its holdings, this ratio is slightly above the
level observed in 2000.
Due to scarcity of safe assets and unbalanced savings/investment,
interest rates remain below growth rates. It should result in a
progressively decreasing debt-to-GDP ratio without need of economic
austerity if spreads are maintained in low risk regime.
Source: Bloomberg, Eurostat, BCE, 2000Q1 to 2020Q2. ABN AMRO Investment Solutions
ABN AMRO Investment Solutions: This document is for information purposes only and does not constitute investment recommendation. For professional clients only 6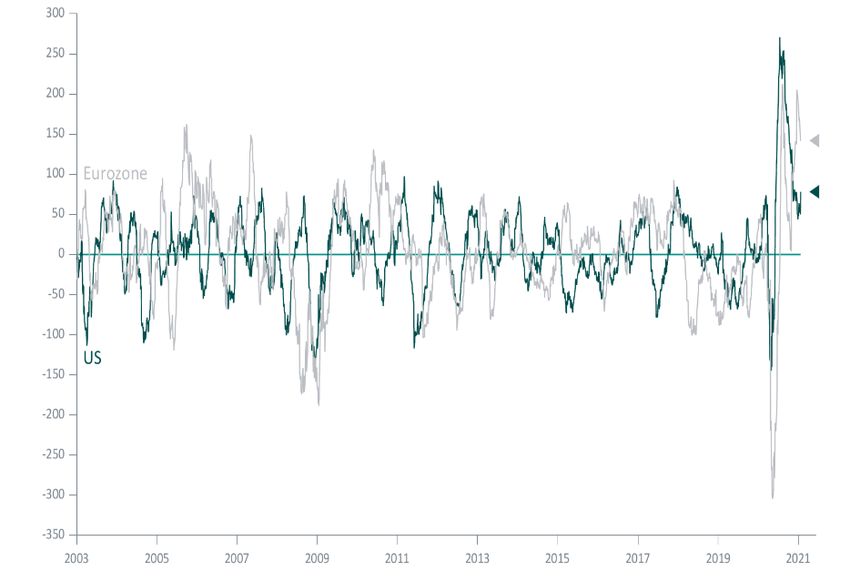
Market Outlook and Asset Allocation
Leading indicators (PMI survey)
Composite PMI in December unsurprisingly fell in contraction for most As Europe is hit with renewed lockdowns and other hard restrictions on
of European countries while they stayed above 50 in US and most of social mobility, the gap between manufacturing activity and services
Emerging countries. activity widened.
Composite Manufacturing Services
juil.-20 août-20 sept.-20 oct.-20 nov.-20 déc.-20 juil.-20 août-20 sept.-20 oct.-20 nov.-20 déc.-20 juil.-20 août-20 sept.-20 oct.-20 nov.-20 déc.-20
Global 51.1 52.5 52.5 53.3 53.1 52.7 50.6 51.8 52.4 53.0 53.8 53.8 50.7 52.0 52.0 52.9 52.2 51.8
USA 50.3 54.6 54.3 56.3 58.6 55.3 50.9 53.1 53.2 53.4 56.7 57.1 50.0 55.0 54.6 56.9 58.4 54.8
Euro area 54.9 51.9 50.4 50.0 45.3 49.1 51.8 51.7 53.7 54.8 53.8 55.2 54.7 50.5 48.0 46.9 41.7 46.4
France 57.3 51.6 48.5 47.5 40.6 49.5 52.4 49.8 51.2 51.3 49.6 51.1 57.3 51.5 47.5 46.5 38.8 49.1
Germ any 55.3 54.4 54.7 55.0 51.7 52.0 51.0 52.2 56.4 58.2 57.8 58.3 55.6 52.5 50.6 49.5 46.0 47.0
UK 57.0 59.1 56.5 52.1 49.0 50.4 53.3 55.2 54.1 53.7 55.6 57.5 56.5 58.8 56.1 51.4 47.6 49.4
Japan 44.9 45.2 46.6 48.0 48.1 48.5 45.2 47.2 47.7 48.7 49.0 50.0 45.4 45.0 46.9 47.7 47.8 47.7
Spain 52.8 48.4 44.3 44.1 41.7 48.7 53.5 49.9 50.8 52.5 49.8 51.0 51.9 47.7 42.4 41.4 39.5 48.0
Italy 52.5 49.5 50.4 49.2 42.7 43.0 51.9 53.1 53.2 53.8 51.5 52.8 51.6 47.1 48.8 46.7 39.4 39.7
Brazil 47.3 53.9 53.6 55.9 53.8 53.5 58.2 64.7 64.9 66.7 64.0 61.5 42.5 49.5 50.4 52.3 50.9 51.1
Russia 56.8 57.3 53.7 47.1 47.8 48.3 48.4 51.1 48.9 46.9 46.3 49.7 58.5 58.2 53.7 46.9 48.2 48.0
China 54.5 55.1 54.5 55.7 57.5 55.8 52.8 53.1 53.0 53.6 54.9 53.0 54.1 54.0 54.8 56.8 57.8 56.3
India 37.2 46.0 54.6 58.0 56.3 54.9 46.0 52.0 56.8 58.9 56.3 56.4 34.2 41.8 49.8 54.1 53.7 52.3
South Korea 46.9 48.5 49.8 51.2 52.9 52.9
> 50 and < 50 and
Taiw an 50.6 52.2 55.2 55.1 56.9 59.4
increasing increasing
Turkey 56.9 54.3 52.8 53.9 51.4 50.8
> 50 and decreasing < 50 and
or unchanged decreasing
Source: Bloomberg, final Markit PMI published at the beginning of each month following the survey, monthly data from 30/06/2020 to 26/01/2021. Note: The Composite Activity Index is a weighted average of
the Manufacturing Activity Index and the Services Activity Index. ABN AMRO Investment Solutions.
ABN AMRO Investment Solutions: This document is for information purposes only and does not constitute investment recommendation. For professional clients only 7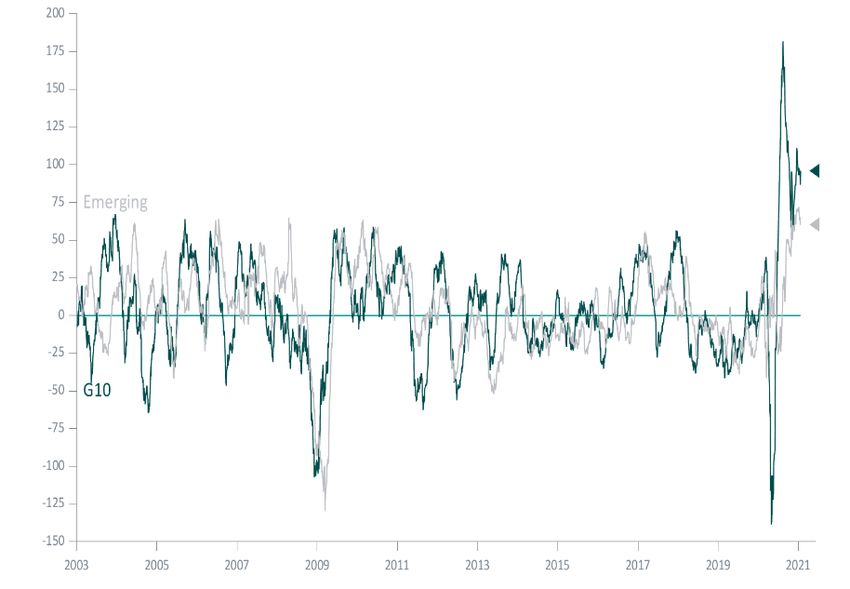
Market Outlook and Asset Allocation
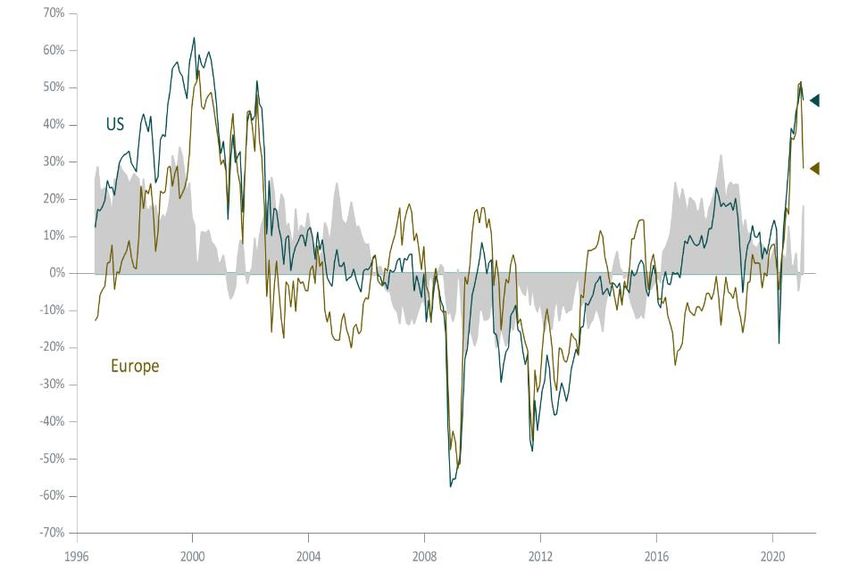
Economicsurprises
Despite the negative impact on the economy of new sanitary precautions, In Emerging countries, economic surprises are also well anchored in
economic surprises continue to stay positive in Eurozone and US. The positive territory with data even forming a J-shape recovery in China.
dynamic is extreme in this case but typical of early business cycles.
Source: Bloomberg, daily data, 01/01/2003–25/01/2021. The Macroeconomic Momentum aggregate flows of economic news on several areas. These indices are defined based on a weighted sum of economic
surprises. These surprises are defined by the difference between the published data and the median data expected from Bloomberg surveys. The indices are calculated on overlapping periods of three
months and the weights are derived from the impact of surprises on the currency market. ABN AMRO Investment Solutions.
ABN AMRO Investment Solutions: This document is for information purposes only and does not constitute investment recommendation. For professional clients only 8Market Outlook and Asset Allocation The Macro-financialclockin the US With structural shifts toward low inflation (flat Phillips Curve, digitization, globalization, shrinking worker bargaining power) and low real interest rates (demographics, capital price, excessive savings, etc.), end of business cycles are no longer characterized by inflation and monetary tightening. We have to monitor business cycle developments with new tools. Changing US financial conditions over the last three cycles have been counter-clockwise. Indeed, volatility tends to rise before a recession and ease with the recovery whilst the yield curve flattens before a recession and picks up during the recession. The end of the longest economic cycle in history was precipitated by the shutdown of the global economic activity to stem the coronavirus outbreak. Volatilities hit record high while the yield curve stayed flat, typical movements in crisis time. Now, easing volatilities and modestly steepening yield curve signal the dawn of a new business cycle. Source: Datastream, daily data from 01/01/1990 to 26/01/2021. The yellow dot represents the current conditions (spot). ABN AMRO Investment Solutions. ABN AMRO Investment Solutions: This document is for information purposes only and does not constitute investment recommendation. For professional clients only 9
Market Outlook and Asset Allocation
Market conditions (implied volatilities and risk appetite)
Equity implied volatilities are stuck above the long term average (low The Equity Risk Appetite has stayed normalized since the beginning of the
regime risk threshold). The term structure on volatilities is flat. year.
Source: Datastream, daily data, 01/01/1990-25/01/2021. The green line represents the Source: Datastream, daily data, 01/01/1990-25/01/2021. Rank correlation between equity
historical average of the VIX. ABN AMRO Investment Solutions. performance and equity risk factors. ABN AMRO Investment Solutions.
ABN AMRO Investment Solutions: This document is for information purposes only and does not constitute investment recommendation. For professional clients only 10Market Outlook and Asset Allocation
Earningsoutlookand equitymarket valuation
The upward/downward ratio (denoised) is well above one with analysts The US equity market is well above the fair value.
positively revising their earnings expectations. The index is close to a its The Europe equity market is also well above the fair value but decreasing.
second highest level. US stocks appear more expensive than European stocks.
Source: Datastream, weekly data, 01/01/2000-25/01/2021. Ratio of the 12-month earnings Source: Datastream, daily data, 01/01/1990-25/01/2021. Proprietary valuation model. The grey
revisions by the analysts (IBES): upward / downward. ABN AMRO Investment Solutions. area represents the spread between the US and the European equity valuation. ABN AMRO
Investment Solutions.
ABN AMRO Investment Solutions: This document is for information purposes only and does not constitute investment recommendation. For professional clients only 11Global Investment Outlook2019
Economic calendar
12Market Outlook and Asset Allocation
Main economic releases published last weeks
Consensus
Date Zone Event Period Actual Prior
(Median)
04-jan CH Caixin China PMI Mfg Dec 54.7 53 54.9
05-jan US ISM Manufacturing Dec 56.8 60.7 57.5
08-jan US Change in Nonfarm Payrolls Dec 50k -140k 245k
08-jan US Unemployment Rate Dec 6.80% 6.70% 6.70%
13-jan US CPI MoM Dec 0.40% 0.40% 0.20%
15-jan UK Industrial Production MoM Nov 0.50% -0.10% 1.30%
15-jan US Retail Sales Advance MoM Dec 0.00% -0.70% -1.10%
15-jan US Industrial Production MoM Dec 0.50% 1.60% 0.40%
15-jan US U. of Mich. Sentiment Jan P 79.5 79.2 80.7
18-jan CH GDP YoY 4Q 6.20% 6.50% 4.90%
18-jan CH Industrial Production YoY Dec 6.90% 7.30% 7.00%
19-jan GE ZEW Survey Current Situation Jan -68.3 -66.4 -66.5
20-jan UK CPI MoM Dec 0.20% 0.30% -0.10%
20-jan EC CPI YoY Dec F -0.30% -0.30% -0.30%
21-jan EC ECB Main Refinancing Rate janv-21 0.00% 0.00% 0.00%
21-jan US Housing Starts Dec 1560k 1669k 1547k
22-jan FR Markit France Manufacturing PMI Jan P 50.5 51.5 51.1
22-jan EC Markit Eurozone Manufacturing PMI Jan P 54.4 54.7 55.2
22-jan UK Markit UK PMI Manufacturing SA Jan P 53.6 52.9 57.5
22-jan US Markit US Manufacturing PMI Jan P 56.5 59.1 57.1
25-jan GE IFO Business Climate Jan 91.4 90.1 92.1
26-jan UK ILO Unemployment Rate 3Mths Nov 5.10% 5.00% 4.90%
26-jan US Conf. Board Consumer Confidence Jan 89 89.3 88.6
Sources : Bloomberg and AAIS from 01/01/2021 to 26/01/2021. P for Preliminary; F for Final. Red numbers indicate disappointing releases relative to the consensus.
ABN AMRO Investment Solutions: This document is for information purposes only and does not constitute investment recommendation. For professional clients only 13Market Outlook and Asset Allocation
Main economic releases to watch in the coming weeks
Consensus
Date Zone Event Period Prior
(Median)
05-jan US Change in Nonfarm Payrolls Jan 100k -140k
04-jan UK Bank of England Bank Rate Feb 4 -- 0.10%
27-jan US FOMC Rate Decision (Upper Bound) janv-27 0.25% 0.25%
10-jan UK GDP YoY 4Q P -- -8.60%
10-jan US CPI MoM Jan 0.20% 0.40%
01-jan US ISM Manufacturing Jan 60 60.7
18-jan EC CPI YoY Jan F -- -0.30%
12-jan US U. of Mich. Sentiment Feb P -- --
16-jan GE ZEW Survey Current Situation Feb -- -66.4
31-jan CH Manufacturing PMI Jan 51.5 51.9
08-feb GE Industrial Production SA MoM Dec -- 0.90%
02-feb EC GDP SA QoQ 4Q A -- 12.50%
10-feb UK Industrial Production MoM Dec -- -0.10%
17-feb US Retail Sales Advance MoM Jan -- -0.70%
01-feb CH Caixin China PMI Mfg Jan 52.6 53
17-feb UK CPI Core YoY Jan -- 1.40%
17-feb US Industrial Production MoM Jan -- 1.60%
19-feb EC Markit Eurozone Manufacturing PMI Feb P -- --
19-feb UK Markit UK PMI Manufacturing SA Feb P -- --
19-feb US Markit US Manufacturing PMI Feb P -- --
02-feb EC GDP SA YoY 4Q A -- -4.30%
05-feb US Unemployment Rate Jan 6.70% 6.70%
18-feb US Housing Starts Jan -- 1669k
29-feb US Personal Spending Dec -0.40% -0.40%
Sources : Bloomberg and AAIS from 27/01/2021 to 20/02/2021. P for Preliminary; F for Final.
ABN AMRO Investment Solutions: This document is for information purposes only and does not constitute investment recommendation. For professional clients only 14Global Investment Outlook2019
Tactical allocation grids
15Market Outlook and Asset Allocation 16
Our tactical allocation on equities: January 2021
Equities remain our preferred asset class. Equities Asset Classes in local currencies Negative Neutral Positive
are one of the few asset classes that still offer
attractive yields with High Return Debt and Emerging Equities (World)
Debt.
Europe
Despite long term positive trend for growth stocks Small vs Large
(strong fundamentals, digitization, low interest rates,
ESG appetite, etc.) and fragility in Energy and Gowth vs Value ◼
Financials sectors, we prefer to keep a neutral stance
on Value/Growth as stocks that underperformed the US
most since the beginning of the crisis could enjoy a
brighter outlook with positive news on the pandemic. Small vs Large ◼
Gowth vs Value ◼
In the early dynamic of a new business cycle, we
favour Small cap in Europe amid favourable Japan ◼
momentum and attractive risk premia.
Asia Pacific ex. Japan
There are still some uncertainties surrounding
Emerging Asia
Emerging countries in how well they manage to
contain the virus. Nonetheless, the dollar weakness Latin America
and economic resiliency are positive factors.
Note: Max Negative; ◼ Neutre; Max Positive; Upgrade; Downgrade
ABN AMRO Investment Solutions: This document is for information purposes only and does not constitute investment recommendation. For professional clients only – January 2021 16Market Outlook and Asset Allocation 17
Our tactical allocation on fixed income/absolute return: January 2021
We continue to believe that the fixed income market is Relative duration
frozen (scarcity of debt) and current spreads do not Asset Classes in local currencies Negative Neutral Positive
(years)
really reflect default risks forward. We observe a mix Cash/ Absolute Return
of early and late cycle characteristics: defaults to
Fixed Income
come while spreads are low.
Euro ◼ -2,5
On one hand, interest rates touched low levels in GOV core ◼
developed market (e.g. Portugal 10Y rate) and despite GOV periph. ◼
the recent increase in US 10Y rate, the ultra-
accommodative ton of central banks should prevent a IG
too strong steepening of the yield curve usually HY ◼
observed in the early-stage of the business cycles. US -3
GOV ◼
On the other hand, Emerging debt, especially in local
IG ◼
currency, seems strongly discounted and offers a
significant risk premium. HY ◼
EM Debt (hard ccy) ◼
EM Debt (local ccy)
Conv. Europe ◼
Conv. Global ◼
Note: Max Negative; ◼ Neutral; Max Positive; Upgrade; Downgrade
ABN AMRO Investment Solutions: This document is for information purposes only and does not constitute investment recommendation. For professional clients only – January 2021 17Market Outlook and Asset Allocation
Disclaimer
ABN AMRO Investment Solutions - AAIS
Limited company with Executive and Supervisory Board capital of 4,324,048 Euros
registered with the RCS Paris under number 410 204 390,
Head office: 3, avenue Hoche, 75008 Paris, France,
Approved by the AMF, dated 20/09/1999,
as a portfolio management company under registration number GP99-27
This promotional document prepared by ABN AMRO Investment Solutions (“AAIS”) does not constitute a solicitation to buy, an offer to sell or legal or tax advice. On no account does it constitute a personalised recommendation or investment advice. Before making any
investment decision, the investor is responsible for assessing its risks and for ensuring that the decision is consistent with his objectives, his experience and his financial circumstances.
The investor’s attention is drawn to the fact that information on the products featured in this document is no substitute for the completeness of the information contained in the fund’s legal documentation that you have been given and/or that is available free of charge on
request from AAIS or on the website www.abnamroinvestmentsolution.com
Before making any investment, the investor must pay particular attention to the risk factors and carry out his own analysis that takes into account the need to diversify investments. All investors are encouraged to take advice on this matter from their regular legal, tax,
financial and/or accounting advisors before making any investment.
The information and opinions contained in this document are for general information only. They are taken from sources that AAIS considers trustworthy, but no guarantee can be given as to their accuracy, reliability, validity or completeness. Past performance is not a
guide to the future performance of the fund and/or the financial instruments and/or the financial strategy described therein. Performance data do not take into account any commissions paid on the subscription or acquisition of financial instruments. No guarantee can be
given that the described products will achieve their objectives. Investing in financial instruments carries risks and investors may get back less than the amount of their investment. When a financial investment is denominated in a currency other than your own, the
exchange rate may have an impact on the amount of your investment. The tax treatment differs according to each client’s particular circumstances. It is therefore strongly recommended that, before investing, you take advice on the appropriateness of the investment to
your objectives and your legal and tax circumstances.
It is your responsibility to ensure that the regulations to which you are subject, depending on your status and your country of residence, do not prevent you from investing in the products or services described in this document. Access to products and services may be
restricted for certain persons or in certain countries. For additional information, you should contact your regular advisor.
Complaints may be sent free of charge to the AAIS customer service department using the following email address: aais.contact@fr.abnamro.com
This document is intended only for its original addressees and may not be used for anything other than its original purpose. It may not be reproduced or distributed, in whole or part, without the prior written consent of AAIS and AAIS shall not be held responsible for any
use made of the document by a third party.
The names, logos or slogans identifying AAIS’s products or services are the exclusive property of AAIS and may not be used for any purpose whatsoever without the prior written consent of AAIS.
18Market Outlook and Asset Allocation
19You can also read