State of the Seafood Industry Looking to 2021 - John Sackton Seafood Datasearch Fisheries Council of Canada Ottawa October 2020 - The Future ...
←
→
Page content transcription
If your browser does not render page correctly, please read the page content below
State of the Seafood
Industry Looking to 2021
             John Sackton
          Seafood Datasearch
      Fisheries Council of Canada
                Ottawa
             October 2020

                                    1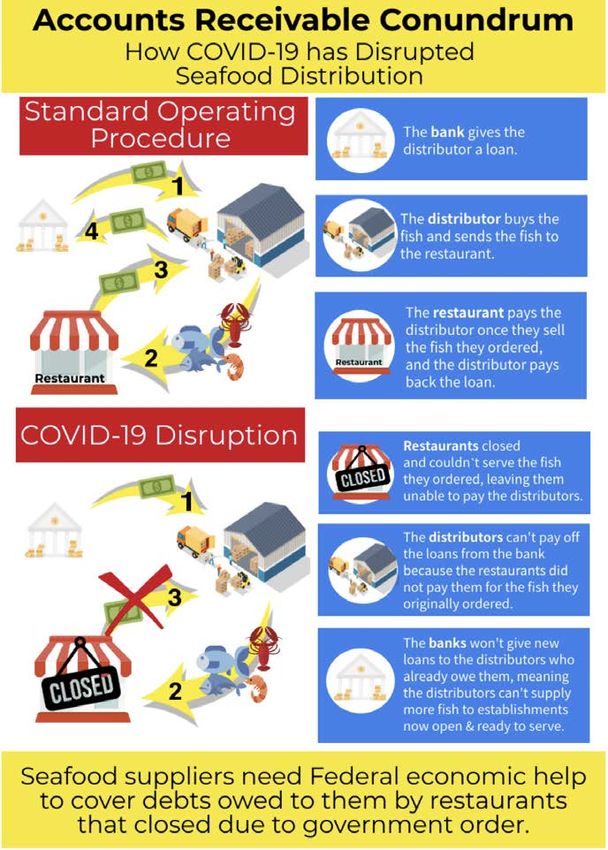
•
                      Background
    40+ Years in Seafood Industry
•   Crab, shrimp, lobster and cod market
    analyst since 1997
•   Price and market outlooks for Atlantic
    Canada, Alaska, and US West Coast
•   2005-2018 Price arbitrator for Alaska crab
•   Expert on Mussel and Oyster Markets
•   Co-Founder of NFI’s Global Seafood Market
    Conference
•   Annual Market Review for Fisheries Council
    of Canada
•   Founder of Seafood.com News and
    Seafood Datasearch

                                                 2
Covid Disruption has replaced Trade
         War for Seafood Industry
•   Last year we focused on trade issues, especially the
    benefits to Canada of the US trade war with China.
•   This year Canada’s Seafood Industry has been very
    resilient in face of Covid-19
•   Diversification of Markets in lobster has been key
    driver
•   However US remains largest market by volume
•   US is on a knife edge, with potential for lower
    purchases from Canada
•   Foodservice and Retail Sales have seen major changes
•   Our Market Review for Major Species will include
      –    Lobster
      –    Snow Crab
      –    Salmon
      –    Cold Water Shrimp
      –    Others: scallops, cod, mussels and oysters, etc.

                                                              3
Review of this spring
•   Early fears of harvest disruptions did   •   Canada managed to complete
    not materialize
                                                 spring crab and lobster seasons
      – Vessels able to fish
      – No widespread plant shutdowns
                                             •   Seafood has been the food most
•   Adaptation to foodservice shutdown           ‘missed’ with restaurant
    has been dramatic at both wholesale          shutdowns.
    and consumer level leading to surge in   •   Seafood Suppliers/Producers
    retail seafood
                                                 received nearly $1 billion in PPP
•   The US PPP program and federal               funds.
    income support through July has been
    critical in maintaining consumer         •   Seafood demand, helped by
    spending and company survival                income support, has led to
                                                 shortages and price spikes for
                                                 some items

                                                                         4
Lobster and Crab had real
                           growth in 2019
                                                 Major Seafood Export Commodities
      2,500,000,000

                                                         2019
      2,000,000,000

                                                                             YTD Comparison 2019/20
      1,500,000,000
$CA

      1,000,000,000

       500,000,000

                 0
                                lobster                           crab                        shrimp      salmon (incl wild)

                                          2015    2016     2017      2018   2019   YTD 2019    YTD 2020

      Source: Canadian customs data       Salmon and shrimp were slightly lower
                                          Comparing YTD July 2020 with YTD 2019, lobster and crab
                                          had lower value, but not shrimp and salmon

                                                                                                                    5
Canada is still heavily tied to US Market
                                  More so in first half of 2020
                                            Total Canadian Seafood Exports
            $4,500,000                                                                      70%

                                                                                      65%
            $4,000,000               63%      63%
                                                           60%      59%
                            61%                                                             60%
                                                                             59%

            $3,500,000

                                                                                            50%
                                                                                                        US
            $3,000,000
                                                                                                        China (incl vietnam, HK)
                                                                                                        EU
                                                                                            40%
            $2,500,000                                                                                  Other Asia
$CA 000’s

                                                                                                        Other
                                                                                                        US percent
            $2,000,000
                                                                                            30%
                                                                                                        China percent
                                                                                                        EU percent
            $1,500,000                                                                                  Other Asia percent
                                                                                            20%         Other percent

            $1,000,000

                                                                                                  Source: Intracen customs data
                                                                                            10%
             $500,000

                   $0                                                                       0%
                         2014     2015     2016     2017         2018     2019     2020

                                                                                                                6
US is dominant market for snow crab
and fzn lobster; Less so for live lobster

        Snow crab                Fzn Lobster

        Live Lobster            Fresh salmon

                                      7
Coldwater shrimp by Qtr
                      Shell on offshore

 Q2 similar to 2019

                            Cooked and peeled
                                          Q2 far below 2019

                                                              8
China is first major country to recover
    economically from pandemic

• China’s September
  purchasing manager
  Index was 51.5,
  60%Higher than the
  Consensus forecast
• China is the only
  major economy
  expected to post GDP
  growth this year

                                    9
Despite
seafood
Canada’s
improving
market, and
industry still
this increased
diversification,
depends on US
Canada’s 2nd most
China has become
in 1st half 2020.
Ex
po $USD 000’s
important seafood partner
Ex rted
po v
a
Ex rted l ue
po v i n
a
$200,000
$400,000
$600,000
$800,000
$1,000,000
$1,200,000
$1,400,000
$0
Ex rted l ue 20
US
po v i n 15
a -
Japan
Ex rted l ue 20 Q3
po v i n 5 1
a -
US Percent
Ex rted l ue 20 Q4
po v i n 16
a -
Ex rted l ue 20 Q1
po v i n 16
a -
Ex rted l ue 20 Q2
po v i n 16
a -
Ex rted l ue 20 Q3
po v i n 16
a -
Ex rted l ue 20 Q4
po v i n 17
a -
Ex rted l ue 20 Q1
po v i n 17
a -
Ex rted l ue 20 Q2
po v i n 17
a -
Ex rted l ue 20 Q3
Other Asia po v i n 17
a -
Ex rted l ue 20 Q4
po v i n 18
a -
Ex rted l ue 20 Q1
po v i n 18
a -
Ex rted l ue 20 Q2
po v i n 18
a -
China (Incl HK & Vietnam)
Ex rted l ue 20 Q3
po v i n 18
a -
Ex rted l ue 20 Q4
po v i n 19
a -
Ex rted l ue 20 Q1
Other
po v i n 19
a -
Europe
Ex rted l ue 20 Q2
po v i n 19
rt al u 2 -Q3
ed e 01
v a i n 9-
l u 20 Q4
ei 2
n 0-Q
20 1
10
20
-Q
2
0%
10%
20%
30%
40%
50%
60%
70%
80%Canada is dominant Snapshot of Canada's Exports to China in 2019
exporter to china for 1200000 120%
lobster and fzn coldwater
shrimp
1000000 100%
Market share for major exports:
Lobster 72% 800000 80%
Fzn Lobster 100%
Coldwater shrimp 45%
$CA 000's
600000 60%
Frozen Crabs 39%
Live Crab (Dungeness) 15%
Hake 55% 400000 40%
200000 20%
0 0%
en
p
ke
r
s)
ve
n
ut
he
Fz
im
es
l ib
Ha
Li
oz
Ot
r
r
en
Fr
Ha
r
Sh
te
te
ng
bs
ab
bs
er
t&
Du
Lo
at
Lo
Cr
bo
e(
w
r
ld
l iv
Tu
Co
ab
Cr
CA Exp China Imp Canada Market Share
11Questions for today
• Is impact of covid-19 different than other
seafood supply impacts in the last 10
years
• If so, what is the difference
• Are some markets for specific species
reacting differently than others
• What dynamic will drive sales in 2021
12Pandemic has hit different
sectors unevenly
• 70% of US Seafood dollar
sales are at Foodservice
• Shut down of foodservice
sector has had huge
impact
• But impact was initially
mitigated
• Next few months critical
in determining extent of
long-term damage
13US restaurant performance lags
Germany and Canada
Seated Diners Since August 1st
40
Percent Change in Seated Diners Year over Year
20
0
ug
ug
ug
ug
ug
ug
ug
ug
ug
ug
ug
g
g
g
g
g
p
p
p
p
Au
Au
Au
Au
Au
Se
Se
Se
Se
-A
-A
-A
-A
-A
-A
-A
-A
-A
-A
-A
2-
4-
6-
8-
1-
3-
5-
7-
9-
11
13
15
17
19
21
23
25
27
29
31
-20
-40
-60
-80
Canada German y United States
Linear (Canada) Linear (Germany) Linear (United States)
14Seafood Distribution
is not out of the
woods
$2.2 Billion in uncollected
debt
Recent Congressional testimony
from Slade Gorton:
• Lost 70% of their business
• Huge problem with bad debt;
restaurants can’t pay for what
they ordered last spring
• Nationally $2.2 billion in bad
debt is overhanging seafood
distributors
• Bank Lending secured by
inventory is freezing up as
inventories get smaller
15Industry got reprieve from retail
seafood
IRI Weekly Retail Data: Seafood,
Meat, Deli Meat
100=no change YOY
180
170 Seafood
160
150
140
130 Meat
120
110 Deli Meat
100
20
20
20
0
0
0
0
0
0
0
0
0
/2
/2
/2
/2
/2
/2
/2
/2
/2
5/
2/
9/
14
21
28
12
19
26
16
23
30
7/
8/
8/
6/
6/
6/
7/
7/
7/
8/
8/
8/
deli Meat Meat Seafood
16Frozen category very strong at retail
IRI Weekly Retail Data: Frozen,
General Food, Refrigerated
100=no change YOY
135
130
125
120
115
110
105
100
20
20
20
0
0
0
0
0
0
0
0
0
/2
/2
/2
/2
/2
/2
/2
/2
/2
5/
2/
9/
14
21
28
12
19
26
16
23
30
7/
8/
8/
6/
6/
6/
7/
7/
7/
8/
8/
8/
Frozen General Food Refrigerated
17Three trends helping seafood
consumption
• Big Increase in home
cooking
• Big increase in use of
frozen food
• Continued emphasis
on health during
pandemic
Data from informal survey of changes in seafood consumption
by SeafoodNews
18Survey shows increased retail buying,
buying from home delivery service
19US small business revenue makes up
45% of GDP: it has not recovered
20Restaurant traffic recovery is
stalling as summer ends
Open Table Restaurant visits
20
0
1-Jun 8-Jun 15-Jun 22-Jun 29-Jun 6-Jul 13-Jul 20-Jul 27-Jul 3-Aug 10-Aug 17-Aug 24-Aug 31-Aug 7-Sep 14-Sep 21-Sep
-20
-40
-60
-80
-100
US Caanda 5 per. Mov. Avg. (US) 5 per. Mov. Avg. (Caanda)
21Spending growth stalled as
stimulus programs ended
Consumer spending stalls Personal income falls
Change in real disposable income
20.00
15.00
Monthly Change in Personal Income
10.00
5.00
0.00
Jan. Feb. March April r May r June r July r Aug. p
-5.00
-10.00
22Economic factors are key
risk for fall and first half of Beginning of recovery boosted
next year optimism for seafood
The US economy remains on a
•
knife edge, with a serious risk of distributors
extreme disruption from a
contested election.
• Consumer confidence and
spending will rebound or contract With recovery stalled, risk is now
based on election results.
• Moody’s and other analysis says
that temporary loss of restaurant
that a Biden win and a democratic and foodservice business may
senate would provide a huge
boost to the Economy. become permanent
• 18.6 million jobs projected over 4
years
• unemployment of just over 4%,
by the second half of 2022 Changes in seafood buying
• average household’s real after-
tax income increases by
patterns helped by maintenance
approximately $4,800
of income levels – which now is
at risk
23We are not out of the woods
• Looking only at strong fish
price data suggests a
normal recovery
• But huge debt burden
could derail purchasing if
it is not addressed
• Summer recovery based
on stimulus
• In August personal • 25% of US restaurants
expected to close
income fell after • Virus surge is also causing
improving in June and July instability and low traffic for
• Without new stimulus fall those that remain open
and winter could be bleak
24Diversification in export markets away from
US remains key for Canadian Seafood
• Many specialty export markets already
exist for shrimp, turbot, yellowtail etc.
• For live lobster, Chinese volumes impact
US price, even while Chinese export price
remains constant.
• European markets and Korea still are
developing, but at much lower volumes
25China’s demand is key for lobster pricing, even in
US
Periods of high volume in China, at stable prices, are
followed by higher prices in US
$30.00 80.0% United States of
America
70.0% China
$25.00
60.0% United States of
Percent of total lobster exports
America
$20.00
50.0% China
$CA Kg
$15.00 40.0% Korea, Republic of
30.0% France
$10.00
20.0% Spain
$5.00
3 per. Mov. Avg.
10.0%
(United States of
America)
3 per. Mov. Avg.
$0.00 0.0%
(C hina)
18
1/ 8
11 19
12 19
1/ 9
2/ 9
3/ 9
4/ 9
5/ 9
6/ 9
7/ 9
8/ 9
9/ 9
10 19
2/ 0
3/ 0
4/ 0
5/ 0
6/ 0
20
1
/1
1
1
1
1
1
1
1
1
2
2
2
2
2
/
/
/
/
1/
1/
1/
1/
1/
1/
1/
1/
1/
1/
1/
1/
1/
1/
1/
/1
/1
/1
/1
/1
11
12
26Recovery in smaller markets will
help seafood exporters
• Besides China, recovery in Europe, Japan and
Korea will help exporters on the margin.
• However, except for China, these markets are
not large enough to offset the impact of the US.
• Salmon and crab are both much more
concentrated in the US market, leading to a
different dynamic in price volatility.
• On salmon, both whole fish, fillets, and frozen
fillets go 99% to the US.
27Pandemic is likely to increase Canadian
dependence on US market in short term
• Air capacity and
travel issues
have distorted
trade flows
• Asia cargo routes
have recovered
more due to
ecommerce
boom
• Europe N.
America routes
far down
28Species review
• Lobster
• Snow crab
• Shrimp
• Salmon
• Other
29Live lobster pricing
2019
2018
2017
2020
30Price of live lobster compared to
fzn lobster tail
Vs 4 oz fzn lobster tail
Live Fzn 4 oz
Lobster lobster
$US per tail
Lb $US per
Lb
june
june june
june
312020 Prices supported by lower
landings
LFA landings trending down Canadian shipments to the
Lobster landings by region US were down in 2nd qtr.
180000
160000
140000
120000
100000
80000
60000
40000
20000
0
2010 2011 2012 2013 2014 2015 2016 2017 2018 2019p Widespread reports of lower
NL QB Gulf Maritimes US
landings in Maine
32Strong demand for frozen lobster has increased
Canadian processor purchases from US
US lobster exports YTD July
14,000,000
12,000,000
10,000,000
8,000,000
6,000,000
4,000,000
2,000,000
0
Canada China HK
2018 2019 2020
33Lobster and Crab Mostly eaten
in restaurants
90.00%
80.00%
70.00%
60.00%
50.00%
40.00%
30.00%
20.00%
10.00%
0.00%
Shrimp Salmon Crab Lobster Whitefish (cod, Swordfish Clams or Oysters Flounder
haddock, tilapia,
catfish
restaurant home
Data from informal survey of changes in seafood consumption by SeafoodNews
34But crab and lobster had biggest
retail sales gains
80.0%
70.0%
60.0%
50.0%
40.0%
30.0%
20.0%
10.0%
0.0%
Crab Lobster Shrimp Salmon
35Pandemic impacted live lobster
buying
• Fear of lack of markets let to low prices in
Spring
• Heavy demand at retail seafood led to
more sales, especially on crab and lobster
• Frozen lobster saw increased interest
from foodservice that was open
• Heavy local tourism along the East Coast
supported outdoor dining for lobster
36Current situation
• Right now live prices are higher than
processors comfortable with
• Processors reluctant to raise prices, but
shortages and demand is pushing prices
higher
• These trends could support strong
holiday sales for lobster if export markets
in China and Europe are healthier than
the US
37Snow crab is at historically high
prices
38After an initial drop of 20% below prior
year, prices recovered sharply
This is a success story, not a story
of a missed pricing opportunity
39Retail performance of crab very
strong in 2019
40Snow crab at foodservice
41Trend in Snow Crab usage
US Snow Crab Imports and Price
120,000,000 $10.00
$9.00
100,000,000
$8.00 • US now dominant market
$7.00
80,000,000
$6.00
• Usage expands even at
60,000,000 $5.00
higher prices
$4.00
40,000,000
$3.00
20,000,000
$2.00 • Japanese usage is declining
$1.00
0 $0.00
2015 2016 2017 2018 2019
volume Avg Price 5-8 NL Snow Crab Imports (Live Crab to Japan
converted to Fzn Sections)
70000
60000
50000
Metric tons
40000
30000
20000
10000
0
01
02
03
04
05
06
07
08
09
10
11
12
13
14
15
16
17
20
20
20
20
20
20
20
20
20
20
20
20
20
20
20
20
20
Japan US
42Recent prices are now above last
year, but stable
Snow crab is oversold, leading to heavy demand for
Russian imports
43US Snow crab supply increased
in 2019
US Snow Crab Supply
80000
70000
60000
Metric Tons Section Wgt
50000
40000
30000
20000
10000
0
2010 2011 2012 2013 2014 2015 2016 2017 2018 2019
-10000
-20000
Alaska Canada Russia Norway Greenland/latvia Other US Exports
44YTD July 2020 shows surge in US snow crab
imports from Canada and Russia
100,000,000
90,000,000
80,000,000
70,000,000
60,000,000
50,000,000
40,000,000
30,000,000
20,000,000
10,000,000
0
2017 2018 2019 2020
Canada Russia Norway Greenland
45Snow crab outlook
• US demand remains very
strong, with high prices and
product shortages likely until
next spring
• Spring price adjustment will
depend on US economic
situation
• Japanese usage will follow US
pricing, will not set the
market
• Alaska outlook is for stability
rather than significant
increase; no new survey this
summer
46Salmon pricing has been volatile
• Salmon volumes at retail have
been strong, but impacted by
transportation problems from
Chile and Norway
• Canadian whole fish exports
have suffered due to the
collapse of foodservice
demand
• But Canadian market share
has increased
47The two price spikes since May were related
to transport and production issues
48Canadian whole fish has gained
market share from Norway, UK
49Whole fish pricing declined
more than fillet pricing
50Outlook for salmon
• Fresh whole fish mostly used in
foodservice, is still under
pressure with light demand
• Trucker strike in Chile pushed
markets up at end of August
• Now Northeast whole fish is
trading above its three year
averages, and seasonally this is a
period of increasing prices.
• Air cargo space continues to be a
problem for European shippers,
with European imports now the
lowest since 2016.
51Both UK and Danish prices down
on coldwater shrimp
UK 100-150 / GBP DK 175-275 / DKK
52US prices down also
• West Coast shore
prices average $0.50
per lb
• Canadian summer
prices are $CA 1.08
landed at plant
53Coldwater shrimp hit by lack of
foodservice sales
• UK and US prices all Iceland double fzn to UK
hit by lack of
foodservice sales.
• Continuation of trend
of lower prices that
predates pandemic
54Brexit is now posing new risk of
disruption in shrimp market
• A no-deal Brexit would remove the UK
from the CETA
• Tariffs could snap back to WTO levels
until some new agreement is reached
between Canada and the UK
• Economic impacts of no deal Brexit on
top of Covid may keep the UK in a period
of economic decline.
55In general, fresh fish markets
have been hit more than frozen
• Canadian halibut is
2,500,000 $9.00
$8.00
experiencing lower
2,000,000 $7.00
$6.00
fresh fish demand
1,500,000
$5.00
$4.00
1,000,000
• Where supplies have500,000
$3.00
$2.00
been reduced prices 0
$1.00
$0.00
have held up better
r
r
ay
ri l
ne
ry
st
r
ry
r
ly
ch
be
be
be
be
Ju
gu
ua
Ap
a
ar
M
Ju
m
nu
m
to
em
Au
M
br
Oc
ce
ve
Ja
pt
Fe
De
No
Se
2018 2019 2020 $/lb $/lb $/lb
56Scallop prices responding to
cutback in supply
• 2020 fishing year
will result in a 17%
reduction in US
landings
• Pace of actual
landings and imports
has been lower due
to fears of low prices
57Low prices at start of new fishing season have
recovered on low volumes
CA 10-20 IQF
US domestic 10-20 dry and all natural
58Haddock
Haddock whole fish
volumes not significant in Fresh fillet volumes down
spring significantly
800,000 $1.60 400,000 $4.00
700,000 $1.40 350,000 $3.50
600,000 $1.20 300,000 $3.00
500,000 $1.00 250,000 $2.50
400,000 $0.80 200,000 $2.00
150,000 $1.50
300,000 $0.60
100,000 $1.00
200,000 $0.40
50,000 $0.50
100,000 $0.20
0 $0.00
0 $0.00
r
ne
ce r
ry
ay
pt st
ve r
ri l
Oc er
Au y
Fe a ry
ch
No be
be
De b e
l
Ju
u
b
ua
Ap
ar
M
Ju
r
ce r
ay
pt st
ri l
ne
Oc er
ry
ve r
Fe a ry
Au y
ch
g
m
to
nu
m
em
No obe
be
De b e
l
M
Se gu
Ju
br
b
ua
Ap
ar
M
Ju
Ja
m
nu
m
em
M
t
br
Ja
Se
2018 2019 2020 $/lb $/lb $/lb
2018 2019 2020 $/lb $/lb $/lb
59Oyster pricing is not changed,
but volume has collapsed
• YTD farmed oyster 700,000 $5.00
volume to the US is 600,000
$4.50
down 45% 500,000
$4.00
400,000
$3.50
300,000
$3.00
200,000
$2.50
100,000
0 $2.00
r
ri l
ne
De b e r
ry
ay
t
No ber
Fe ry
Oc r
ly
ch
Se gus
be
be
Ju
ua
Ap
a
ar
M
Ju
m
nu
to
m
em
Au
M
br
ce
ve
Ja
pt
2018 2019 2020 $/lb $/lb $/lb
60Frozen redfish fillet prices have
held up well, with lower volumes
250,000 $3.50
$3.00
200,000
$2.50
150,000
$2.00
$1.50
100,000
$1.00
50,000
$0.50
0 $0.00
January February March April May June July August September October November December
2018 2019 2020 $/lb $/lb $/lb
61Holiday and Lent outlook
Favorable Unfavorable
• Many species have seen • The US is in a period of
price recovery as supply extreme uncertainty
cutbacks balance demand because of the election and
• Seafood consumption unknown economic
trends continue to be response.
favorable • Failure to control Covid-19
• Trends in crab and lobster could lead to serious
indicate strength for the downturn over the winter.
holidays • Any increases in seafood
• Chinese export market supply likely to put
should be strong downward pressure on
prices
62LFA 34 Lobster Season is key
• Generally major price changes occur
when new supplies are available
• Shortage of lobsters in Maine is
supporting current pricing.
• If LFA season is slow, prices will go
higher.
• Significant world-wide demand for
lobster should absorb heavy landings
• This is the primary reason for optimism
63Snow Crab demand is now a
cultural phenomenon in the US
• Snow crab consumption has become a cultural
phenomenon in the US
• The extreme popularity of crab, plus the easy
availability at retail, has made snow crab an
iconic food in parts of the US.
• This cultural propensity is the same phenomenon
that drives high value seafood products in Asia
• Unless there is a very serious economic collapse,
there is no reason to think snow crab is going to
fall out of its current trading range
64Salmon offerings continue to be disrupted,
providing Canadian opportunity
• Air transport problems will not be solved
quickly, leading to a longer-term advantage
for Canadian fresh salmon producers
• Foodservice weakness and the possibility of
debts paralyzing seafood distribution is a
risk, as the Canadian industry is heavily
foodservice oriented
65To answer our original question: the
pandemic is not a unique disruptor
The seafood industry has continuously
existed within a framework of supply
uncertainty and trade disruption
In March of this year, not knowing what
to expect, it appeared possible that the
industry could not operate at all.
Six months later, the disruptions are
species specific, and some species have
seen increases in value.
66Canada will continue to depend on the
US Market
• The current crisis in the US
remains a very big threat
• Competent government has the
tools to address both health and
economic issues.
• If US authoritarian corruption
truly takes hold, Canada will have
a significant problem on its
southern border and cannot
continue to rely on the US as a
stable trade and market partner.
• This problem, obviously, would
be bigger than just the seafood
industry.
67Thank You
• Time for Questions
68You can also read