Q2 and First Half 2018 - Quarterly presentation - Wallenius Wilhelmsen Logistics ASA

Page created by Justin Tyler
 
CONTINUE READING
Q2 and First Half 2018 - Quarterly presentation - Wallenius Wilhelmsen Logistics ASA
August 8th 2018

Q2 and First Half 2018
 Quarterly presentation
Q2 and First Half 2018 - Quarterly presentation - Wallenius Wilhelmsen Logistics ASA
Highlights second quarter 2018

  EBITDA adjusted for extraordinary items of USD 159 million

  Underlying positive volume development, especially for high & heavy

  However, ocean results impacted by lower rates, increased
  net bunker cost and unfavorable currency movements

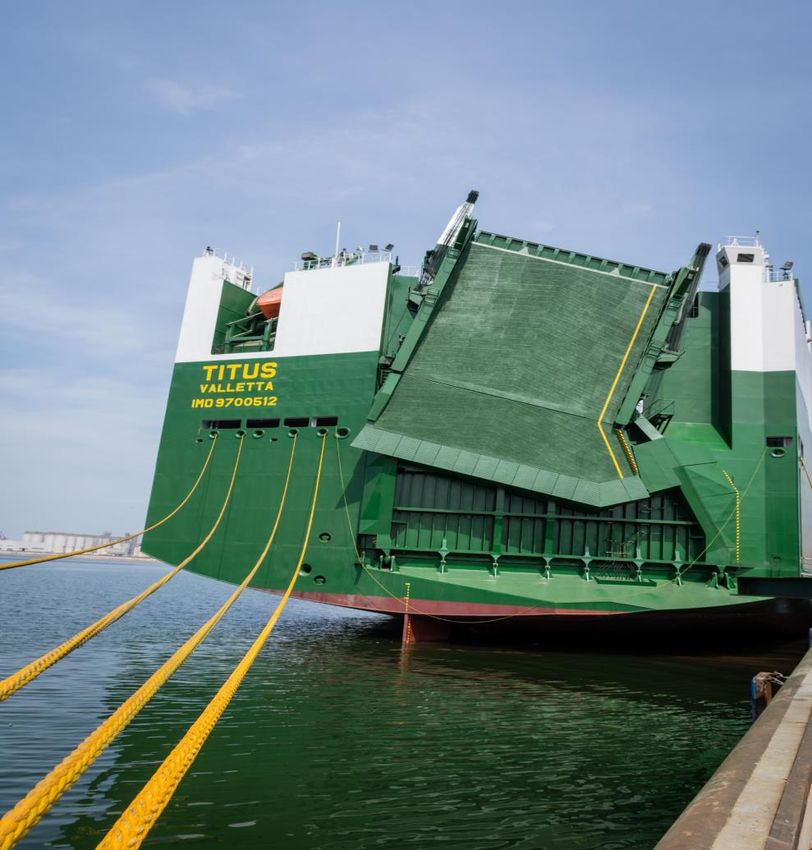
  The newbuilding “Titus” was delivered end of May 2018

  About USD 110 million in synergies confirmed

  Acquisition of 70% of Syngin Technologies for about USD 30 million

                                                                        2
Q2 and First Half 2018 - Quarterly presentation - Wallenius Wilhelmsen Logistics ASA
Agenda
         Business update

         Financial performance

         Market and business outlook

         Outlook and Q&A
Q2 and First Half 2018 - Quarterly presentation - Wallenius Wilhelmsen Logistics ASA
Business update

by Craig Jasienski
Q2 and First Half 2018 - Quarterly presentation - Wallenius Wilhelmsen Logistics ASA
Business Update                               Financial Performance                Market and Business Outlook   Outlook and Q&A

The positive volume & cargo mix development continued in the quarter

Volume and cargo mix development
                                                                                                                                                 Comments
Million CBM and %
                                                                                      Total prorated volumes1             Cargo mix2

Million CBM                                                                                               +3%             +12%
                                                                                                                                       %
                                                                                                                                                • Positive volume development partly offset by
20
       18,7
              19,5            19,4
                                                                                                               18,8
                                                                                                                                           35     reduced contracted HMG volumes, up 3% y-o-y
                      18,2                    18,2                                                                             18,5
                                      18,0                                                     18,0
                                                              16,8                                     17,0            16,5    29,2%
                                                                                                                                                     • The Atlantic, Asia-South America and partly the Asia-
                                                                              16,2      16,2                           28,0%
                                                                                                                                           30
                                                      15,5            15,2                                                                             Europe trade experienced strong growth
                                                              25,7%                            26,0%   26,3%   26,1%
                      25,1%           25,3%                           25,4%
15    24,9%                                           24,9%
              23,3%
                              24,0%                                                    24,2%                                               25        • The Oceania trade moved sideways, and the Europe-Asia
                                                                              22,6%
                                              20,4%
                                                                                                                                                       and Asia-North America trade decreased (latter due to
                                                                                                                                           20          reduction in HMG volumes)
10
                                                                                                                                                     • Adjusted for reduced contracted HMG volumes (about 0.5
                                                                                                                                           15
                                                                                                                                                       million CBM) volumes were up about 6% y-o-y

                                                                                                                                           10   • Volumes up 12% q-o-q due to seasonality
  5

                                                                                                                                           5
                                                                                                                                                • Continued positive development for cargo mix with a
                                                                                                                                                  high & heavy share of 29%, up from 28% in the
  0                                                                                                                                        0      previous quarter and 26% in same period last year
      Q3’14 Q4’14 Q1’15 Q2’15 Q3’15 Q4’15 Q1’16 Q2’16 Q3’16 Q4’16 Q1’17 Q2’17 Q3’17 Q4’17 Q1’18 Q2 ’18

1) Prorated volume (WW Ocean, EUKOR, ARC and Armacup)
2) Calculated based on unprorated volumes. Updated figures based on aligned cargo type definition and reporting across all Ocean units                                                                          5
Q2 and First Half 2018 - Quarterly presentation - Wallenius Wilhelmsen Logistics ASA
Business Update                  Financial Performance                       Market and Business Outlook                    Outlook and Q&A

Mixed volume development for the foundation trades y-o-y

                                                                                                           EU - ASIA                                          Asia - EU
                                                             Atlantic Shuttle                              -4%         +4%                                    +5%         +18%

                                                                   +22%         +9%                  3.2         2.9         3.0                                                 3.4
                                                                                                                                                        3.2
                                                                                                                                                                    2.9
                                                                          3.4         3.6
                                                             3.0

                                                                                                   Q2 ’17    Q1 ’18      Q2 ’18                     Q2 ’17      Q1 ’18       Q2 ’18

                                                            Q2 ’17    Q1 ’18      Q2 ’18

                                                                                                                                                                                                   Asia - NA
                   EU/NA – Oceania1)                                                                                                                                                             -14%         +21%
                             -1%          +14%                                                                                                                                             3.4
                                                                                                                                                                                                                     2.9
                     2.0                         2.0                                                                                                                                                    2.4
                                    1.8                                                                                            Asia - SAWC
                                                                                                                                     +21%         +8%
                                                                                                                                                                                          Q2 ’17     Q1 ’18      Q2 ’18
                                                                                                                                            1.2         1.3
                    Q2 ’17         Q1 ’18    Q2 ’18                                                                            1.1

      WWL trade routes
      EUKOR trade routes
      ARC trade routes                                                                                                       Q2 ’17     Q1 ’18      Q2 ’18

Note: Prorated volumes on operational trade basis in CBM
1) Including Cape sailings (South Africa)                                                                                                                                                                                  6
Q2 and First Half 2018 - Quarterly presentation - Wallenius Wilhelmsen Logistics ASA
Business Update                    Financial Performance          Market and Business Outlook   Outlook and Q&A

Flat development for Net freight / CBM in the second quarter

     Net freight / CBM development1)                                                                                       Comments

                                                                                                                         • Net freight / CBM increased by about 1% in the
44
                                                                                                                           second quarter compared with the previous quarter
                                                                                                                           due to changes in trade and cargo mix
                                                                                                                               • The largest volume growth in the quarter was seen in
                                                                                                                                 the Oceania and the Asia-Europe trades, with
42
                                                                                                                                 relatively high net freight / CBM (long distances)
                                                            0%                                         +1%
      41.0                                     40.9                                                                            • Furthermore, the increased high & heavy share also
                        40.5                                                                                    40.5             had a positive impact on net freight / CBM
                                                                       40.2                    40.2
                                                                                                                               • No material changes for rates
40
                                                                                                                         • No material rate changes q-o-q, but rate reductions
                                                                                                                           from contract renewals in 2017 impacted the net
                                                                                                                           freight index with about USD 12 million y-o-y
38
 Q1’17                 Q2’17                   Q3’17                  Q4’17                    Q1’18           Q2’18

 1) Net freight = Freight revenues adjusted for surcharge elements such as BAF, SRC, THC etc
                                                                                                                                                                                        7
Q2 and First Half 2018 - Quarterly presentation - Wallenius Wilhelmsen Logistics ASA
Business Update                   Financial Performance          Market and Business Outlook   Outlook and Q&A

137 vessels operated at the end of the second quarter

Fleet development
                                                                                   Comments
# of vessels
                             Owned      Chartered      Short Term T/C In/Out     • Wallenius Wilhelmsen operated a core fleet of 127
                                                                                   vessels (873K CEU), representing around 22% of the
              131    131     131               132
                                                                 137               global fleet in the second quarter
   127                                                            10
               5      6       6                 9
                                                                                       • One newbuilding (Titus) delivered end of May
                                                                                       • Three vessels from external owners chartered-in
   51         49      50      49                46                49
                                                                                 • In addition, the group continued to leverage the
                                                                                   short-term market and controlled a fleet of 137
                                                                                   vessels at the end of the second quarter (up from
                                                                                   132 vessels in Q1)
   76         77      75      76                77                78                   • The increase of 5 vessels is linked to higher volumes
                                                                                         in certain trades causing operational imbalances to
                                                                                         meet customer commitments

  Q1’17      Q2’17   Q3’17   Q4’17             Q1’18            Q2’18

                                                                                                                                                 8
Q2 and First Half 2018 - Quarterly presentation - Wallenius Wilhelmsen Logistics ASA
Business Update       Financial Performance   Market and Business Outlook   Outlook and Q&A

Wallenius Wilhelmsen took delivery of MV Titus May 31st 2018

 • High Efficiency RoRo (HERO) class vessel specially designed to
   reduce energy consumption and emissions

 • First Chinese built LCTC in the WW Ocean fleet (Xingang yard)

 • MV Titus is the first of a series of four Post-Panamax vessels,
   each with a capacity of 8,000 CEU

 • The second vessel in the series is expected to enter service at
   the end of 2018 and two are scheduled for delivery in 2019

 • WW Ocean already has four vessels of the HERO design in
   operation, which have proven their ability to deliver from an
   operational and environmental perspective

                                                                                                                                   9
Q2 and First Half 2018 - Quarterly presentation - Wallenius Wilhelmsen Logistics ASA
Business Update                 Financial Performance         Market and Business Outlook   Outlook and Q&A

USD 110 million of the USD 120 million synergy target confirmed

Confirmed and realized synergy development
                                                                                                         Comments
USD million

                                                     110                                   120         • At the end of the second quarter about USD 110
                                                                                                         million of synergy target was confirmed
                                           86                                                          • During the quarter about USD 25 million was added
                             76                                                                          to confirmed synergies, mainly through ship
              65
                                                                                                         management, fleet optimization and procurement
   55
                                                                                                       • The annualized run rate for synergies were above
                                                                                                         USD 100 million, up from about USD 80 million in the
                                                                                                         previous quarter

                                                                       0         0                     • The remaining part of the confirmed synergies will
                                                                                                         gradually come into effect over the next 3-6 months
 Q2 2017 Q3 2017 Q4 2017 Q1 2018 Q2 2018 Q3 2018 Q4 2018

        Fleet Optimization        Procurement    Realized savings (annualized)
        Ship Management           SG&A savings

                                                                                                                                                                   10
Business Update            Financial Performance   Market and Business Outlook   Outlook and Q&A

Acquisition of Syngin Technologies – first step into Full Life Cycle Logistics

Acquisition in brief

 • Acquisition of Syngin Technologies (Syngin) for an expected total purchase
   price of about USD 30 million on a cash- and debt-free basis (EBITDA
   multiple of about 6x)
 • The acquisition of Syngin marks the entry into Full Life Cycle Logistics
       • Syngin is a leading provider of automated logistics solutions for
         disposition of used vehicles through an electronic marketplace (in
         North America)
       • Syngin streamlines the movement of vehicles handled by fleet leasing
         companies and remarketers to auction houses through a virtual
         marketplace that matches these stakeholders with transportation
         providers and repair centers
 • The combined strength of WW Solutions and Syngin represents a significant
   opportunity to scale the business, not only within the current scope, but also
   into adjacent customers and geographies
 • Current owners will maintain an ownership stake of 30% and stay highly
   involved in the business for the foreseeable future

                                                                                                                                                 11
IMO 2020 – a risk and challenge for the shipping industry

 • Implementation of the IMO 2020 0.5% global Sulphur cap represents a challenge and
   risk for the shipping industry, with fuel costs expected to increase with about 50%
   combined with a lack of clarity around availability and quality of fuels.
 • Wallenius Wilhelmsen is relatively well covered through Sulphur (BAF) clauses already
   in place for majority of the larger customer contracts and aims to introduce relevant
   clauses for remaining customer contracts
 • To handle this uncertainty, Wallenius Wilhelmsen has arrived at a strategy of
   combining operating with different types of low Sulphur fuel and installing scrubbers
   on the most suitable vessels
 • In June 2018 Wallenius Wilhelmsen decided to initiate a program to retrofit scrubbers
   on 20 vessels over the next few years, increasing the number of vessels in the fleet
   with scrubbers to 25
 • The average cost per scrubber instalment is estimated to USD 6-7 million. The
   scrubbers will be retrofitted during scheduled dry docking to minimize impact on the
   operations and will be financed through available cash and/or credit facilities

                                                                                           12
Financial
performance
by Rebekka Herlofsen
Business update         Financial Performance           Market and Business Outlook   Outlook and Q&A

Consolidated results – second quarter 2018

                        Q2 2018              Q1 2018      Q2 2017                 Comments

Total income             1 044                  968         974                   • EBITDA adjusted of USD 159 million, down 16% y-
Operating expenses       (888)                 (843)       (806)                    o-y and up 24% q-o-q driven by the ocean segment
EBITDA                   156                    125         168                   • Costs of USD 3 million related to the restructuring
                                                                                    and realization of synergies in the second quarter
EBITDA adjusted          159                    128         188
                                                                                  • Net financial items of USD 45 million in the quarter
Depreciation             (86)                   (84)        (83)
                                                                                        • Net interest expense slightly up from the
EBIT                      70                        41       85
                                                                                          previous quarter due to higher interest rates
Net financial items      (45)                       (5)    (103)                          (LIBOR) and net interest-bearing debt
Profit before tax         25                        35      (17)                        • Positive unrealized gains on interest rate hedges
Tax income/(expense)      (4)                   (25)         (3)                          offset by negative movements in currency /
                                                                                          currency derivatives
Profit for the period     21                        10      (20)
                                                                                  • Tax expense of USD 4 million in the second quarter,
EPS                      0.04                  0.02        (0.06)                   primarily related to income tax

                                                                                                                                              14
Business update                            Financial Performance              Market and Business Outlook          Outlook and Q&A

Ocean segment – second quarter 2018

Total income and EBITDA ocean segment1
                                                                                                                                        Comments
USD million

Total income                                               EBITDA                                                                      • Total income was USD 842 million, up 5% y-o-y due to
                                                                                                                                         increased volumes and fuel compensation
                                                                                               Adjustments
                          +5%            +12%
                                                                                                                                       • EBITDA adjusted of USD 136 million, down 16% y-o-y
                                                                                   -16%                 +23%
                                                                                                                                             •   Reduced contracted HMG volumes
                                832           842                            170
           798                                                       162                  160                                                •   Lower rates (USD 12 million)
                    775
                                      750
  719                                                                                                                                        •   Higher net bunker cost (USD 20 million)
                                                                                                             136
                                                            123                                                                              •   Unfavorable currency movements (USD 10 million)
                                                                                                   111
                                                                                                                                             •   Trade imbalance and inefficiencies
                                                                     145     162
                                                                                          157                                          • The negative impact from above factors partly offset by
                                                                                                             134
                                                                                                                                         underlying strong volume development, increased high
                                                                                                   109
                                                                                                                                         & heavy share and realization of synergies
                                                                                                                                       • EBITDA adjusted in the second quarter was up 23%
                                                                      17       8           3        2          2                         compared to the previous quarter due to seasonality
 Q1’17   Q2 ’17 Q3 ’17 Q4 ’17 Q1 ’18 Q2 ’18
                                                           Q1’17    Q2’17   Q3 ’17 Q4 ’17 Q1 ’18 Q2 ’18

1) Adjusted for restructuring costs and other non-recurring items
                                                                                                                                                                                                         15
Business update             Financial Performance           Market and Business Outlook   Outlook and Q&A

Net bunker costs increased with USD 26 million y-o-y

Net bunker cost development y-o-y                                                                Comments

    50                                                                                       •     Net bunker cost in the quarter increased
                                                                                                   by USD 26 million y-o-y driven by
                                                                                                   increased bunker prices and higher
                 24                                                                                bunker consumption (due to more voyage
                                                                                                   days)
                                                                                             •     The increased bunker prices had an about
                              26                                                                   USD 20 million negative impact on results
                                                                                                   y-o-y of which about half is related to the
                                                                                                   lag effect and the other half relates to lack
                                                                                                   of BAF and/or structure of the BAF in
                                                                                                   some customer contracts

Bunker cost BAF increase Net bunker      Lag effect      Recurring Volume effect
 increase                cost increase                   element

                                                                                                                                                         16
Business update                       Financial Performance            Market and Business Outlook   Outlook and Q&A

Landbased segment – second quarter 2018

Total income and EBITDA landbased segment1
                                                                                                                                          Comments
USD million

Total income                                                    EBITDA                                                                   • Total income was USD 222, up 16% y-o-y primarily
                                                                                                                                           driven by Keen Transport and the Melbourne
                       +16%                   -4%
                                                                                              -8%             +22%                         terminal
                                        232                                              24
                             221                    222
                                                                                27
                    203                                                                                              25
  186      192                                                                                      24
                                                                      22
                                                                                                         20                              • EBITDA adjusted was USD 25 million, down 8% y-o-y
                                                                                                                                              • Increased SG&A allocations of USD 3 million
                                                                                                                                              • Less profitable customer and service mix for
                                                                                                                                                Solutions Americas – Auto (VSA)

 Q1’17   Q2 ’17 Q3 ’17 Q4 ’17 Q1 ’18 Q2 ’18                                                                                              • The negative impact of above factors was partly
                                                                                                                                           offset by improved contribution from the terminals
                                                                  Q1’17     Q2 ’17 Q3 ’17 Q4 ’17 Q1 ’18 Q2 ’18
                                                                                                                                           (Melbourne terminal fully operational from Jan
                           Solutions Americas (auto)      Solutions APAC/EMEA        Other
                           Solutions Americas (H&H)       Terminals                  Adjustments                                           2018) and Keen transport (acquired late 2017)

1) Adjusted for restructuring and other non-recurring items;
                                                                                                                                                                                                  17
Consolidated results – First Half Year 2018

                        1st half 2018   1st half 2017   % change   Comments

Total income               2 012           1 864          8%       • Total income was USD 2 012 million in the first half of
                                                                     2018, up 8% compared to the same period last year due to
Operating expenses        (1 731)         (1 554)         11%
                                                                     increased revenues for ocean and landbased
EBITDA                      281             311          -10%      • Costs of USD 5 million related to the restructuring and
EBITDA adjusted             286             331          -13%        realization of synergies were recorded in the first half of 2018
                                                                     compared to USD 20 million in the first half of 2017
Depreciation               (170)           (165)          3%
                                                                   • EBITDA adjusted of USD 286 million, down 13% y-o-y
EBIT                        111             146          -24%             •   Reduced contracted HMG volumes

Net financial items         (50)           (125)          n/a             •   Lower rates (USD 25 million)

                                                                          •   Unfavorable currency movements (USD 25 million)
Profit before tax            61              20           n/a
                                                                          •   Higher net bunker cost (USD 35 million)
Tax income/(expense)        (29)             19           n/a             •   Trade imbalance and inefficiencies

Profit for the period        31              39          -24%             •   Flat development for landbased

                                                                   • The negative impact from above factors was partly offset by
EPS                         0.06            0.06          n/a        underlying strong volume development, increased high & heavy
                                                                     share and realization of synergies

                                                                                                                                        18
Business update                    Financial Performance               Market and Business Outlook         Outlook and Q&A

Cash flow and liquidity development – second quarter 2018

Cash flow and liquidity development
                                                                                                                      Comments
USD million
                                                                                                                     • CAPEX of USD 56 million includes
                                                                                                                            • Instalments for newbuildings (about USD 40 million)
                                            80
             156        1
                                                                                                                            • Dry docking costs (about USD 10 million)

                                  -56                   -69        -2       -6                                       • Net financing of USD 80 million mainly relates to
  649
                                                                                                                            • Regular instalments of about USD 100 million

                                                                                                  517                       • Repayment of NOK 800 million in bond debt that was
                                                                                     -237                                     refinanced in October 2017
                                                                                                                            • Financing for newbuilding delivered: USD 50 million
                                                                                                                            • Refinancing of vessel loans that was repaid during the first
                                                                                                                              quarter of about USD 90 million (linked to legal restructuring)
                                                                                                                            • Increased utilization of credit facilities: About USD 100 million

                                                                                                                     • Interest and financial derivatives negatively impacted by USD 25
                                                                                                                       million from realization of basis swaps linked to bond debt that
                                                                                                                       matured in June 2018
Liquidity   EBITDA   Proceeds    CAPEX      Net       Interest Dividend Taxes paid   Other      Liquidity
Q1 2018              from sale           financing       and      to non                        Q2 2018              • Other includes payment of the EUR 207 million (about USD 245
                     of assets                        financial controlling
                                                                                                                       million) settlement fine from European competition authorities
                                                     derivatives interests

                                                                                                                                                                                                  19
Business update          Financial Performance             Market and Business Outlook   Outlook and Q&A

Balance sheet review – second quarter 2018

Unaudited Balance Sheet 31.06.2018
                                                                                            Comments
USD billion

Assets                               Equity & Liabilities                                  • Total assets of USD 7.5 billion with equity ratio of
                                                                                             37.4%, up from 36.3% last quarter
                                                                                           • Net interest bearing debt of USD 3.2 billion, up by USD
                          7.5                                7.5                             200 million driven by payment of the EUR 207 million
                                                                                             fine from European Competition authorities and
                                                  Equity     2.8                             financing for the newbuilding delivered in May
                                                                                           • Continued high cash and liquidity position with USD
  Non current assets      6.2                                                                517 million in cash and about USD 275 million in
                                                                                             undrawn credit facilities
                                 Non current liabilities     3.4                           • During the quarter two vessels in EUKOR were
                                                                                             refinanced and WW Ocean Holding AS secured a new
                                                                                             unsecured credit facility of USD 100 million which
         Current assets   1.3          Current liabilities   1.3                             replaced similar facilities earlier placed in the operating
                                                                                             entity WW Ocean AS

                                                                                                                                                           20
Market and
business outlook
by Craig Jasienski

                     21
Auto sales in the second quarter were up 3.4% y-o-y

   Global light vehicle (LV) sales per quarter                                                 Global LV sales per main sales region1)

                                                                                             CAGR ’18-23
                                                    +3.4%     -0.6%                                                                                                    APAC         EUR           ME AF            AM
                                                                                             10%

                          24.8                         24.9 23.8           25.6
                                  23.3 22.9 23.0                 23.7 22.9                    9%
  22.3 22.8 22.4                                                                                                                                                                                   Indian Subcontinent
                                                                                              8%

                                                                                              7%                                                                                             East Europe

                                                                                              6%

                                                                                              5%                                                         Middle East/Africa

                                                                                                                                                                                                      South America
                                                                                              4%                                                                                    ASEAN

                                                                                              3%                                                       Greater China
  Q1 Q2 Q3 Q4 Q1 Q2 Q3 Q4 Q1 Q2 Q3 Q4
 2016 2016 2016 2016 2017 2017 2017 2017 2018 2018 2018 2018                                  2%
                                                                                                                North America                                                                Central Europe

• Sales in North America moved sideways y-o-y, but strengthened 11.0% q-o-q on seasonality    1%
                                                                                                          Oceania
• Western European sales increased 2.3% y-o-y, up from a seasonally strong first quarter      0%

• The Chinese market strengthened another 5.0% y-o-y despite abolishment of the               -1%
                                                                                                                                                   West Europe
  temporary tax cut in December 2017, while declining 7.2 % q-o-q                             -2%
                                                                                                                          Japan/Korea

                                                                                                    -4%   -3%       -2%     -1%    0%   1%   2%   3%   4%    5%        6%     7%   8%   9%     10% 11% 12% 13%
• The Russian and Brazilian markets concluded another quarter of strong growth
                                                                                                                                                                                                    Q2’18 vs Q2’17

Source: IHS Markit
1) Size of circle indicates auto sales in Q2 2018                                                                                                                                                                        22
Auto exports in the second quarter were up 6.5% y-o-y

   Global LV export per quarter                                                             Global LV export per main sales region1)

                                                       +6.5%       +4.9%                  CAGR ’18-23
                                                                                                                                                           EUR          APAC           ME AF             AM
                                                                                          10%

                                                                        3.9         4.1
          3.7      3.7     3.7             3.7        3.7   3.8   3.7         3.8          9%                                                                                            Greater China
  3.5                              3.6
                                                                                           8%

                                                                                           6%
                                                                                                                                                                 North America
                                                                                           5%
                                                                                                        South America
                                                                                           4%

                                                                                           3%
  Q1 Q2 Q3 Q4 Q1 Q2 Q3 Q4 Q1 Q2 Q3 Q4                                                                                                          Europe
                                                                                           2%                                South Asia
 2016 2016 2016 2016 2017 2017 2017 2017 2018 2018 2018 2018                                                                                                                      Middle East/Africa
                                                                                           1%
• Total exports increased 6.5% y-o-y and 4.9% q-o-q
                                                                                                                         South Korea
                                                                                           0%
• North American exports increased 9.0% y-o-y and 2.6% q-o-q as Mexican production                                                                      Japan

  continued to be ramped up                                                                -1%

• Exports out of Europe increased 4.6% y-o-y and 5.7% q-o-q                                -2%
                                                                                              -20%      -15%      -10%      -5%           0%     5%       10%         15%        20%        25%          30%
• Chinese exports grew 32.6% y-o-y and 19.8% q-o-q with continued production ramp-up
                                                                                                                                                                                        Q2’18 vs Q2’17

Source: IHS Markit
1) Size of circle indicates auto exports in Q2 2018                                                                                                                                                            23
Auto tariffs: Potential impact on Wallenius Wilhelmsen

• The ongoing trade tension and possibility of new tariffs for auto imports to
  the US represents a risk for Wallenius Wilhelmsen.
• Imports to the US (from outside NAFTA) were about 3.7 million units in
  2017, majority of volumes imported from Europe, South Korea and Japan
• Wallenius Wilhelmsen is always prepared for changes in global deep-sea
  volumes and changing sourcing patterns
• A short term direct effect of 20-30% auto volume reduction is not
  expected to be substantial (
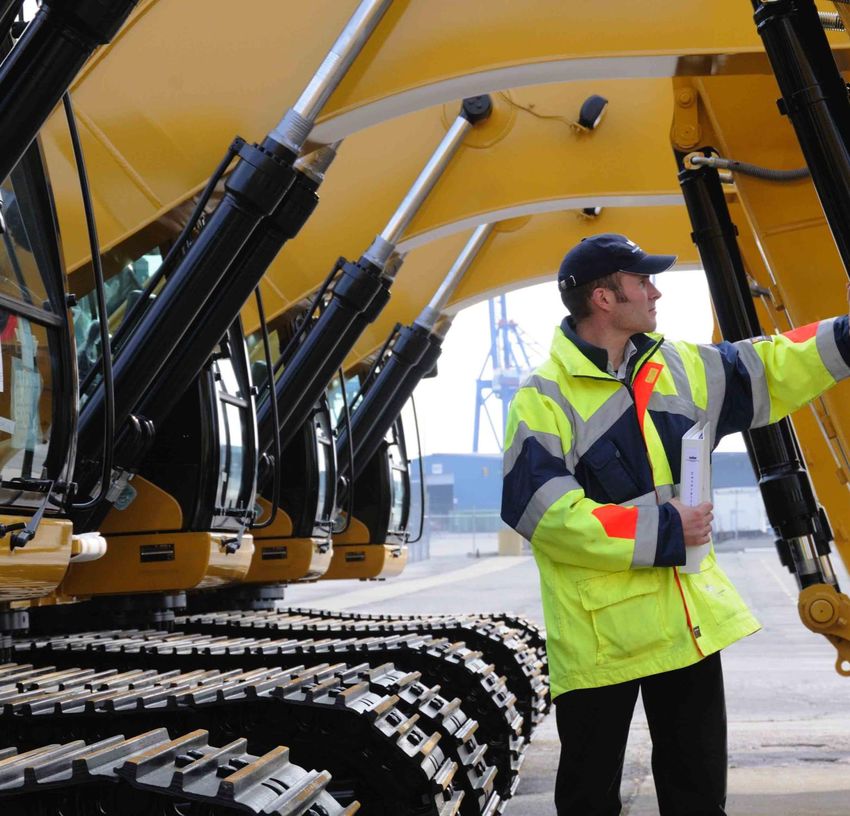
Construction machinery markets continue to be very solid globally

     Global construction and rolling mining equipment exports1                                                     Market commenst2

   Machinery exports                                                               Machinery exports
   (Quantity avg. L12M)                                                         (Growth L3M y-o-y %)
                                                                                                              • Global construction machinery trade growth decelerated to 15% y-o-y, but North
   50k                                                                                         35%
                                                                                                                American, European and Australian imports kept growing strongly
                                                                                               30%
                                                                                                              • OEM majors continued to report broad-based geographical demand growth led
                                                                                               25%
                                                                                                                by Asia, with strong order development
   45k
                                                                                               20%
                                                                                                              • US construction spending increased and leading non-residential indicators
                                                                                               15%
                                                                                                                continued to signal expansion, while housing starts and permits slowed from the
                                                                                               10%              previous quarter
   40k
                                                                                               5%
                                                                                                              • EU construction output edged up in the period, and the European construction
                                                                                               0%               confidence strengthened along with the Eurozone construction PMI
                                                                                               -5%
   35k                                                                                                        • The Australian construction industry extended its period of growth in the quarter,
                                                                                               -10%             albeit at reduced rate, and construction confidence remained healthy despite
                                                                                               -15%             some softening
   30k                                                                                         -20%
         01/12 07/12 01/13 07/13 01/14 07/14 01/15 07/15 01/16 07/16 01/17 07/17 01/18

                          Machinery exports (L12M)     Machinery export growth (L3M)

Source: 1IHS Markit | World (major exporters excl. China (due to incomplete reporting)) construction and rolling mining equipment exports (equipment valued >20 kUSD ) (Avg. units L12M (last 12 months) and L3M
(last 3 months) y-o-y %). Data cut-off: 04.2018 2Caterpillar Inc., Volvo AB, Komatsu Ltd., US Bureau of the Census, AIA, Dodge Data & Analytics, Eurostat, IHS Markit, AiGroup, NAB                                25
Mining equipment demand continues to strengthen on replacement
needs, but the geographical differences remain significant
     Global mining equipment deliveries and iron ore price1                                                           Regional mining equipment deliveries

   Equipment deliveries                                                               Iron ore price                                                       600          Europe
                                                                                                                700         North America                                                       -5 %
   (Indexed)                                                                                (USD/t)
                                                                                                                                               -64 %                                                    1 000              Asia
   200                                                                                         200
                                                                                                                                                                                                                                          -48 %
                                                  Equipment deliveries      Iron ore price                                                                  0
   175                                                                                         180                                                           2Q12      2Q14   2Q16       2Q18
                                                                                                                  0
                                                                                               160                 2Q12     2Q14   2Q16     2Q18
   150                                                                                                                                                                                                     0
                                                                                               140                                                                                                          2Q12        2Q14    2Q16     2Q18
   125                                                                                         120
                                                                                                                                                                              Africa
                                                                                                                                                                 400
   100                                                                                         100                                                                                              -56 %
    75                                                                                         80                              Latin America
                                                                                                                      600                                                                                1 000                 Oceania
                                                                                               60                                                                 0
    50                                                                                                                                             -76 %                                                                                   -77 %
                                                                                                                                                                   2Q12   2Q14         2Q16   2Q18
                                                                                               40
    25                                                                                         20                      0                                                                                        0
      0                                                                                        0                        2Q12   2Q14    2Q16     2Q18                                                             2Q12    2Q14     2Q16    2Q18
          1Q09   1Q10     1Q11   1Q12     1Q13     1Q14     1Q15     1Q16    1Q17      1Q18

• Metal prices remained supportive of equipment demand in the quarter                                         • Europe and Asia remained the biggest destinations in the quarter, with volumes driven by
                                                                                                                intra-regional sourcing
• OEMs reported another quarter of strong y-o-y sales growth, with broad-based geographical
  demand and positive order development                                                                       • Oceania and Africa recorded the strongest growth from a year ago, while the sequential
                                                                                                                momentum was driven by Africa and Latin America
• Global surface mining equipment deliveries continued to strengthen from last year, but
  edged down q-o-q as North American deliveries slowed sharply                                                • All regions except Europe remain approximately 50% or more below peak

Source: 1The Parker Bay Company | Surface Mining Equipment Index (Indexed value of large surface mining equipment deliveries, 2007 = 100), MarketIndex | Average quarterly iron ore price (USD/t) (not adjusted for
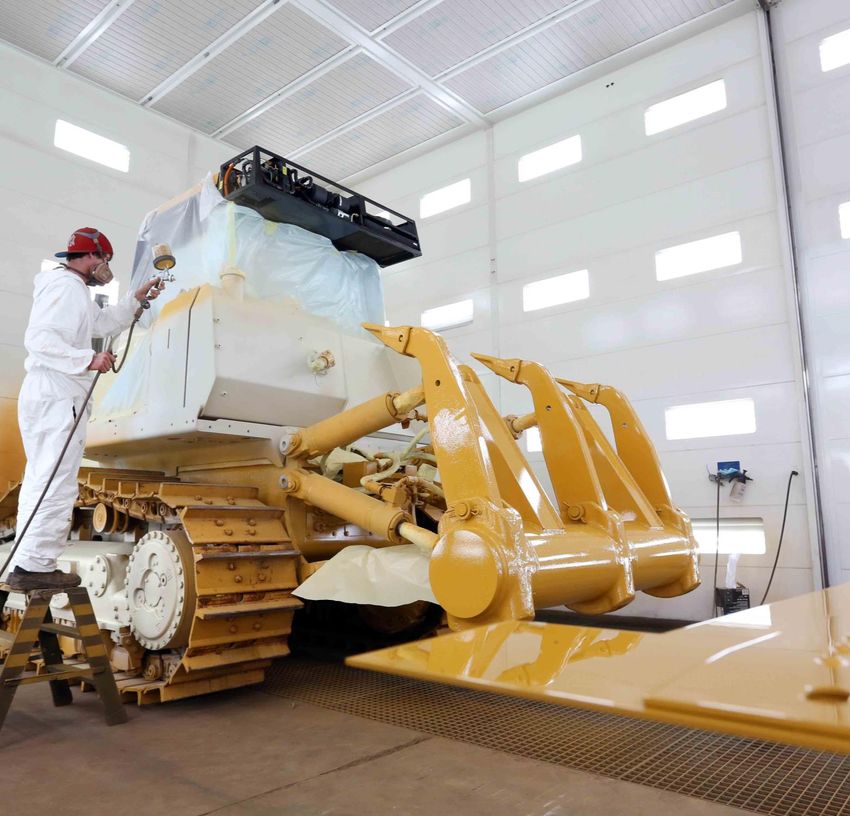
trading days) 2The Parker Bay Company | Value of large surface mining equipment deliveries (USD million, avg. last 12 months)                                                                                                                      26
Agriculture machinery markets continue to be mixed as farm
fundamentals remain under pressure
     Global agriculture equipment exports1                                                                         Tractor sales and registrations2

   Machinery exports                                                               Machinery exports              Sales/registrations
   (Quantity avg. L12M)                                                         (Growth L3M y-o-y %)              (Growth y-o-y %)

   35k                                                                                          35%                30%                                                                 Sales/registrations (YTD)
                                                                                                                                                                                       Sales/registrations (2Q18)
                                                                                                30%
                                                                                                                   20%
                                                                                                25%
                                                                                                                   10%
                                                                                                20%
   30k                                                                                                              0%
                                                                                                15%

                                                                                                10%               -10%

                                                                                                5%                -20%
                                                                                                                            Australia        UK         Germany         France         Brazil           US
                                                                                                0%
   25k
                                                                                                -5%            • US sales continue to show signs of stabilization on replacement needs

                                                                                                -10%           • European markets were mixed, and farmers are facing softening EU milk prices and drought
                                                                                                                 conditions in Eastern Europe
                                                                                                -15%

   20k                                                                                          -20%
                                                                                                               • Australian sales remained healthy, but heightened concerns over drought has taken farmer
         01/12 07/12 01/13 07/13 01/14 07/14 01/15 07/15 01/16 07/16 01/17 07/17 01/18                           confidence to a five-year low

                                                                                                               • The Brazilian market contraction ended in the quarter, and the midyear market reset of
                          Machinery exports (L12M)     Machinery export growth (L3M)
                                                                                                                 financing rates could provide some tailwind

Source: 1IHS Markit | World (major exporters excl. China (due to incomplete reporting)) agriculture equipment exports (equipment valued >20 kUSD ) (Avg. units L12M (last 12 months) and L3M (last 3 months) y-o-y
%). Data cut-off: 04.2018 2TMA, KBA, Axema, ANFAVEA, AEA, Seaport| Registrations: UK (+50Hp), Germany (+70 kW), France (Standard tractors). Sales: Australia (+100Hp – April and May only), Brazil (All tractors),   27
US (+100Hp, 4WD) (Units YTD and 2Q18, y-o-y %)
No new order activity or open vessels were reported in the second quarter

     Car Carrier Fleet Orderbook                                                               Open Vessels and Time Charter Rates
     # vessels equal or above 4000 CEU                                                         # of vessels and USD/day
                                                                                             TC Rate, $/day                                                                              Number of vessels
          24
                                                                                           25 000                                                                                                         50
                                                                                                                                                                                                          45
                             9                                                             20 000                                                                                                         40
                                                                                                                                                                                                          35
                                                                                           15 000                                                                                                         30
                                                                                                                                                                                                          25

                                                12                                         10 000                                                                                                         20
                                                                                                                                                                                                          15
                                                                                            5 000                                                                                                         10

                                                              2                 1                                                                                                                         5
                                                                                                0                                                                                                         0

                                                                                                         9/15

                                                                                                                        3/16

                                                                                                                               6/16

                                                                                                                                         9/16

                                                                                                                                                          3/17

                                                                                                                                                                 6/17

                                                                                                                                                                         9/17

                                                                                                                                                                                            3/18

                                                                                                                                                                                                   6/18
                                                                                                                12/15

                                                                                                                                                 12/16

                                                                                                                                                                                 12/17
      Orderbook             2018               2019          2020             2021

                                                                                                                   6500 CEU           5000 CEU           2000-5999 CEU          6000+ CEU

• The current orderbook counts 24 vessels1                                                 • Time charter rates continued to rise in the second quarter
• Five car carriers have been delivered in 2018, with one delivery in the second quarter   • No open vessels were reported in the period
• Current markets and earnings do not justify new ordering activity
• However, necessary replacement may start to feature

Source: Clarksons Platou 1Vessels equal or above 4000 CEU
                                                                                                                                                                                                               28
Outlook and
Q&A
by Craig Jasienski
Business update     Financial Performance   Market and Business Outlook   Summary and Q&A

Outlook

Current positive volume and cargo mix development expected to continue,
but underlying reduced HMG contractual volumes will continue to impact results

Increased realization of synergies will positively impact results

Tonnage supply/demand balance has improved, but rates remain
at a non sustainable level

Negative rate impact of USD ~7 million y-o-y expected in the third quarter (limited effect q-o-q)

Current bunker prices indicate about USD 10 million in higher net bunker costs in the third
quarter compared to same period last year (changes during the quarter not accounted for)

Challenges with trade imbalances expected to continue short term

                                                                                                                             30
Thank you!
You can also read