Investor and Analyst Presentation - FY 2016 February / March 2017 - Gerresheimer

Page created by Enrique Carrillo
 
CONTINUE READING
Investor and Analyst Presentation - FY 2016 February / March 2017 - Gerresheimer
Investor and Analyst Presentation
FY 2016
February / March 2017
Investor and Analyst Presentation - FY 2016 February / March 2017 - Gerresheimer
Agenda

         1. Introduction to Gerresheimer
         2. Market backdrop and strategic ambitions

         3. FY 2016 review & Outlook

         4. Backup

                                       Feb 2017   FY 2016 Earnings   2
Investor and Analyst Presentation - FY 2016 February / March 2017 - Gerresheimer
A leading international manufacturer for the global pharma and
healthcare industry

 Pharmaceutical packaging solutions made out of glass and plastics

 Primary packaging products and medical devices for storage, dosage and safe administration
 of drugs as well as packaging for the cosmetics industry

                                                                             Feb 2017   FY 2016 Earnings   3
Investor and Analyst Presentation - FY 2016 February / March 2017 - Gerresheimer
Strong business foundations, efficient and lean organisation
with a strong track record
Solid financial profile                       Leading market positions in Well invested assets &                                                       Homogenous business
                                              attractive niche markets    factories, solid customer                                                    portfolio with clear
                                                                          basis                                                                        strategic focus
                                                                                                                                    Delivering to
    Revenues                 adj. EBITDA               #1                             #1
     FY 2016                   FY 2016                                                                    36 plants in                  97
                                               in Europe for plastic             in the US for
EUR 1,375.5m            EUR 307.8m                packaging and                prescription and           14 countries            countries over 5     Focus on Pharma and
                                                    inhalation                    injectables                                       continents
                                                                                                                                                       Cosmetics
 Strong Cash Flow generation                                                                                   Over                 Supplying all
  and lower capital intensity                       #2            Strong emerging market                     1500                    Top 10            Greater revenue diversification
                                               in Europe for      presence in South America,                customers            Pharma customers
Adj. EPS after non-controlling interests in                            India and China for plastic                                                     post LSR disposal
                                              diabetes, pens
                FY 2016                                                packaging, pens, moulded
                                               and syringes
                (excl LSR)                                             glass, ampoules, vials and       Largest customer make up for less than 6% of
                                                                               cartridges                              total revenues
              EUR 4.07

Plastics & Devices                                                                     Primary Packaging Glass                                                   6
                                                                                                                                                                               REVENUE SPLIT BY SECTOR
Andreas Schütte                                                                        Uwe Röhrhoff                                                     11

                                                                                                                                                                          83   Pharma & Healthcare: 83%
                                                                                                                                                                               Cosmetics: 12%
    Revenues                 adj. EBITDA      Margin                                         Revenues          adj. EBITDA          Margin                                     Others: 5%
      2016                       2016         2016                                             2016                2016             2016
EUR 765.4m             EUR 204.0m             26.6%                                     EUR 610.6m          EUR 124.7m             20.4%
                                                                                                                                                                               REVENUE SPLIT BY REGIONS
                                                                                                                                                                 2
                                                                                                                                                            15                 Europe (ex. GER): 33%
                                                                                                                                                                          33
                                                                                                                                                                               Germany: 24%
                                                                                                                                                                               Americas: 26%
                                                                                                                                                       26                      Emerging markets1: 5%
                                                                                                                                                                               Other regions: 2%
                                                                                                                                                                     24

 1. According to IMS Health definition of emerging markets for FY 2016. For further details see note 8 of consolidated financial                        Feb 2017               FY 2016 Earnings           4
    statements within FY 2016 annual report
Investor and Analyst Presentation - FY 2016 February / March 2017 - Gerresheimer
Stable and balanced customer basis in Pharma & Healthcare as
well as in Cosmetics
                                                            New organization set to
   Balanced customer              Pass through clauses as   address specialty &
   basis                          mitigating actions        pharma market now in
                                                            place

                             Some of our valued customers

                PHARMA & HEALTHCARE                          COSMETICS

                                                               Feb 2017   FY 2016 Earnings   5
Investor and Analyst Presentation - FY 2016 February / March 2017 - Gerresheimer
Scale underpins leading market position and operating leverage
15.5bn products produced every year – nearly 500 per second
    SYRINGES        PLASTIC BOTTLES   PHARMA GLASS    COSMETICS
                     (INCL. CENTOR)     BOTTLES

   ~ 400m pieces       ~ 5.5bn pcs      ~ 2.5bn pcs       ~ 1bn pcs

  INJECTION VIALS     AMPOULES          INHALERS      CARTRIDGES

     ~ 3bn pcs          ~ 2bn pcs       ~ 100m pcs        ~ 1bn pcs

                                                      Feb 2017   FY 2016 Earnings   6
Investor and Analyst Presentation - FY 2016 February / March 2017 - Gerresheimer
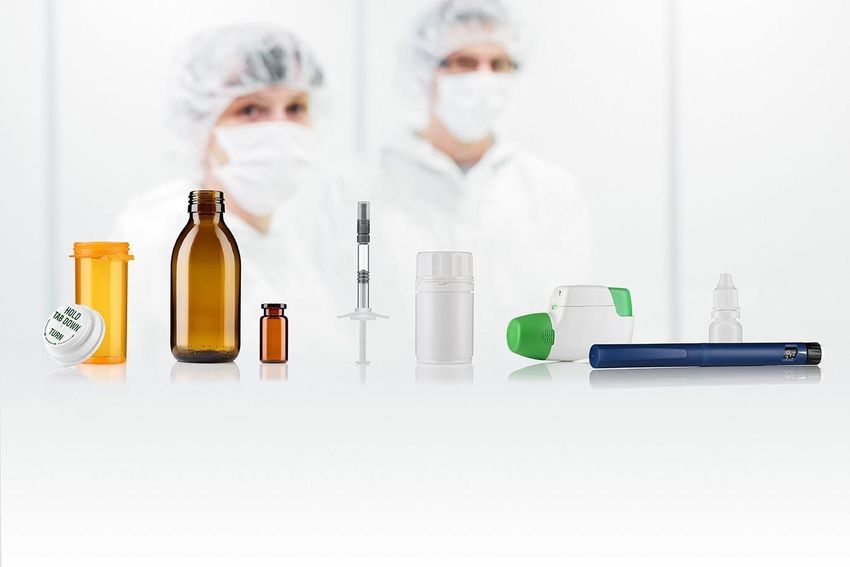
We provide solutions across all key product categories

 DIVISION                                         PLASTICS & DEVICES                                      PRIMARY PACKAGING GLASS

                                                                                                                     OTC Liquids
                           Plastic        Inhalation       Diabetes                            Syringe   MG Pharma   and Syrups         TG
 PRODUCT                  Packaging         (DPI)2        Diagnostics3         Pens
                                                                                               Systems    (Type I)    (Type II &    Injectables
                                                                                                                         III)

 Gerresheimer                                                                                                                    
 Schott                                                                                                                                
 Becton Dickinson1                                                                                
 Nipro1                                                                                                                               
 Ompi                                                                                                                                  
 Jabil Circuit (Nypro)1                                                       
 Consort   Medical1                           
 West Pharma1                                                                    
 Nemera                                                                         
 Berry   Plastics1           
 Facet                                                          
 Ypsomed1                                                                        
 Desjonquères                                                                                                           
 Rocco Bormioli                                                                                                        
 Duran

 Corning1

1. Public company // 2. DPI = Dry Powder Inhaler (World market) // 3. Lancets and lancing devices
                                                                                                                             Feb 2017     FY 2016 Earnings   7
Source: Company estimates
Investor and Analyst Presentation - FY 2016 February / March 2017 - Gerresheimer
Ability to deliver solid earnings growth due to our robust
business model despite fluctuations in revenues growth
     Revenues growth ex. LSR1                                                Adj. EBITDA ex. LSR1              Adj. EPS1,2 ex. LSR
     % yoy                                                                   (EUR m)                           (EUR )

                                            CAGR 2011-2016   6.4%              CAGR 2011-2016   8.3%           CAGR 2011-2016     11.2%
        11.5%
                                                                                             308                                4.07

                                                        7,2%                    207
                                            6.2%                                                                  2.39
                          5.4%

                                     1.9%

         2012             2013       2014   2015        2016                    2011         2016                 2011          2016

                                                Relentless focus on           Organic expansion and         Solid revenues increase
   Combination of organic growth,               driving profitable growth     M&A are both pillars of our   over the past 5 years
   productivity gain, accretive M&A             whilst keeping patient        growth strategy               despite annual
   and portfolio improvements deliver           safety and innovation as a                                  fluctuations, outpaced by
                                                priority                                                    superior profitability and
   superior earnings growth
                                                                                                            earnings growth

1. As reported                                                                                                Feb 2017    FY 2016 Earnings   8
2. After non-controlling interests
Investor and Analyst Presentation - FY 2016 February / March 2017 - Gerresheimer
Agenda

         1. Introduction to Gerresheimer

         2. Market backdrop and strategic
            ambitions
         3. FY 2016 review & Outlook

         4. Backup

                                       Feb 2017   FY 2016 Earnings   9
Investor and Analyst Presentation - FY 2016 February / March 2017 - Gerresheimer
Long term growth drivers such as globalization and population
increase underpinned by megatrends in pharma and healthcare

                                          HEALTHCARE
                                            SYSTEMS
                                          PHAMERGING
                GENERICS                                             SELF MEDICATION
                                           MARKETS

                 Seizing opportunity to participate in any market trends

    RISE OF CHRONIC        NEW MEDICINES            INCREASING REGULATORY
       DISEASES            MARKET ENTRIES               REQUIREMENTS

                                                                           Feb 2017   FY 2016 Earnings   10
Targeted market approach

                      Large pharma companies
                      Generics producers
                      Small and medium Specialty and Biotech                Continuing to
  Segmenting
                      companies
  Customer                                                                  synchronise our
  Landscape
                                                                            strategy to meet
  Understanding
  specific clients   QUALITY
                                Zero defects requirements
                                                                            the needs of our
                                Productivity and supply chain reliability
  requirements
                                Reliable support across the globe
                                                                            customers
                     MARKET
                     ACCESS
                                Global capacities and production network

                                Largest range of product solutions
                     AGILITY
                                Technical and regulatory expertise

                                                                                 Feb 2017   FY 2016 Earnings   11
Strategic ambitions unchanged, further refining our operational
framework to where/how we play

Strategic                       Operational framework
ambitions
                                Evolving customer
                                                      Market Access
                                   landscape

    GROWTH
                                     Quality              Agility

  PROFITABILITY

   INVESTMENT
                  The “right”
 ATTRACTIVENESS                  Product quality &    Best in class
                   customer                                                           M&A
                                    innovation       operating model
                  proposition

                                                                       Feb 2017   FY 2016 Earnings   12
Agenda

         1. Introduction to Gerresheimer

         2. Market backdrop and strategic ambitions

         3. FY 2016 review & Outlook
         4. Backup

                                      Feb 2017   FY 2016 Earnings   13
Further progress on our journey – Proposed dividend increase
of 23.5%

     Delivered on profitable                                     Accelerated cash                                   Continued to refine
     growth                                                      generation and returns                             our business model

     Sales in line                                               Encouraging progress on                            Executed on asset portfolio
           Up 7.2% reported                                      cash generation                                       Disposal of LSR
           Up 2.9% organic 1,2                                         Op. CF margin at 14.3%                          Well invested infrastructures

     Adj. EBITDA margin expansion                                Proposed dividend payout of                        Further strengthened business
     and record earnings                                         25% of adjusted net income                         fundamentals
           Up 190 bps at 22.4%                                   after non-controlling interests                       Quality
           Adj. EPS after non-controlling                              Equivalent to EUR 1.05 per                      Innovation
           interests at EUR 4.22 3                                     Share
                                                                                                                       Industrial efficiency
                                                                       Up 23.5% year-on-year

1. Average budgeted exchange rate assumption for FY 2016 was: EUR 1.00 = USD 1.12
2. Organic growth: At const. FX rates, excluding acquisitions, divestments and optimization of business portfolio                Feb 2017      FY 2016 Earnings   14
3. As a reference, adjusted EPS after non-controlling interests and excluding LSR is at EUR 4.07 for FY 2016
Guidance framework 2017 foresees an adj. EPS after non-
controlling interests between EUR 4.20 and EUR 4.55

 2017 GUIDANCE                                              REPORTED FY 2016                EXPECTED FY 2017

 Revenues                                                   EUR 1,375.5m                    ~ EUR 1.43bn (FXN1 - plus/minus EUR 25m)
 Adj. EBITDA                                                EUR 307.8m                      ~ EUR 320m (FXN1 - plus/minus EUR 10m)
 Adj. EPS after non-controlling interests                   EUR 4.072                       EUR 4.20 – 4.55
 Capex (% sales)                                            8.2%2                           ~8% (FXN1)

1. At const. FX rates, based on FY 2016 reported numbers - Average budgeted exchange rate assumption for FY 2017: EUR 1.00 =
   USD 1.10                                                                                                                    Feb 2017   FY 2016 Earnings   15
2. Excluding LSR
Looking into 2017 – 2018: Continued focus on driving profitable
growth, lifting Adj. EBITDA margin objective to ~23% in FY 2018

 ADDITIONAL OBJECTIVES FOR FY 2018                               REPORTED FY 2016                  EXPECTED FY 2018 (FXN1)

 Organic2 sales growth CAGR 2017-2018                            2.9% (FY 2016 vs FY 2015)         4% to 5%
 Adj. EBITDA margin                                              22.4%                             ~ 23% (previously > 22%)
 Capex (% sales)                                                 8.2%3                             ~ 8%
 Avg NWC (% sales)                                               15.8%3                            16% (previously 17%)
 Op. CF margin (% sales)                                         14.3%                             >13%

 MID TO LONG TERM GOALS                                          REPORTED FY 2016                  EXPECTED MID TO LONG TERM

 Leverage                                                        2.6x                              ~2.5x
 ROCE                                                            12.6%                             >12%
 Dividend policy (as % of adj. NI excl.                          25%                               20% to 30%
 non-controlling interests)

1. At const. FX rates, based on FY 2016 reported numbers - Average budgeted exchange rate assumption for FY 2017: EUR 1.00 =
   USD 1.10
2. Organic growth: At const. FX rates, excluding acquisitions, divestments and optimization of business portfolio              Feb 2017   FY 2016 Earnings   16
3. Excl. LSR
Wrapping up: on the right track to execute on our strategic
priorities
  High pace of portfolio changes                           A leaner and more
  undertaken in the past years
                                                           efficient asset base
  Better geared to support our healthcare
  and cosmetics clients

                                     A clear roadmap to                           Targeted market approach to further
                                                                                  support our clients requirements
                                     further support our
                                                                                  Dedicated team set up to address
                                     clients
                                                                                  biotech and specialty pharma market

  Driving profitable growth with nonetheless               A disciplined financial
  patient safety as upmost priority
                                                           approach
  Rigorous allocation of resources for all
  organic or inorganic projects

                                     A defined pathway to                         To deliver ongoing quality and efficiency
                                     value creation                               enhancements for our customers
                                                                                  To deliver superior earnings growth

                                                                                                  Feb 2017   FY 2016 Earnings   17
Agenda

         1. Introduction to Gerresheimer

         2. Market backdrop and strategic ambitions

         3. FY 2016 review & Outlook

         4. Backup

                                       Feb 2017   FY 2016 Earnings   18
Leading market positions in attractive niche markets

                                                                                                      PRIMARY
    DIVISION                                            PLASTICS & DEVICES
                                                                                                  PACKAGING GLASS

                                                                                                              Ampoules,
                              Plastic           Inhalation     Diabetes                 Syringe   MG Pharma
    PRODUCT                  Packaging            (DPI)2      Diagnostics3    Pens
                                                                                        Systems    (Type I)
                                                                                                                Vials,
                                                                                                              Cartridges

    EUROPE                       #1                 #1            #2           #2         #2         #2          #3

    NORTH
    AMERICA
                                 #1                 #1                                    #2         #1          #1

    EMERGING                      #1                                           #1                    #2          #1
                            (South America                                    (South
    MARKETS                   and India)                                     America)
                                                                                                    (India)     (China)

1. North America: plastic vials for oral prescription drugs
2. DPI = Dry Powder Inhaler (World market)                                                                          Feb 2017   FY 2016 Earnings   19
3. Lancets and lancing devices
Continued to work on our business fundamentals to support
leadership position …
Some 2016 examples
                                                          Client service & responsiveness
           SUSTAINABILITY          QUALITY
                    / CSR          EXCELLENCE                Innovation in products and technologies

      INDUSTRIAL
      EFFICIENCY                           SUPPLY CHAIN
                                           & PLANNING     Quality excellence
                                                             Pursuing zero defect strategy in glass
                          BUSINESS           SALES &         production
                        FUNDAMENTALS         OPERATIONS      Enhancing production and inspection
COMPETITIVENESS                              PLANNING        processes across all product lines

                                           TRAINING &     Industrial efficiency
                                           HR SYSTEMS        Deploying machine strategy in Converting
          NEW PRODUCT                                        Ramping up large scale inhaler project in
          DEVELOPMENT &         CLIENT SERVICE &             Peachtree
          INNOVATION            RESPONSIVENESS               Achieving significant furnace rebuild in
                                                             Cosmetics

                                                                            Feb 2017   FY 2016 Earnings   20
… And to develop innovative product solutions for our
customers
                                              QUALITY & CLIENT FOCUS                  PRODUCTION FEATURES

            Gx RTF ClearJect ®     Higher quality            User safety                COP
                                   Break resistance          Available with all         First batch
            COP Syringe            Suitable for              standard systems           production started
                                   sensitive biologics       (needles, etc)             in Europe

            GX ® Elite             Higher quality
                                                                                        Improved
PHARMA

                                                                                        production
                                                             Whole product
            Glass                  Break resistance
                                                             family now
                                                                                        processes and
                                                                                        enhanced
                                   Suitable for              available
                                                                                        technologies to
                                   sensitive biologics
                                                                                        support quality

            Bio Pack               Substitute for            Available for both
                                   traditional PE and                                   Available on
                                                             Pharma and
                                   PET                                                  existing filling and
                                                             Cosmetics
                                                                                        packaging line
                                   100% Recyclable           applications

            Over 100 innovative
COSMETICS

                                                             Enhanced
                                  Design capabilities                                   State of the art
                                                             decoration
                                  support time to
            products per year     market
                                                             processes,
                                                             enabling greater
                                                                                        printing machines

                                  requirements
                                                             customization

                                                                           Feb 2017   FY 2016 Earnings         21
FY 2016 guidance achieved, reflecting recent changes in our
asset portfolio as well as continuous effort to drive efficiencies…

 CRITERIA1                                                           GUIDANCE FY 2016                              ACHIEVED 2016

 FXN Revenues                                           Approx. EUR 1.4bn (plus/minus EUR 25m)                     EUR 1,383.1bn

 FXN Adj. EBITDA                                        Approx. EUR 305m (plus/minus EUR 10m)                       EUR 311.3m

 Capex (% sales, FXN)                                                          ~ 8%                                    8.2%2

 Avg NWC (% sales, FXN)                                                        ~17%                                   15.8%2

 CRITERIA1                                                        MID TERM OBJECTIVES                              ACHIEVED 2016

 Op. CF margin (% sales FXN)                                            ~13% in FY 2018                                14.3%
 Leverage                                                             around 2.5x mid term                              2.6x
 ROCE                                                                    > 12% mid term                                12.6%
                                                                Payout ratio (20 -30% adj. NI
 Dividends                                                                                                          25% proposed
                                                                Excl. non-controlling interests)

1. Average budgeted exchange rate assumption for FY 2016 was: EUR 1.00 = USD 1.12 for calculation of FXN metrics       Feb 2017    FY 2016 Earnings   22
2. Excluding LSR
FY 2016 increase driven by Plastics & Devices; balanced organic
growth profile across both divisions
Revenues by division
                                                                                                                                    ORGANIC
 EUR M                                                 FY 2016                        FY 2015                       GROWTH IN %
                                                                                                                                  GROWTH1,2 IN %

 Total Group                                            1,375.5                         1,282.9                         7.2                  2.9

     - Of which P&D                                      765.4                          645.3                          18.6                  3.0

     - Of which PPG                                      610.6                          651.0                           -6.2                 2.7

1. Organic growth: At const. FX rates, excluding acquisitions, divestments and optimization of business portfolio                 Feb 2017         FY 2016 Earnings   23
2. Average budgeted exchange rate assumption for FY 2016 was: EUR 1.00 = USD 1.12
Q4 2016: Revenues by division

                                                                                                                                    ORGANIC
 EUR M                                                 Q4 2016                        Q4 2015                       GROWTH IN %
                                                                                                                                  GROWTH1,2 IN %

 Total Group                                             357.6                           350.8                          2.0                  4.7

     - Of which P&D                                      199.4                          186.1                           7.2                  7.2

     - Of which PPG                                      158.3                          167.3                           -5.3                 1.9

1. Organic growth: At const. FX rates, excluding acquisitions, divestments and optimization of business portfolio                 Feb 2017         FY 2016 Earnings   24
2. Average budgeted exchange rate assumption for FY 2016 was: EUR 1.00 = USD 1.12
Strong margin expansion at Group level, driven by Plastics and
Devices and continued productivity improvements
Adjusted EBITDA by division
                                      FY 2016                         FY 2015
                              EUR M             MARGIN IN %   EUR M             MARGIN IN %
 Total Group                  307.8                22.4       262.6                   20.5
   - Of which P&D             204.0                26.6       141.6                   21.9
   - Of which PPG             124.7                20.4       143.7                   22.1

                                                                           Feb 2017      FY 2016 Earnings   25
Q4 2016: Adjusted EBITDA and margin by division

                            Q4 2016                         Q4 2015
                    EUR M             MARGIN IN %   EUR M             MARGIN IN %
 Total Group         82.5                23.1       81.9                    23.3
   - Of which P&D   55.3                 27.7       48.2                    25.9
   - Of which PPG   31.6                 19.9       40.5                    24.2

                                                                 Feb 2017      FY 2016 Earnings   26
Working on 3 main levers to protect and build margins

                                                                               PRODUCTIVITY AND
            MIX                     VOLUME GROWTH
                                                                               EFFICIENCY

        Mix management          Direct impact on operational           Increasing productivity
                                leverage                                     Labour
        Higher value products
                                Increase contribution margin                 Machines
                                through higher volumes                       Higher yields
                                                                       Driving manufacturing efficiencies

            PRICING             Pricing as a function of volumes

                                Cost inflation mainly through personal costs
            COST INFLATION
                                Pass through clauses as mitigating actions

                                                                                   Feb 2017      FY 2016 Earnings   27
FY 2016 shows almost 50% increase in Net Income

 IN EUR M                                                                                   FY 2016                     FY 2015         CHANGE

 Adjusted EBITDA                                                                              307.8                       262.6              +45.2
 Depreciation                                                                                 -86.91                      -84.5              -2.4
 Adjusted EBITA                                                                               220.9                       178.1              +42.8
 FY15 Effects from Centor, tubing and portfolio optimization                                   -3.3                       24.7               -28.0
 One-off income and expenses                                                                   -0.5                        -0.4              -0.1
 Total one-off effects                                                                         -3.8                       24.3               -28.1
 Amortization of fair value adjustments                                                       -36.6                       -20.4              -16.2
 Result from operations (EBIT)                                                                180.5                       182.0              -1.5
 Net finance expense                                                                          -33.5                       -34.6              +1.1
 Result before income taxes                                                                   147.0                       147.4              -0.4
 Income taxes                                                                                 -42.5                       -43.4              +0.9
 Income tax rate                                                                             (28.9%)                    (29.4%)                -
 Net income from continuing operations                                                        104.5                       104.0              +0.5
 Net income from discontinued operations                                                      63.72                        8.7               +55.0
 Net income                                                                                   168.2                       112.7              +55.5

1. Including EUR 0.2m of impairment losses unrelated to portfolio optimisation
2. Including book gain from the disposal of LSR of EUR 74.3.m, related project costs and tax expenses amounting respectively to   Feb 2017         FY 2016 Earnings   28
   EUR 4.4m and EUR 13.8m, as well as the net income from LSR
Reaching another record Adjusted EPS after non-controlling
interests in FY 2016
Reconciliation of net income to adjusted EPS after non-controlling interests
 IN EUR M                                                                                       FY 2016                       FY 2015                  CHANGE

 Net income                                                                                       168.2                         112.7                       +55.5

 Total one-off effects                                                                            -66.11                        -24.3                       -41.8

 Amortization of fair value adjustments2                                                           38.1                          22.3                       +15.8

 One-off effects included in net finance expense                                                    0.2                           6.5                       -6.3
 Total tax effect related to total one-offs, FVA and one-off
                                                                                                    -0.6                         -1.3                       +0.7
 effects included in net finance expense
 One-off tax related effects                                                                        -0.8                         +1.8                       -2.6

 Adjusted net income3                                                                             139.0                         117.7                       +21.3

 Adjusted net income attributable to non-controlling interests                                      6.4                          10.7                       -4.3

 Adjusted net income after non-controlling interests4                                             132.6                         107.0                       +25.6

 Adjusted EPS after non-controlling interests in EUR                                               4.22                          3.41                       +0.81

1. Including the book gain from the disposal of LSR of EUR 74.3m, as well as the related project cost amounting to EUR 4.4m
2. Including expenses of EUR 1.5m (FY15: EUR 1.9m) which is shown in the line discontinued operations in the Group P&L
3. Adjusted net income: Consolidated net income before non-cash amortization of fair value adjustments, restructuring expenses,
   impairment losses, one-off income and expenses (including non-cash expenses) and the related tax effects.
4. Adjusted net income after non-controlling interests is the basis of our dividend distribution. This figure differs from the EPS as reported
   in our accounts according to IFRS and documented within FY 2016 annual report. For a comprehensive overview of the EPS                        Feb 2017      FY 2016 Earnings   29
   calculation for the Group in FY 2016 refer to note (17) of the consolidated financial statements
Encouraging operating cash flow generation as a result of
increased profitability and completed portfolio adjustments

                                            NOV 30, 2016   NOV 30, 2015
                                                                            CHANGE IN %
                                              EUR M          EUR M

 Total assets                                 2,374.3        2,419.4                 -1.9
 Equity                                        763.3          698.1                  +9.3
 Equity ratio                                  32.1%          28.9%             +320bps
 Net working capital                           200.3          213.7                  -6.3
 NWC in % of revenues1                         14.6%          14.5%              +10bps
 Average NWC in % of LTM revenues1             15.8%          18.1%              -230bps
                                              FY 2016        FY 2015        CHANGE IN %
 Cash flow from operating activities           173.5          203.8                  -14.9
 Operating Cash Flow                           197.4          177.0                  +11.5
 Operating CF in % of revenues                 14.3%          13.8%              +50bps
 Capex in % of revenues1                       8.2%           9.7%               -150bps

1. Excluding LSR and at constant currency                                 Feb 2017      FY 2016 Earnings   30
Development of net working capital

                                     NOV 30, 2016   NOV 30, 2015
                                       EUR M          EUR M

 Inventories                            155.4          186.4
    thereof prepayments made             3.0            6.2
 Trade receivables                      232.1          219.0
 Trade payables                         157.0          160.9
 Payments received on account            30.2           30.8
 of orders
 Net working capital                    200.3          213.7

 NWC in % of revenues1                  14.6%          14.5%
 Average NWC in % of LTM revenues1      15.8%          18.1%

1. Excluding LSR, FXN                                              Feb 2017   FY 2016 Earnings   31
Development of inventories

                                           NOV 30, 2016   NOV 30, 2015
                                             EUR M          EUR M

 Raw materials, consumables and supplies       50.0           50.8
 Work in progress                              18.4           24.2
 Finished goods and merchandise                84.0          105.2
 Prepayments made on inventories               3.0            6.2
 Inventories                                  155.4          186.4

                                                                         Feb 2017   FY 2016 Earnings   32
Net financial debt reduction achieved, Group’s leverage target
almost reached a year ahead
 Net debt and financial leverage1                                                           Net debt summary
       Net Debt(2)
       Leverage (x)(1)
                                                                                               IN EUR M                              FY 2016           FY 2015
                         878                                                                   Drawn portion of RCF                   162.7              232.8
      900
      890
      880
      870
      860                                          788                4,0
      850
      840
      830
      820
      810                                                             3,8
      800
      790
      780
      770
      760                                                                                      Bonded Loans (Schuldschein)            425.0              425.0
      750
      740
      730
      720
      710                                                             3,6
      700
      690
      680
      670
      660
      650
      640
      630
      620
      610                                                             3,4
      600
      590
      580
      570
      560                                                                                      Bonds                                  300.0              300.0
      550
      540
      530
      520
      510                                                             3,2
      500
      490
      480
      470                 2,9
      460
      450
      440
      430
      420                                                             3,0
      410
      400
      390
      380
      370                                                                                      Local borrowings and leasing            18.9              13.4
      360
      350
      340
      330
      320                                             2.6             2,8
      310
      300
      290
      280
      270                                                             2,6
      260
      250
      240
      230
      220
      210
      200
      190
      180
      170                                                             2,4                      Cash and cash equivalents              118.4              93.7
      160
      150
      140
      130
      120
      110
      100
       90
       80
       70                                                             2,2
       60
       50
       40
       30
       20
       10
        0                                                             2,0                      Total net financial debt               788.2              877.5
                        FY 2015                  FY 2016

    Net Debt decreased by EUR 89.3m as a result of improved                                       Bonded loans (Schuldschein): fixed/variable interest rates,
    adj. EBITDA and increased cash generation                                                     currently between 0.75% and 2.04%;
                                                                                                  (maturity in 2020, 2022 and 2025)
    Leverage ratio decreased from 2.9x to 2.6x
                                                                                                  Bond: Fixed annual coupon of 5.0% (matures in May 2018)
    Well on track to reach leverage target profile of 2.5x
                                                                                                  Revolving bank debt: total capacity EUR 450m;
                                                                                                  variable interest rate

1. Leverage: The relation of net financial debt to adjusted EBITDA of the preceding twelve months, according to the current credit
   facility agreement                                                                                                                Feb 2017   FY 2016 Earnings   33
2. Net Debt defined as: Short and long term debt minus cash and cash equivalent
GXI Key Data
 in EUR per share                     2008           2009           2010            2011            2012     2013    2014           2015             2016

 Adjusted EPS after non-
controlling interests                 1.83           1.34            1.95            2.44           2.622    3.08    2.89               3.41          4.22
 Cash flow from operations
 per share                            5.26           3.74            5.09            4.13            5.53    4.67    5.04               6.49          5.52
 Dividend                             0.40             ---           0.50            0.60            0.65    0.70    0.75               0.85         1.051

 Dividend yield                       1.5%             ---           1.8%           1.9%            1.7%     1.4%    1.7%           1.2%             1.5%
 Payout ratio                         22%              ---           26%             25%            25%2     23%     26%                25%          25%

 Share price high                    38.20           27.05          29.85           36.62           41.34    50.14   56.42          76.32            76.86

 Share price low                     23.99           13.24          22.09           28.30           31.00    37.60   42.31          41.99            57.10

 Share price at FY end               27.10           23.05          28.20           31.17           39.41    49.67   44.44          73.90            68.85
 Book value per share                15.26           15.29          16.86           17.59           17.14    17.94   19.25          22.23            24.31
 P/E ratio3                          14.81           17.20          14.46           12.77          15.042    16.13   15.38          21.67            16.31
 Market cap in EUR m                   851            724            886             979            1,238    1,560   1,395          2,321            2,162

 MDAX weighting year end 11.48%4                    1.33%           1.24%           1.40%          1.47%     1.33%   1.01%          1.42%           1.33%
 Number of shares in
 million                              31.4           31.4            31.4            31.4            31.4    31.4    31.4               31.4          31.4
1.   Proposed appropriation of net earnings
2.   Retrospective restatement due to the early adoption of IAS 19 (amended in 2011) from December 1, 2012
3.   Based on adj. EPS after non-controlling interests
4.   SDAX weighting at year end
                                                                                                                             Feb 2017      FY 2016 Earnings   34
Overview of Abbreviations and Definitions
Abbreviations and Definitions

Adj. EBITDA             Earnings before income taxes, net finance expense, amortization of fair value adjustments, depreciation and amortization, impairment losses, restructuring
                        expenses and one-off income and expenses
Adjusted EPS            Adjusted net income divided by 31.4m shares
Adjusted net income     Consolidated net income before non-cash amortization of fair value adjustments, restructuring expenses, impairment losses, one-off income and
                        expenses (including non-cash expenses) and the related tax effects.
CAGR                    Compound Annual Growth Rate
Capex                   Investments in tangible and intangible assets
EBIT                    Earnings before interest and taxes
EBITA                   Earnings before interests, taxes and amortization
EBITDA                  Earnings before interests, taxes and depreciation and amortization
FXN                     "Foreign currency neutral" - based on budgeted FX-rates
Leverage                The relation of net financial debt to adjusted EBITDA of the preceding twelve months, according to the current credit facility agreement.
Net debt                Short and long term debt minus cash and cash equivalents
Net finance expense     Interest income and expenses and related to the net financial debt of the Gerresheimer Group. It also includes net interest expenses for pension provisions
                        together with exchange rate effects from financing activities and from related derivative hedges.
Net working capital     Inventories plus trade receivables minus trade payables plus/minus prepayments
(NWC)
Op. CF margin           Adjusted EBITDA plus/minus the change in net working capital, minus capex and in relation to revenues
Operating cash Flow     Adjusted EBITDA plus/minus change in net working capital, minus capex
P/E Ratio               Company's share price divided by the adj. EPS after non-controlling interests
RCF                     Revolving credit facility
ROCE                    Adjusted EBITA divided by capital employed (total assets minus investments, investments accounted for using the equity method and other loans, minus
                        cash and cash equivalents, minus pensions (without pension provisions), deferred tax liabilities, and income tax liabilities, minus prepayments received,
                        trade payables, and other non- interest bearing liabilities)
yoy                     year-on-year

                                                                                                                                                            Feb 2017   FY 2016 Earnings   35
Financial calendar and contact details

February 15, 2017   Annual Report Financial Year 2016
April 6, 2017       Interim Report 1st Quarter 2017
April 26, 2017      Annual General Meeting 2017
July 13, 2017       Interim Report 2nd Quarter 2017
October 11, 2017    Interim Report 3rd Quarter 2017

Name                Corporate Investor Relations
Phone               +49 211 6181 257
Fax                 +49 211 6181 121
E-mail              Gerresheimer.ir@gerresheimer.com
IR website          www.gerresheimer.com/ir

                                                        Feb 2017   FY 2016 Earnings   36
Our Vision
Gerresheimer will become the leading global partner
for enabling solutions that improve health and well-being.
Our success is driven by the passion of our people.
You can also read